CiteSpace全球应用特征与核心功能演化
2023-10-19李杰胡志刚侯剑华
李杰 胡志刚 侯剑华


摘要:[目的/意义]旨在了解CiteSpace在全球的应用现状及基于知识基础的功能演化情况,以促进国内学者对CiteSpace深入认识和应用。[方法/过程]通过科学知识图谱方法对Web of Science中收录的965篇CiteSpace论文,从增长趋势、地理分布、研究主题和引文演化四个方面进行了分析。[结果/结论] 过去16年,CiteSpace的应用呈显著增长趋势,应用遍布54个国家或地区,涉及337个不同的城市。我国是CiteSpace应用论文的主要产出国,占比84.9%。在CiteSpace的应用中,VOSviewer和Histcite是常常结合使用的软件,Web of Science是主要数据源。文献计量学中的共被引文献、引文分析、共词分析以及合著分析在CiteSpace应用中最为频繁。常被用来进行热点、研究趋势以及文献综述分析。引文历时网络分析完整呈现了CiteSpace I、CiteSpace II以及CiteSpace III的完整演化过程,并从期刊双图叠加层面,展示宏观层面CiteSpace应用论文和知识基础论文的互动关系。
关键词:CiteSpace;科研产出;科学图谱;共词分析;引文分析
分类号:G202
引用格式:李杰, 胡志刚, 侯剑华. CiteSpace全球应用特征与核心功能演化[J/OL]. 知識管理论坛, 2023, 8(4): 291-302[引用日期]. http://www.kmf.ac.cn/p/352/.
CiteSpace由美国德雷赛尔大学陈超美教授于2003年开发,作为一款基于先进技术的知识可视化工具,在科学研究中迅速被大量使用[1]。自从2007年6月,国内第一篇应用CiteSpace进行科学知识图谱绘制的论文发表以来[2],国内目前已经有近6 400余篇关于CiteSpace的中文期刊论文,且仍处于高速增长中。尤其是近两年,年发文量超过1 700篇。在信息资源管理、教育学、管理学、经济学乃至自然科学领域CiteSpace都得到了广泛的传播和应用。而围绕CiteSpace所发展起来的科学知识图谱研究范式[3],也因为其严谨的定量分析方法、简单易用的操作实现和生动直观的可视化效果,在文献分析和综述方面表现出科学性和艺术性的统一,产生了深刻的学术影响和应用价值。
对于CiteSpace应用现状维度的分析,国内外学者已经做了相关评述。2013年,侯剑华等[4]通过Web of Science简要分析了软件在国外的使用概况,并重点统计中国知网中313篇CiteSpace主题论文。该论文对于了解早期CiteSpace国内外传播和扩散有一定的借鉴意义,但是随着时间的推进,CiteSpace的应用更加深入,扩散更加广泛,有必要进一步对其进行更加深入的分析和研究。2015年,陈悦等[5]基于国内500多篇CiteSpace论文中对图谱“误用”和“滥用”现象进行分析,阐释了CiteSpace工具的设计理念及其方法论功能。2016年,刘光阳[6]通过对各类中文数据库中收录的1 897篇论文进行分析,详细梳理CiteSpace在国内的传播轨迹。在此基础上,2019年,李杰等[7]进一步细化数据范围,通过CSSCI数据库专门考察我国社会科学领域CiteSpace的应用情况并进行系统性的梳理,总结了CiteSpace在社会科学领域的传播特征。
由于上述对CiteSpace的综述研究多集中于其在国内的应用和影响上,因此对其在国际的应用和扩散分析明显不足。事实上,陈超美2006年关于CiteSpace的经典文章在Web of Science中的被引量已经超过1 384次,而直接应用CiteSpace的国际论文数量也已经接近1 000篇,尤其是近几年的增长速度更为惊人。为了获得CiteSpace近20年的扩散及功能演化情况,笔者将基于Web of Science中的CiteSpace主题论文,采用文献计量和数据可视化的方式,进行深入挖掘。首先对CiteSpace主题论文在全球不同国家或区域、不同研究主题、不同期刊领域进行分析,并通过文献共被引的方法,对CiteSpace主题论文的知识基础及其聚类进行分析,以在文献维度上认识CiteSpace功能的演化。
1 CiteSpace论文的国际增长趋势
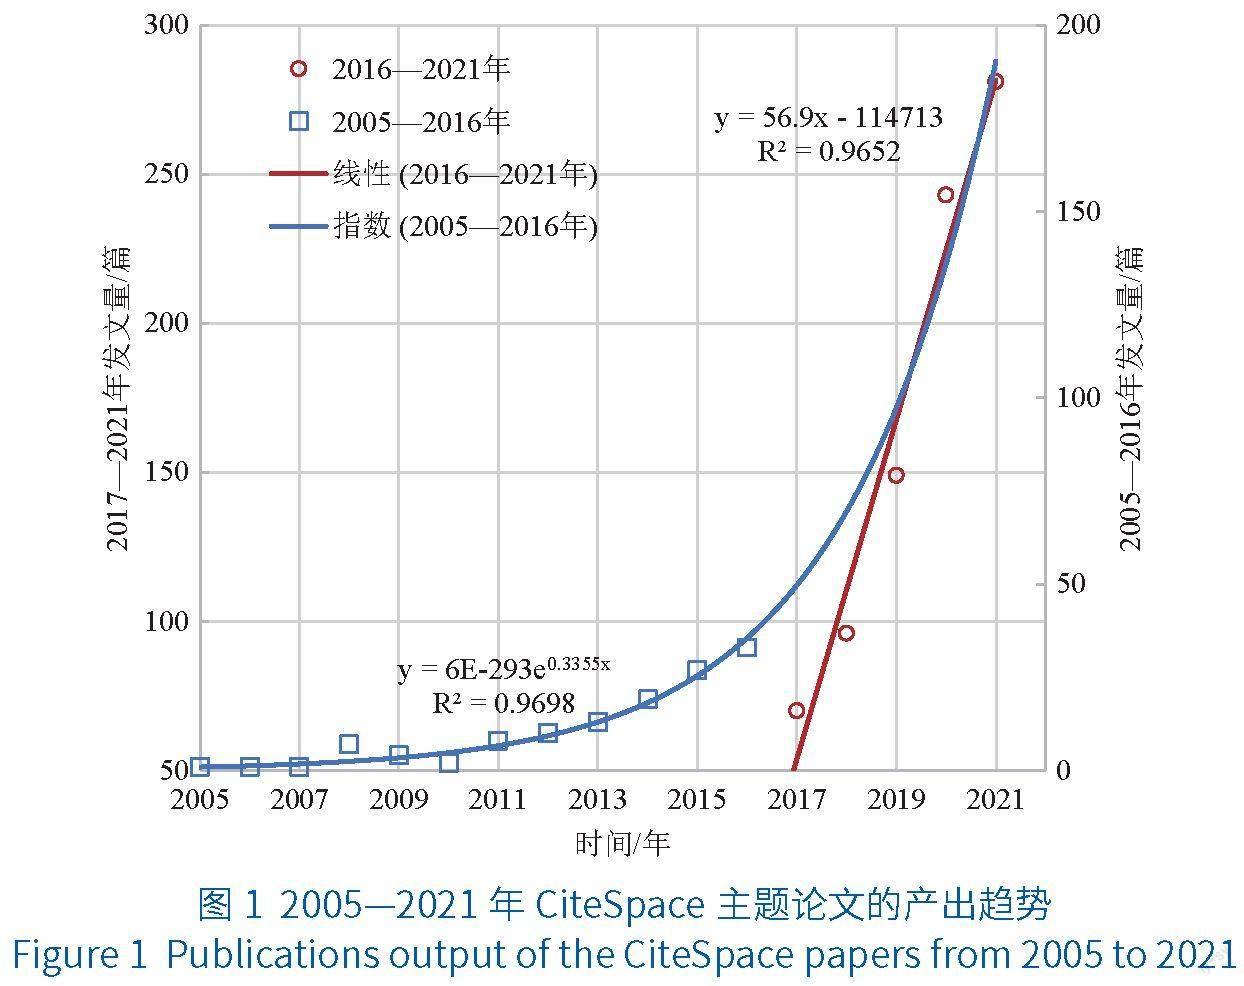
为全面获取代表性的CiteSpace主题论文,笔者以Web of Science核心数据集的SCI-EXPANDED、SSCI、A&HCI、CPCI-S、CPCI-SSH以及ESCI为数据源。时间设置为“all year”,并通过主题CiteSpace进行检索。共得到2005—2021年(截至2021年9月12日)出版的965篇论文。所采集的数据共包括8种文献类型,其中以Article(490篇)、Review(259篇)、Proceedings Paper(202篇)以及Early Access(51篇)为主。图1展示了2005—2021年CiteSpace主题论文的载文趋势分布。结果显示:在2005—2015年,CiteSpace主题论文相对比较缓慢;在2005—2011年,论文的年度产出不足10篇;一直到2016年,年度论文产出仍然不足50篇;2016年以后,CiteSpace主题论文呈现爆发式的增长。
2 CiteSpace国际论文的地域分布
CiteSpace在全球得到了广泛的传播和应用。在国家或地区维度上,CiteSpace已经被54个不同的国家和地区应用。在所有国家和地区中,我国以发文量819篇排在首位,论文占比达到84.9%。排名前10位的国家和地区包括:UNITED STATES(美国,67篇)、AUSTRALIA(澳大利亚,32篇)、BRAZIL(巴西,21篇)、TURKEY(土耳其,17篇)、SPAIN(西班牙,19篇)、UNITED-KINGDOM(英国,25篇)、IRAN(伊朗,12篇)、CANADA(加拿大,16篇)以及PAKISTAN(巴基斯坦,13篇)。在城市分布的维度上,CiteSpace的应用分布在337个不同的城市中,其中主要应用城市群分布在我国东部。经统计发现,城市排名前10位的城市均来自我国,分别为BEIJING(北京,177篇)、SHANGHAI(上海,80篇)、WUHAN(武汉,73篇)、GUANGZHOU(广州,85篇)、CHENGDU(成都,76篇)、NANJING(南京,59篇)、XIAN(西安,47篇)、SHENYANG(沈阳,44篇)、TIANJIN(天津,41篇)和HONG-KONG(香港,39篇)。在合作维度上,我国主要合作对象为美国、加拿大、澳大利亚和英国,城市的合作也主要发生在与我国合作密切的国家中。可见,我国是CiteSpace主题论文最大的产出国,其他国家或地区与我国的差距很大。形成这种空间分布特征的原因是多方面的,其中一个重要方面是CiteSpace最早是在我国普及以及发展的。此外,通过CiteSpace软件下载来看(https://sourceforge.net/projects/citespace),从2018年9月2日到2021年9月13日CiteSpace总下载次数为1 170 844次,我国在全球用户的下载中占比高达91%。
3 CiteSpace国际论文的研究主题
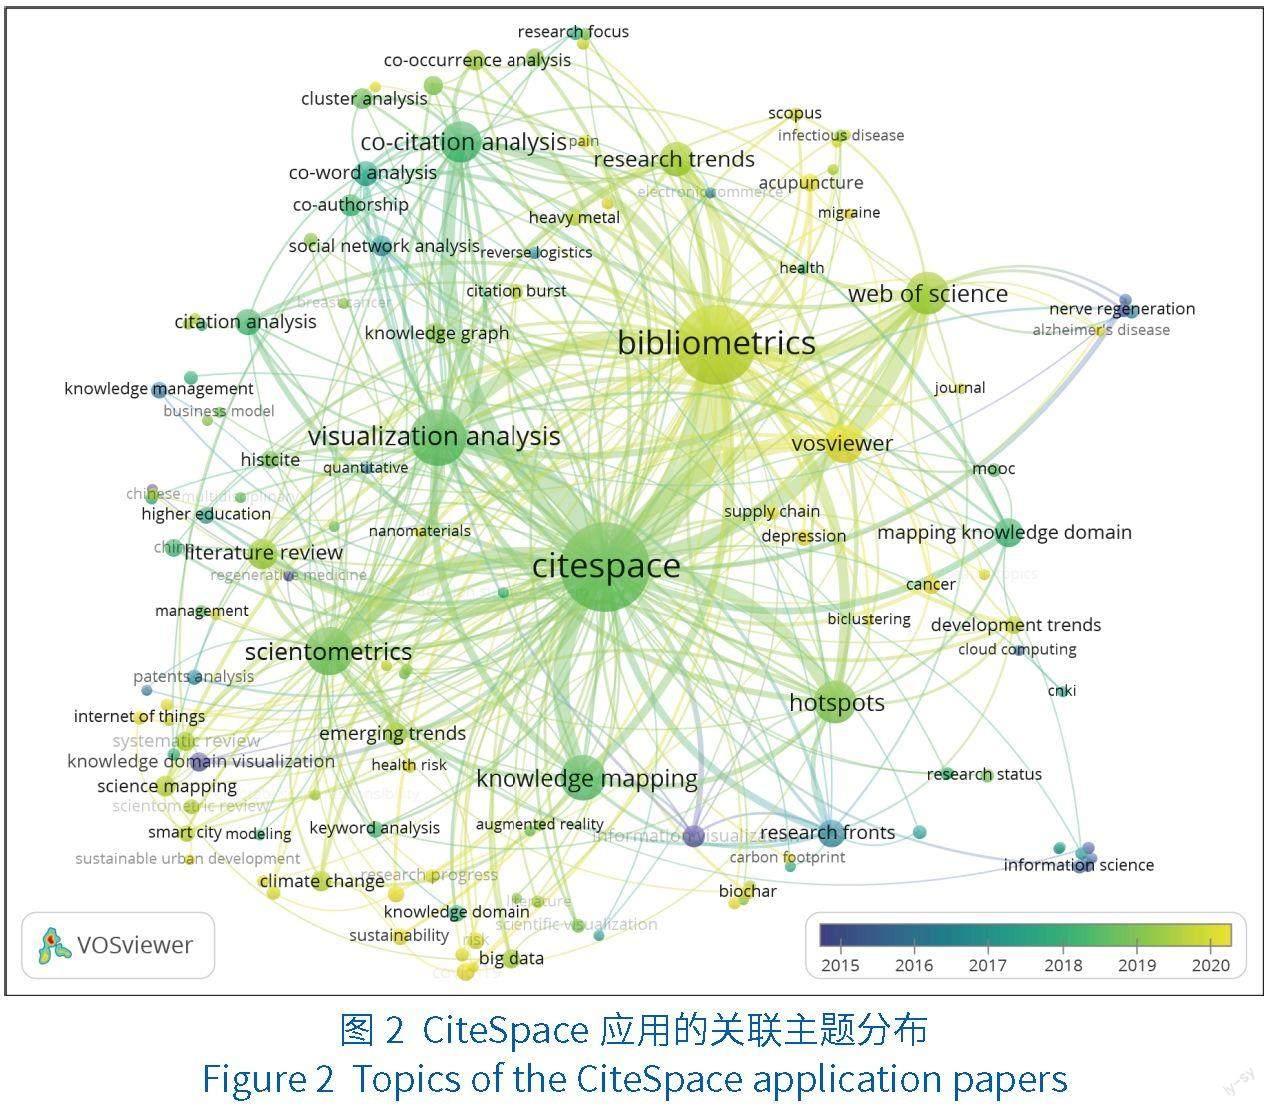
Citespace主题论文的关键词共现网络见图3。图中节点的大小与关键词的词频呈正比。在所有关键词中,Citespace出现了524次,排名第一。在关键词共现网络中,以Citespace形成了核心的主题群,网络外围的主题多是关于Citespace应用论文的关联方法、工具与应用场景。与Citespace共现强度最大的10个关键词分别为:bibliometrics(文献计量学)、visualization analysis(可视化分析)、scientometrics(科学计量学)、knowledge mapping(知识图谱)、VOSviewer、Web Of Science、co-citation analysis(共被引分析)、hotspots(热点)、literature review(文献综述)以及research trends(研究趋势)。高频词反映了CiteSpace在应用中,最常用来进行文献计量、可视化、科学计量与知识图谱等分析,最常用的数据库为Web of Science,CiteSpace的共被引功能最为常用。在研究主题图中,越接近黄色的节点,关键词的平均出现时间距离当前的时间越近。从关键词的分布可以得出,Citespace和VOSViewer的联合应用已经成为一种趋势。在研究的主题上,近期则集中在depression[8-10](抑郁)、cancer[11-13](癌症)、supply chain[14-16](供应链)、acupuncture(针灸)[17-19]、COVID-19[20-22](新冠)、internet of things[23-25](物联网)以及biochar[26-28](生物炭)等方面。
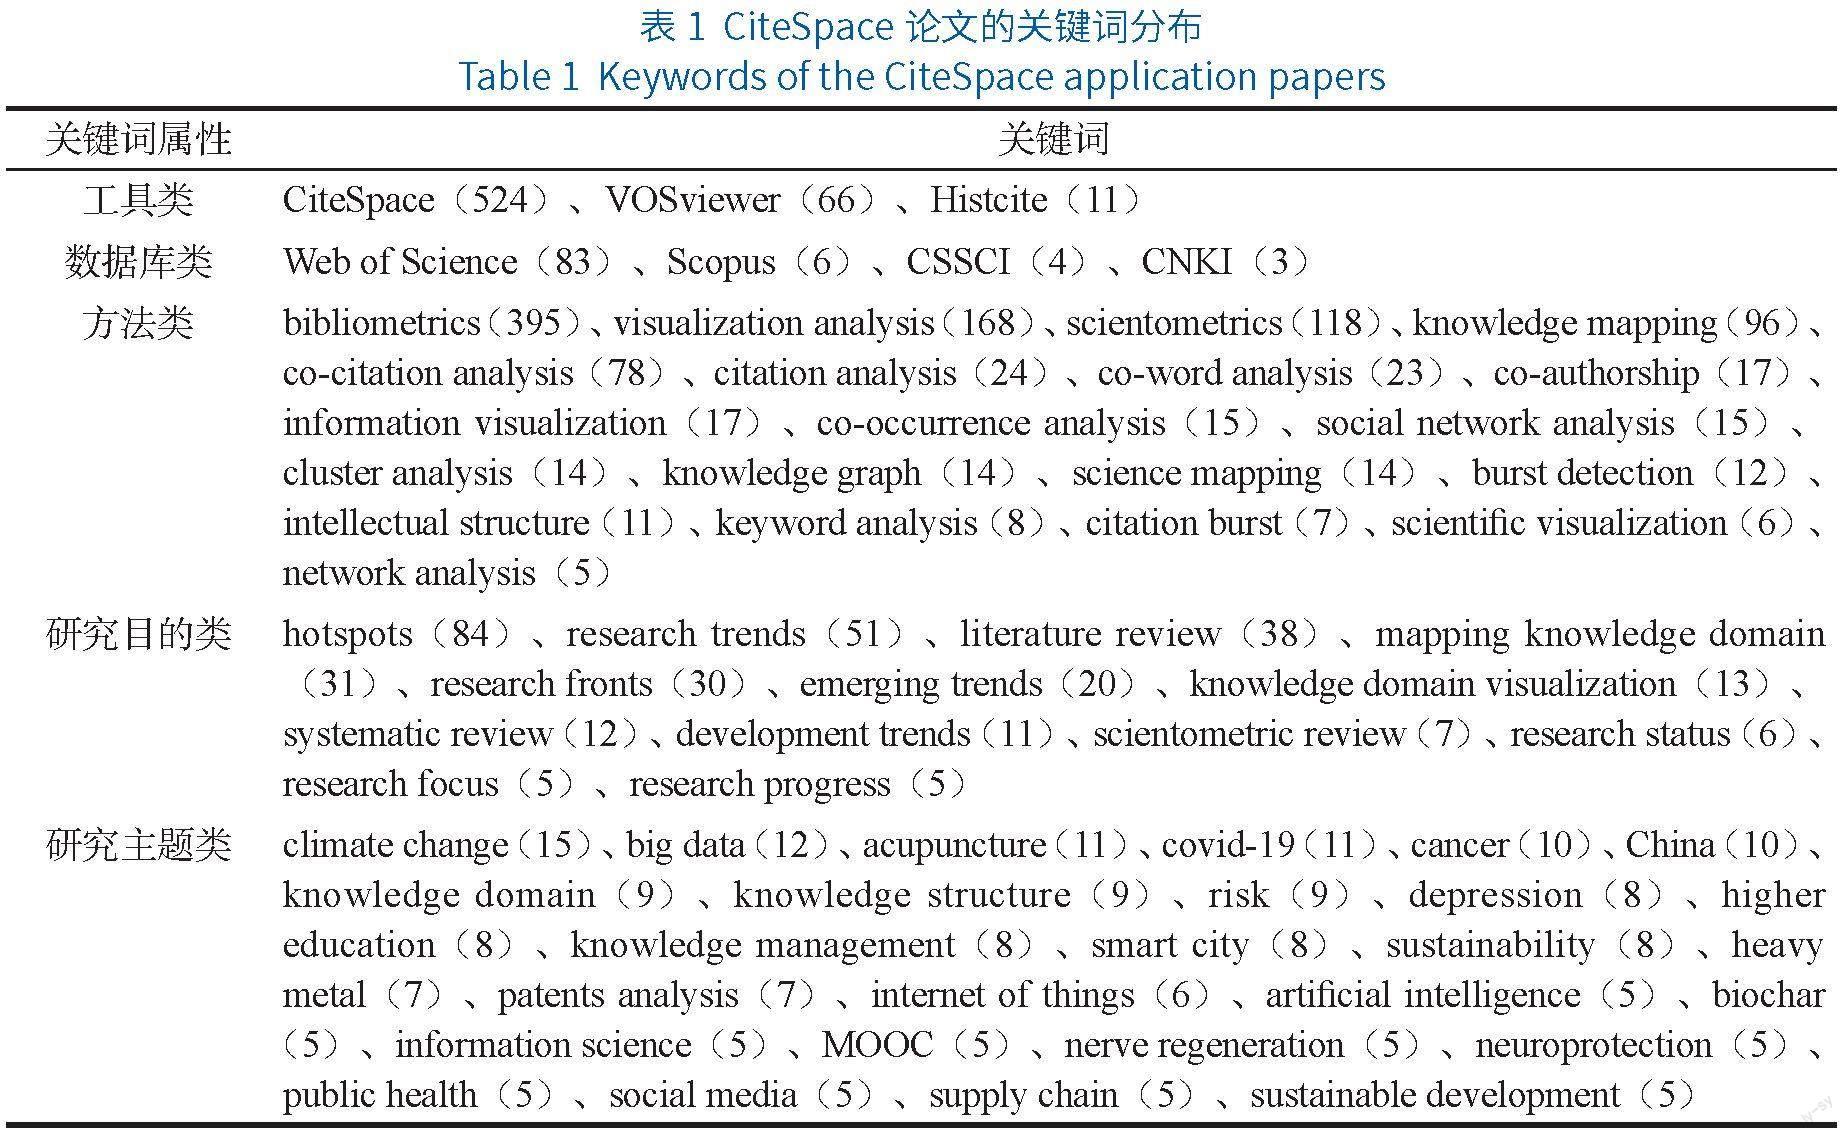
为了进一步认识CiteSpace主题,将关键词分为5个方面:工具类、方法类、数据库类、研究目的类和研究主题类。CiteSpace主题论文最常使用CiteSpace外,还经常使用VOSviewer作为联合数据分析工具之一。此外,还有11篇论文中使用了引文历史软件HistCite;研究中 Web of Science是使用最为频繁的数据库,Scopus、CSSCI以及CNKI使用较少。这是因为CiteSpace输入的标准数据为Web of Science格式,且其他数据库在数据著录等方面存在不同的缺陷,因此Web of Science在CiteSpace的数据分析中最受大家青睐和认可;文献计量、科学计量以及可视化分析等是使用CiteSpace最常见的方法表述,但这些术语在表现主题上相对宽泛。相对比较具体的方法有共被引分析、引文分析、共词分析、合著分析、共现分析、社会网络分析以及聚类分析等;研究的目的多为进行热点分析、研究趋势分析、文献综述、绘制领域知识图谱等。在应用CiteSpace的研究问题上,主要分布在气候变化、大数据、针灸、新冠以及癌症等方面。
4 CiteSpace国际论文的引文分析
提取被引频次不小于20的被引文獻,以分析CiteSpace主题论文的知识基础结构及其CiteSpace功能演化。被965篇施引文献引用超过20次的共有51篇论著,共被引聚类分布见图4。共被引网络中文献的时间跨度为1965—2019年,这表明CiteSpace主题论文不仅包含CiteSpace的原创性知识基础,而且还包含与之相关的重要经典文献。CiteSpace最早开发于2003年,并在2004年以转折点理论为重要技术来探测科学研究中的范式转换。因此本部分以2005年为界,对CiteSpace的“知识基础”论文进行分析。
表2中列出CiteSpace主题论文引用的2005年之前的知识基础论文。从论文的学术贡献来看,大量论文是科学计量学领域的开创性研究,并呈现了文献计量/科学计量重要成果的发展核心路径。这些科学计量学的开创性研究,成为后续CiteSpace开发的理论依据。1965年,普赖斯在Science发表的《科学论文的网络》为后期基于网络思维来剖析科学结构提供了数理依据。普里查德在1969年发表的论文中更是给出了文献计量学的概念,使得后续研究有了基础的立足点。在后续文献计量学发展中,学者们从科学文献知识单元关系入手,又分别提出了文献共被引、作者共被引以及基于文献研究知识基础和研究前沿的理论与方法。从经典的文献计量学文献可以得出,文献的共被引与文献网络分析是其核心知识基础。此外,来自文献计量学领域之外的相关数据挖掘研究论文亦有重要影响。陈超美教授通过结合文献共被引网络和L. C. Freeman的中介中心性概念[29],提出了知名的科学网络中转折点的概念,为知识发现提供了理论和技术支撑。在网络聚类普遍使用模块化值Q来衡量聚类质量的背景下,又引入了剪影值的聚类评估指标,来衡量整体网络的平均同质性和聚类内部被引文献的同质性。在文献的分析中,词频和引证次数是最常使用的指标,但在呈现知识演化上存在严重不足。在基于频次分析的基础上,陈超美引入J. Kleinberg的突发性探测技术[30-31],来分析特定文献单元在时间区间内部激增变化。陈超美教授认为,在突发性研究中,文献发生激增的时间段,在某种程度上可能切中了科学研究的要害,有利于认识科学前沿演化的本质。
在51篇CiteSpace主题论文的高被引文献中,共有14篇是陈超美教授发表的论文(见表3),这些论文在时间序列上较为完整地呈现了CiteSpace从诞生、成长到成熟的过程。2003年5月美国知名科学可视化学者凯蒂·博纳首次发起了“Mapping Knowledge Domians”主题会议,并邀请了包括加菲尔德、陈超美等多位文献计量学专家参加。本次会议的论文集首次于2004年在《美国科学院学报》发表,陈超美的关于“转折点”的论文也是通过本次会议发表的。寻找科学研究中的转折点,以获取创造性的本质成为CiteSpace I的特色功能。在CiteSpace I的基础上,陈超美重新构建CiteSpace的概念模型,形成由共被引网络及术语混合网络构成的科学研究知识基础和研究前沿之间的映射关系,并以典型研究(恐怖主义和生物灭绝)为案例,呈现了CiteSpace实现这一设想的过程。在2008—2009年陈超美发表了基于CiteSpace的数据与知识工程案例研究与基于新设计的SIG指标的科学发展理论的研究。2010年,陈教授进一步对CiteSpace的功能进行完善,涉及基于施引文献标题、摘要或关键词的共被引网络聚类的命名,CiteSpace正式进入3.0时代。在不断的发展和完善中,CiteSpace经过典型案例(如再生医学、罕见病药物等)的成功应用,功能得到不断完善和加强,又先后在3.0版本的基础上补充了文献共被引网络的结构变异分析(structural variation analysis)以及期刊的双图叠加分析(Journals dual overlay map)。在CiteSpace理论与技术不断完善的同时,陈超美教授开始撰写和分享了大量的软件学习指南,在2014年出版免费的英文手册(The CiteSpace Manual),2016年正式出版《CiteSpace:科学文献图谱实践手册》。2017年,陈超美进一步借助CiteSpace软件,系统且深入地对知识图谱的研究进行了全面的梳理和分析,向CiteSpace的用户进一步呈现CiteSpace用于系统性综述和知识发现的可能性。CiteSpace目前已经发展到了5.0,软件在可视化设计、结果稳定性以及功能完整性上都取得了较大的进步。在CiteSpace 5.8.R1以后,软件更是增加了对科技论文中不确定性的分析。整体上来看,在功能上已经实现了从最早基于结构洞的科学发现与创造性理论(creativity),向目前科学不确定性(uncertainty)的研究[43]。从CiteSpace的功能演化过程可以得出,CiteSpace的理论技术与案例研究具有一定的交替性,这使得理论与实践相得益彰,共同发展。
在文献维度的引文分析基础上,利用CiteSpace中的双图叠加图,可以展现这些论文的来源期刊及其引用期刊的引证关系及在全期刊地图上分布。在图4中,左侧是施引文献的来源期刊结点,代表这些CiteSpace相关论文发表在哪些领域的期刊上;右侧是引用文献的来源期刊结点,代表这些CiteSpace相关论文引用的是哪些领域的期刊。无论从施引文献来源还是从引用文献的来源来看,CiteSpace作为科技文献与可视化工具,已经被广泛应用到经济学与政治学、心理学与教育学、动植物学、分子生物学等各个领域,几乎覆盖了全部学科领域,这表明CiteSpace已经基本完成了全学科的扩散。
5 结语
CiteSpace作为由华人学者开发并在国内率先推广应用的一种科学知识图谱绘制工具,相关研究不仅在国内发文量很多,而且近年来在国际上也呈现出爆发趋势。为了展现CiteSpace论文在国际上的应用态势,笔者检索并基于Web of Science数据库中在标题或摘要中包含CiteSpace的近千篇论文,从时间、地域、主题、期刊和引文等角度对这些论文进行了全景式的分析和扫描,主要研究结论如下:①CiteSpace论文在2017年之后增长迅速,从原来的年发文量不足百篇,跃升到近300篇;②中国学者仍然是当前CiteSpace国际论文的主要贡献者,占全部论文总量的84.9%;③关键词分析展现了科学知识图谱方法的相关数据、工具和方法论基础;④引用的论文体现了文献计量学和科学知识图谱的经典方法和工具。
最后,从所采集的论文数据来看,CiteSpace的应用还停留在浅层次,对于软件的深层次应用有所欠缺。一方面,以应用为导向的研究论文,往往缺乏进一步深入挖掘软件深层次功能的动机;另一方面,应用类论文的来源主要为非文献计量学领域,对基于文献计量学理论和可视化技术的认识存在一定的学科屏障,因此仅仅停留在基础的应用上。为了进一步发挥CiteSpace在科学知识领域的挖掘和分析中的价值,作为软件的应用者应该首先熟悉了解文献计量学的基础理论,以此为基础采用CiteSpace灵活探索所关注的领域。
参考文献:
[1] 李杰, 陈超美. CiteSpace科技文本挖掘及可视化 [M]. 3版. 北京: 首都经济贸易大学出版社, 2022. (LI J, CHEN C M. CiteSpace: text ming and visualization in scientific literature [M]. 3rd ed. Beijing: Capital University of Economic and Business Press, 2022.)
[2] 侯剑华, 陈悦. 战略管理学前沿演进可视化研究 [J]. 科学学研究, 2007 (S1): 15-21. (HOU J H, CHEN Y. Research on visualization of the evolution of strategic management front [J]. Studies in science of science, 2007(S1): 15-21.)
[3] 陈悦, 刘则渊. 悄然兴起的科学知识图谱 [J]. 科学学研究, 2005 (2): 149-154. (CHEN Y, LIU Z Y. The rise of mapping knowledge domain[J]. Studies in science of science, 2005 (2): 149-154.)
[4] 侯劍华, 胡志刚. CiteSpace软件应用研究的回顾与展望 [J]. 现代情报, 2013, 33(4): 99-103.(HOU J H, HU Z G. Review on the application of CiteSpace at home and abroad [J]. Journal of modern information, 2013, 33(4): 99-103.)
[5] 陈悦, 陈超美, 刘则渊, 等. CiteSpace知识图谱的方法论功能 [J]. 科学学研究, 2015, 33(2): 242-253. (CHEN Y, CHEN C M, LIU Z Y, et al. The methodology function of CiteSpace mapping knowledge domains [J]. Studies in science of science, 2015, 33(2): 242-253.)
[6] 刘光阳. CiteSpace国内应用的传播轨迹——基于2006—2015年跨库数据的统计与可视化分析 [J]. 图书情报知识, 2017(2): 60-74. (LIU G Y. The spread track of CiteSpace application in China——based on the statistical and visual analysis of cross-database data from 2006 to 2015 [J]. Documentation, information & knowledge, 2017(2): 60-74.)
[7] 李杰, 李慧杰, 陈伟炯, 等. 国内社会科学研究中知识图谱应用现状分析[J].图书情报研究, 2019(1): 74-81.( LI J, LI H J, CHEN W J, et al. Review application of knowledge visualization research in Chinese social science[J]. Library & information studies, 2019(1): 74-81.)
[8] ZOU X H, SUN Y. Bibliometrics analysis of the research status and trends of the association between depression and insulin from 2010 to 2020 [J/OL]. Front psychiatry, 2021, 12: 683474[2023-04-11]. https://www.frontiersin.org/articles/10.3389/fpsyt.2021.683474/full.
[9] ZHU X Q, HU J Q, DENG S H, et al. Bibliometric and visual analysis of research on the links between the gut microbiota and depression from 1999 to 2019 [J/OL]. Front psychiatry, 2021, 11: 587670 [2023-04-11]. https://www.frontiersin.org/articles/10.3389/fpsyt.2020.587670/full.
[10] ZHOU Y, ZHU X P, SHI J J, et al. Coronary heart disease and depression or anxiety: a bibliometric analysis [J]. Front psychol, 2021, 12:669000[2023-04-11]. https://www.frontiersin.org/articles/10.3389/fpsyg.2021.669000/full.
[11] ZHENG Y S, HUANG Y W, BIAN Y Y, et al. Analysis of the differences in lung cancer research trends between China and the United States based using project funding data [J]. Annals of translational medicine, 2021, 9(3): 215.
[12] XU Z Y, GAO X, REN B H, et al. A bibliometric analysis of segmentectomy versus lobectomy for non-small cell lung cancer research (1992-2019) [J]. Medicine (Baltimore), 2021, 100(13): e25055.
[13] WU C C, WANG Y Z, HU H Y, et al. Bibliometric analysis of research on the comorbidity of cancer and pain [J]. Joural of pain research, 2021, 14: 213-228.
[14] ZHOU X Y, LI T C, MA X Q. A bibliometric analysis of comparative research on the evolution of international and Chinese green supply chain research hotspots and frontiers [J]. Environmental science and pollution research, 2021, 28(6): 6302-6323.
[15] SU Z W, ZHANG M Y, WU W B. Visualizing sustainable supply chain management: a systematic scientometric review [J/OL]. Sustainability, 2021, 13(8): 4409[2023-04-11]. https://doi.org/10.3390/su13084409.
[16] GUAN G F, JIANG Z J, GONG Y, et al. A bibliometric review of two decades research on closed-loop supply chain: 2001-2020 [J/OL]. IEEE access, 2021, 9: 3679-3695[2023-04-11]. https://ieeexplore.ieee.org/document/9308918.
[17] ZHAO Y Q, HUANG L, LIU M J, et al. Scientific knowledge graph of acupuncture for migraine: a bibliometric analysis from 2000 to 2019 [J]. Joural of pain research, 2021, 14: 1985-2000.
[18] ZHAO T T, GUO J, SONG Y F, et al. A bibliometric analysis of research trends of acupuncture therapy in the treatment of migraine from 2000 to 2020 [J]. Joural of pain research, 2021, 14: 1399-1414.
[19] ZHANG J H, ZHANG Y X, HU L Y, et al. Global trends and performances of magnetic resonance imaging studies on acupuncture: a bibliometric analysis [J]. Front neurosci, 2021, 14: 620555 [2023-04-11]. https://www.frontiersin.org/articles/10.3389/fnins.2020.620555/full.
[20] WANG Y N, AHMED A, AZAM A, et al. Applications of additive manufacturing (AM) in sustainable energy generation and battle against COVID-19 pandemic: the knowledge evolution of 3D printing [J/OL]. Journal of manufacturing systems, 2021, 60: 709-733[2023-04-11]. https://doi.org/10.1016/j.jmsy.2021.07.023.
[21] SANCHEZ-TENA M A, MARTINEZ-PEREZ C, VILLA-COLLAR C, et al. Impact of COVID-19 at the ocular level: a citation network study [J]. Journal of clinical medicine, 2021, 10(7): 1340.
[22] LI D, WANG S W, SU X M. Bibliometric analysis on utilization of new information technology in the prevention and control of Covid-19-China, 2020 [J]. China CDC weekly, 2021, 3(8): 165-169.
[23] YANG X J, WANG X Y, LI X G, et al. Exploring emerging IoT technologies in smart health research: a knowledge graph analysis [J]. BMC medical informatics and decision making, 2020, 20(1): 260.
[24] HU X P, SUN L J, ZHOU Y X, et al. Review of operational management in intelligent agriculture based on the Internet of Things [J]. Frontiers of engineering management, 2020, 7(3): 309-322.
[25] DAIM T, LAI K K, YALCIN H, et al. Forecasting technological positioning through technology knowledge redundancy: patent citation analysis of IoT, cybersecurity, and Blockchain [J/OL]. Technological forecasting & social change, 2020, 161: 120329[2023-04-11]. https://doi.org/10.1016/j.techfore.2020.120329.
[26] BILIAS F, NIKOLI T, KALDERIS D, et al. Towards a soil remediation strategy using biochar: effects on soil chemical properties and bioavailability of potentially toxic elements [J/OL]. Toxics, 2021, 9(8): 184[2023-04-11]. https://doi.org/10.3390/toxics9080184.
[27] YAN T T, XUE J H, ZHOU Z D, et al. The trends in research on the effects of biochar on soil [J]. Sustainability, 2020, 12(18): 23.
[28] WU P, WANG Z Y, WANG H L, et al. Visualizing the emerging trends of biochar research and applications in 2019: a scientometric analysis and review [J]. Biochar, 2020, 2(2): 135-150.
[29] FREEMAN L C. A set of measures of centrality based on betweenness [J]. Sociometry, 1977, 40(1): 35-41.
[30] KLEINBERG J. Bursty and hierarchical structure in streams [C]// Proceedings of the eighth ACM SIGKDD international conference on knowledge discovery and data mining. Edmonton: Association for Computing Machinery, 2002: 91–101.
[31] KLEINBERG J. Bursty and hierarchical structure in streams [J]. Data mining and knowledge discovery, 2003, 7(4): 373-397.
[32] PRICE D J D S. Networks of scientific papers [J]. Science, 1965, 149(3683): 510-515.
[33] PRITCHARD A. Statistical bibliography or bibliometrics [J]. Journal of documentation, 1969, 25(4): 348-349.
[34] SMALL H. Co-citation in the scientific literature: a new measure of the relationship between two documents [J]. Journal of the American Society for Information Science, 1973, 24(4): 265-269.
[35] FREEMAN L C. Centrality in social networks conceptual clarification [J]. Social networks, 1978, 1(3): 215-239.
[36] WHITE H D, GRIFFITH B C. Author cocitation: a literature measure of intellectual structure [J]. Journal of the American Society for Information Science, 1981, 32(3): 163-171.
[37] ROUSSEEUW P J. Silhouettes: a graphical aid to the interpretation and validation of cluster analysis [J/OL]. Journal of computational and applied mathematics, 1987, 20: 53-65[2023-04-11]. https://www.sciencedirect.com/science/article/pii/0377042787901257.
[38] PERSSON O. The intellectual base and research fronts of JASIS 1986–1990 [J]. Journal of the American Society for Information Science, 1994, 45(1): 31-38.
[39] WHITE H D, MCCAIN K W. Visualizing a discipline: An author co-citation analysis of information science, 1972–1995 [J]. Journal of the American Society for Information Science, 1998, 49(4): 327-355.
[40] HOOD W W, WILSON C S. The literature of bibliometrics, scientometrics, and informetrics [J]. Scientometrics, 2001, 52(2): 291-314.
[41] B?RNER K, CHEN C, BOYACK K W. Visualizing knowledge domains [J]. Annual review of information science and technology, 2003, 37(1): 179-255.
[42] CHEN C M. Searching for intellectual turning points: progressive knowledge domain visualization [J]. Proceedings of the National Academy of Sciences of the United States of America, 2004, 101(Sl): 5303-5310.
[43] CHEN C. A glimpse of the first eight months of the covid-19 literature on microsoft academic graph: themes, citation contexts, and uncertainties [J/OL]. Frontiers in research metrics and analytics, 2020, 5:607286[2023-04-11].https://www.frontiersin.org/articles/10.3389/frma.2020.607286/full.
[44] CHEN C M. CiteSpace II: Detecting and visualizing emerging trends and transient patterns in scientific literature [J]. Journal of the American Society for Information Science and Technology, 2006, 57(3): 359-377.
[45] CHEN C M, SONG I Y, YUAN X J, et al. The thematic and citation landscape of data and knowledge engineering (1985-2007) [J]. Data & knowledge engineering, 2008, 67(2): 234-259.
[46] CHEN C, CHEN Y, HOROWITZ M, et al. Towards an explanatory and computational theory of scientific discovery [J]. Journal of informetrics, 2009, 3(3): 191-209.
[47] CHEN C, IBEKWE-SANJUAN F, HOU J. The structure and dynamics of cocitation clusters: a multiple-perspective cocitation analysis [J]. Journal of the American Society for Information Science and Technology, 2010, 61(7): 1386-1409.
[48] CHEN C M, HU Z G, LIU S B, et al. Emerging trends in regenerative medicine: a scientometric analysis in CiteSpace [J]. Expert opinion on biological therapy, 2012, 12(5): 593-608.
[49] CHEN C. Predictive effects of structural variation on citation counts [J]. Journal of the American Society for Information Science and Technology, 2012, 63(3): 431-449.
[50] CHEN C, DUBIN R, KIM M C. Emerging trends and new developments in regenerative medicine: A scientometric update (2000-2014) [J]. Expert opinion on biological therapy, 2014, 14(9): 1295-1317.
[51] CHEN C, DUBIN R, KIM M C. Orphan drugs and rare diseases: a scientometric review (2000-2014) [J]. Expert opinion on biological therapy, 2014, 2(7): 709-724.
[52] CHEN C, LEYDESDORFF L. Patterns of connections and movements in dual-map overlays: a new method of publication portfolio analysis [J]. Journal of the American Society for Information Science and Technology, 2014, 65(2): 334-351.
[53] CHAOMEI C. The CiteSpace manual [EB/OL]. [2022-10-11]. http://blog.sciencenet.cn/blog-496649-840691.html.
[54] CHEN C. CiteSpace: a practical guide for mapping scientific literature [M]. New York :Nova Science Publishers, Incorporated, 2016.
[55] CHEN C M. Science mapping: a systematic review of the literature [J]. Journal of data and information science, 2017, 2(2): 1-40.
[56] CHEN C, SONG M. Visualizing a field of research: a methodology of systematic scientometric reviews [J/OL]. Plos one, 2019, 14(10): e0223994[2023-04-11]. https://doi.org/10.1371/journal.pone.0223994.
Global Application and Core Function Evolution of CiteSpace
Li Jie1,2 Hu Zhigang3 Hou Jianhua4
1National Science Library, Chinese Academy of Sciences, Beijing 100190
2Department of Information Resources Management, School of Economics and Management, University of Chinese Academy of Sciences, Beijing 100190
3WISE Lab, Dalian University of Technology, Dalian 116024
4School of Information Management, Sun Yat-sen University, Guangzhou 510006
Abstract: [Purpose/Significance] This study aims to comprehend the current global status of CiteSpace application and functional evolution based on knowledge foundations. Additionally, it seeks to facilitate the understanding and implementation of CiteSpace within the Chinese scientific community. [Method/Process] Knowledge mapping methods were employed to analyze 965 papers related to CiteSpace from the Web of Science Core Collections. The analysis covered growth trends, geographical distribution, research topics, and citation evolution. [Result/Conclusion] The findings reveal a consistent upward trend in CiteSpaces application over the past 16 years. The application demonstrates a diverse distribution across 54 different countries/regions and 337 cities. Notably, China emerges as the most productive country, accounting for 84.9%. In CiteSpace applications, VOSviewer and Histcite are often used together, and Web of Science is the main data source. Widely adopted bibliometric methods include co-citation analysis, citation analysis, co-word analysis, and co-authorship. The applications purposes encompass hotspot analysis, tracking research trends, and conducting literature reviews. The diachronic citation network analysis elucidates the complete evolution of CiteSpace I, CiteSpace II, and CiteSpace III. Furthermore, dual overlay maps of journals effectively demonstrate the interaction between CiteSpace application papers and knowledge-based papers.
Keyword: CiteSpace scientific outputs science map co-words analysis citation analysis
