Flow Characteristics Analysis of TC18 Titanium Alloy during Hot Deformation Based on Phase Transformation
2024-01-03SUNTaoTENGHaihaoJIANGXiaojuanTENGShumanZHOUJie
SUN Tao, TENG Haihao, JIANG Xiaojuan, TENG Shuman, ZHOU Jie*
(1. College of Materials Science and Engineering, Chongqing University, Chongqing 400044, China; 2. Key Laboratory of Advanced Die Intelligent Manufacturing of Chongqing, Chongqing 400044, China; 3. School of Mechanical Engineering and Automation, Chongqing Industry Polytechnic College, Chongqing 401120, China; 4. Liuzhou Steel Group, Liuzhou 545002, China)
Abstract: An accurate flow stress model was established by considering the parameters of strain rate, strain and temperature as well as β →α+β phase transformation in order to develop the plastic forming theory of TC18 titanium alloy.Firstly, the phase transition kinetics of TC18 titanium alloy during isothermal and continuous cooling at 1 073 and 1 273 K was studied by thermodynamic calculation, meanwhile, the relationship of volume fraction of phase transition with temperature and time was obtained.Constitutive models were calculated by investigating flow behaviors under hot compression tests with the strain rates of 0.001-1 s-1 and temperatures of 973-1 223 K in the single β and α+β regions in TC18 titanium alloy, respectively.By combining the phase transformation dynamic kinetics with constitutive models, an accurate flow stress model was established, providing theoretical basis and data support for the hot forging of TC18 titanium alloy.
Key words: constitutive modeling; TC18 titanium alloy; phase transformation; flow stress
1 Introduction
TC18 alloy, a kind of α+β type structure titanium alloy, was developed by the former Soviet Union.As the important metal structure materials,titanium alloys are widely used in aviation, aerospace and automotive industries owing to their favorable material properties such as low density, high specific strength, and high hardenability[1-3].However, TC18 alloy is remarkably sensitive to hot deformation process parameters, resulting in difficultly accurate controlling of the microstructure evolution during hot manufacturing process.In order to improve the quality of components manufactured by TC18 alloy,it is necessary for material designers to optimize the deformation parameters and accurately characterize the hot deformation behaviors[4,5].
The constitutive models of materials, mainly including phenomenological[6-10], physical-based[11-13]and artificial neural network (ANN) models[14], describe the function between the flow stress and deformation parameters, such as deformation temperature (T)and strain rate ( ) during hot deformation process.It is also the basis of optimizing the hot deformation procedures and accurately controlling the materials microstructure[15].Recently, some researchers attempted to calculate the constitutive models of TC18 alloy.Jia[10]and Lei[16]considered the effect of strain and established an improved constitutive equation by adopting the Arrhenius-type hyperbolic-sine function,which can accurately predict the flow stress at high temperatures.Lin[17]constructed three constitutive models to depict the flow behaviors of the studied alloy, including the strain-compensated Arrhenius-type,Hensel-Spittle (HS) and artificial neural network (ANN)models, and the results showed the prediction accuracy of ANN model is the best among the three constitutive models.Wang[18]used BP (Back Propagation) neural network to analyze the influence of thermal processing parameters of TC18 on its microstructure.Huang[19]established the constitutive model of TC18 titanium alloy under large deformation based on dislocation density evolution, and the average error of the model was less than 10%.Qu[20]researched dynamic recovery and recrystallization of TC18 titanium alloy and adopted Arrhenius hyperbolic sine function to describe the constitutive equation of the studied alloy.However,previous studies on the flow stress of TC18 titanium alloy mostly ignored β α+β phase transition and only considered the effects of temperature and strain rate,while phase transition is also one of the key factors affecting the flow stress curves.
In the current study, the mechanical behavior of TC18 alloy was studied by conducting isothermal compression tests.Based on the dynamic kinetics of TC18 titanium alloy phase transformation, the flow stress equation of TC18 titanium alloy with phase transformation was obtained by optimizing the flow stress model in single β region at high temperatures and α+β region at low temperatures.By combining the dynamic kinetics of phase transformation with flow stress model, a constitutive model considering phase transition was established, providing theoretical basis and data support for the hot deformation of TC18 titanium alloy.
2 Experimental
TC18 alloy used in the test was provided by Shanxi Baoti Titanium Industry Co., Ltd.The nominal component is Ti-5Al-5Mo-5V-1Cr-1Fe.The chemical compositions are shown in Table 1.
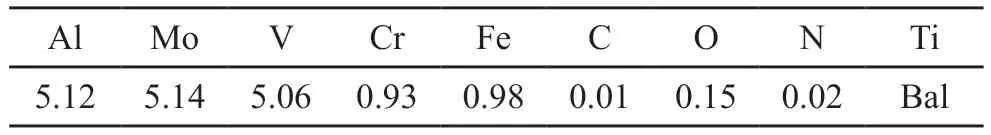
Table 1 Chemical compositions of TC18 alloy/wt%
The transus temperature of α/β phase is 1 143 K,which was calculated by Thermo-calc and Jmatpro thermodynamic software.The hot compression specimens with the diameter of 8 mm and height of 12 mm were machined from a cast billet.Before hot deformation, the specimens were warmed to the deformation temperatures at 10 K/s, and kept for 3 min with Gleeble 3800 to guarantee the uniform temperature distribution.To reduce the influence of friction on the experimental data and improve accuracy, the two sides of the samples were polished, and the graphite sheets were pasted on the contact part between the samples and compressor.Then the specimens were compressed at different strain rates ranging from 0.001 to 1 s-1and different temperatures from 973 to 1 223 K.The total reduction was 50%, and in the compressed process the stress-strain data were recorded automatically during testing.After the hot deformation, the specimens were quenched by water to room temperature.The specific experimental process is illustrated in Fig.1.
To studied the phase transformation during continuous cooling process, the thermal properties were investigated by a differential scanning calorimetry(DSC, TA Q2000).The dimension of the specimen isΦ3 mm×1 mm.The temperature was changed from 298 to 1 273 K at a rate of 10 K/s under nitrogen atmosphere, and kept at 1 273 K for 10 min.Then the specimens were cooled at a cooling rate of 0.5 K/s.
3 Phase transition dynamics of TC18
3.1 Phase transformation analysis during isothermal process
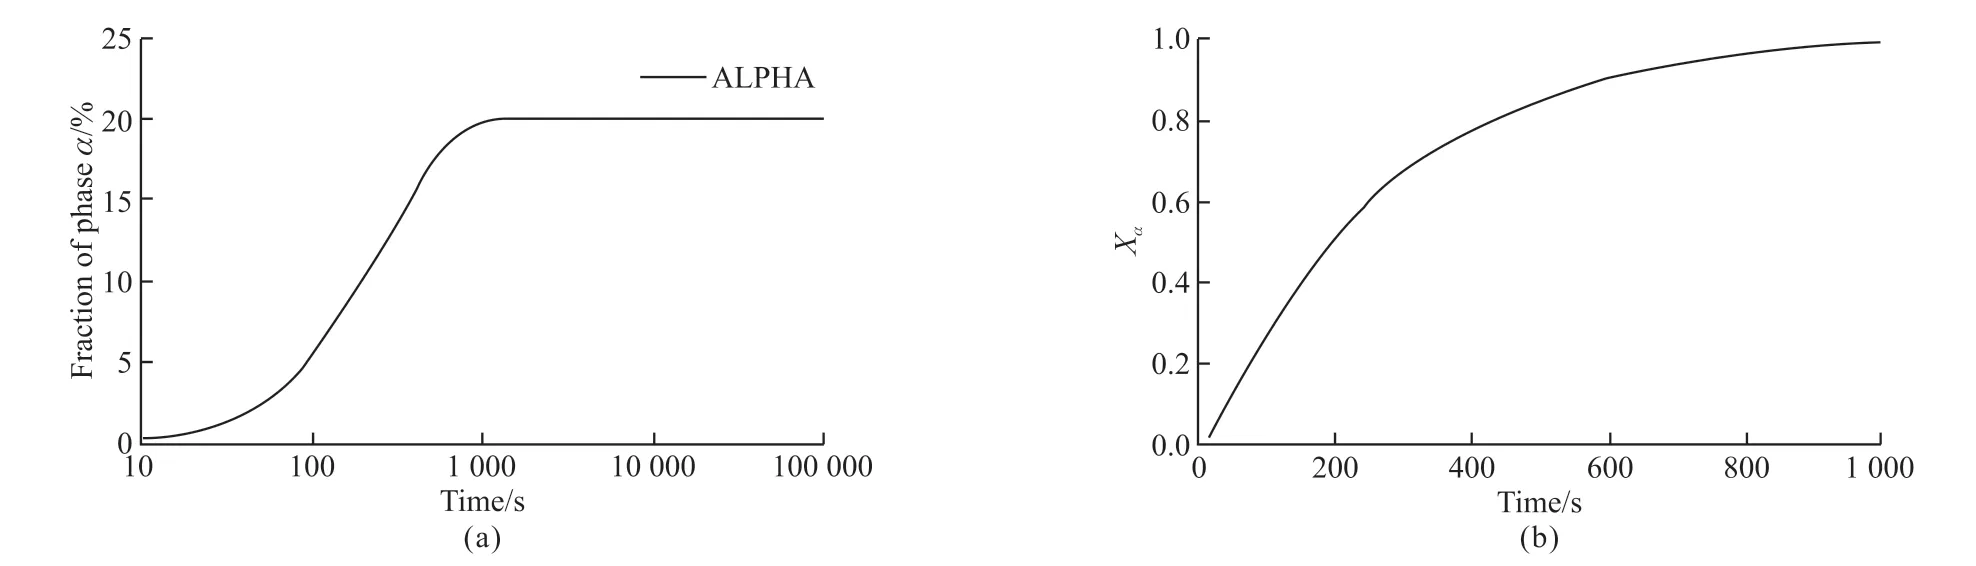
Fig.2 (a) The relationship between fraction of phase α and time; (b) Volume fraction-time curve of TC18 titanium alloy during isothermal phase transition
The phase transition of titanium alloy belongs to solid phase transition, and the Avrami equation[21]can be used to study the isothermal phase transition dynamics, expressed as
where,Xεis the fraction of the phase transition of ε microstructure after time τ;ka temperature-dependent constant reflecting the phase transition rate, andma constant describing the nucleation and growth mechanism of TC18 titanium alloy.
The thermodynamic-calculate software Jmatpro was used to simulate the process of quenching TC18 alloy at 1 273 K and isotherm at 1 073 K, and the relationship between the fraction of phase α and time was obtained, as shown in Fig.2(a).The relationship between the volume fraction of the phase transition of TC18 titanium alloy β→α+β and the time τ is shown in Fig.2(b).
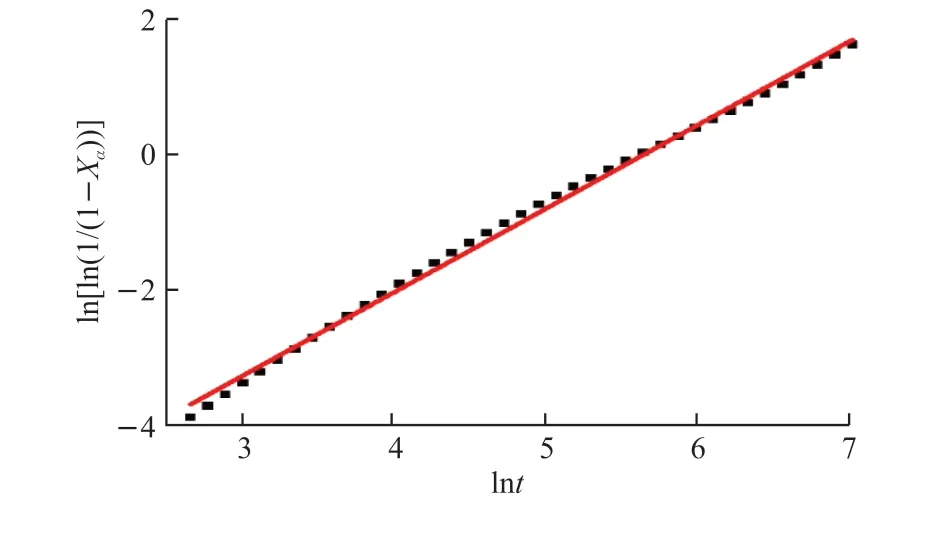
Fig.3 Linear regression on relation between lnτ and
The following Eq.(2) can be derived from Eq.(1),expressed as:
with substituting the data in Fig.2(b) into Eq.(2), relation
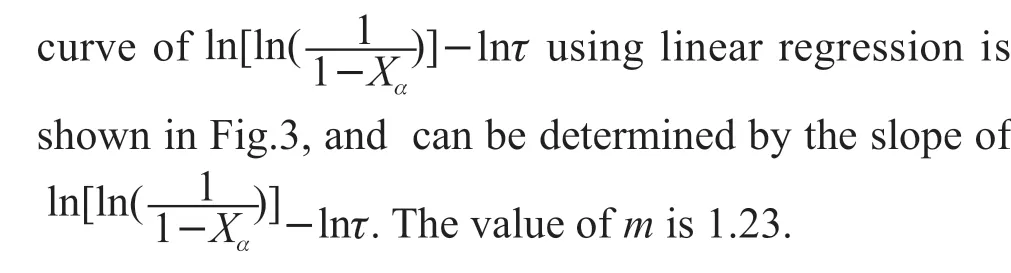
Malinov[22]studied the kinetics of β→α+β transformation of Ti-6Al-4V and Ti-6Al-2Sn-4Zr-2Mo-0.08Si alloys at isothermal conditions by resistivity technique, and they found that the value ofmvaries from 1.15 to 1.60 at different temperatures within a narrow range.This may due to the mechanism of β→α+β transformation in titanium alloys, namely that β-grain boundaries are the nucleation sites and the phase α has a plate-like morphology.
3.2 Phase transformation analysis during
continuous cooling process
The phase transition of TC18 titanium alloy during continuous cooling was researched by thermodynamic calculation software and DSC experiment.During the simulation, the titanium alloy was heated to 1 273 K and cooled at 1 and 0.5 K/s, respectively.The curves of volume fraction of phase transition with temperature and time were fitted by thermal simulation results, as shown in Figs.4(a) and 4(b).The changing of heat flow during continuous cooling process studied by DSC are exhibited in Fig.5.Clearly, the phase transformation did take place in cooling process.The relationship between volume fraction of phase transformation and the heat flow can be expressed as,
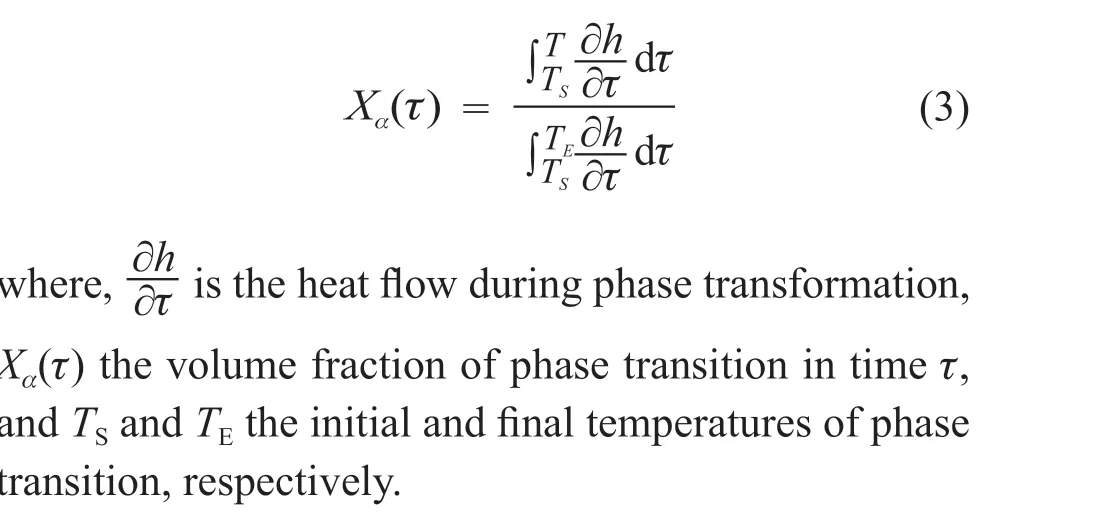
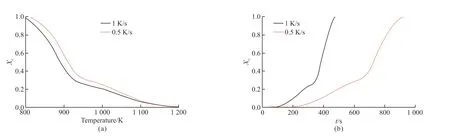
Fig.4 (a) Relation curves between volume fraction of phase transition and temperature; (b) Relation curves between volume fraction of phase transition and cooling time
To verify the agreement between thermodynamic simulation and experimental results, the three points were chosen in this study.When the temperatures are 825, 850, and 875 K, the volume fractions of phase transition are 97%, 90%, and 83% seen in Fig.4(a).And using the DSC experiment results shown in Fig.5, the volume fractions are 98%, 88%, and 76%.The accuracy of thermodynamic calculation is well coincidence with the experimental data.
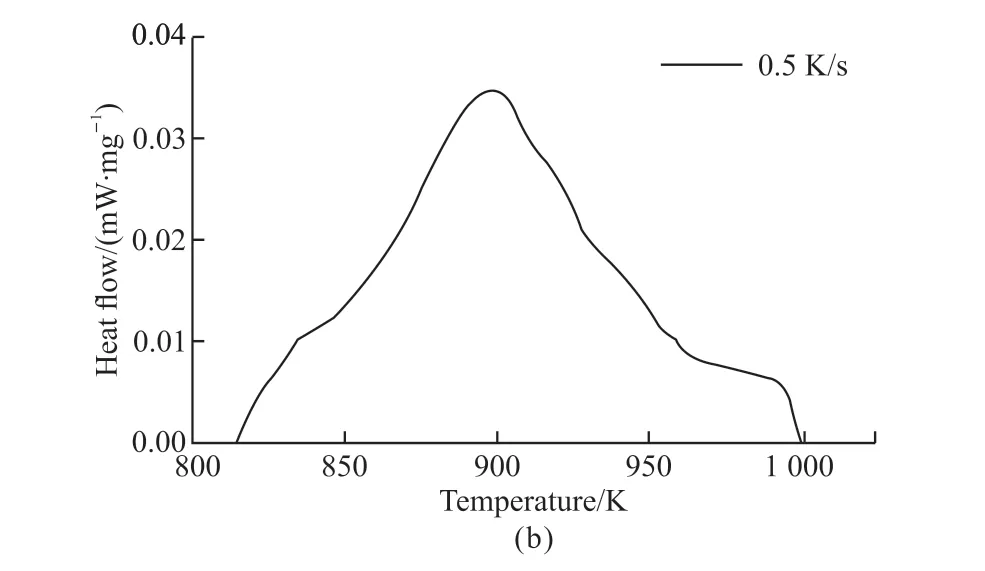
Fig.5 The heat flow curve of DSC experiment in cooling rate of 0.5 K/s
According to the superposition principle, in order to calculate the continuous cooling phase transformation process of TC18 titanium alloy, it can be equivalent to several isothermal phase transformation processes with time intervals , as shown in Fig.6.
At each Δτ time, Eq.(1) is used to calculate the phase transition volume fraction of titanium alloy.For example, from point 0 to point 1, the volume fraction of phase transition can be expressed as,
where,f1is the volume fraction of the phase transition from point 0 to 1, andk1(T1) the value ofkat temperatureT1.
The volume fraction of phase transition from point 0 to point 2 is calculated by Eq.(5), expressed as:
where, τ2is the time to reach the volume fraction of phase transition at temperatureT1whenT2is isothermal maintained, and τ2can be expressed in the following equation:
The volume fraction of phase transition from point 0 to pointican be calculated by the following formula:
According to the phase transformation dynamics,combining Eqs.(7) and (8), the value of the phase fraction variation at different times can be calculated when it is cooled at a cooling rate of 1 K/s.
According to the above calculation and fitting, we can get the relation curve betweenkand temperatureT, as shown in Fig.7(a).It shows that with the decrease of temperature, the value ofkincreases continuously,and at the initial stage of temperature decrease, it increases slowly.When the temperature is below 900 K, the value ofkincreases rapidly with the decrease of temperature.
Based on the Ref.[22], the relationship between the value ofkand temperature can be expressed, shown in Eq.(9):
where,k0is the index factor;Qthe activation energy;Rthe molar gas constant.
In combination with Eq.(9), nonlinear regression is performed on the data in Fig.7(a), and the expression ofk(T) can be derived, as shown in Eq.(10).A good fit between the theoretical and fitting curves is observed in Fig.7(b):
Fig.6 Schematic diagram of continuous cooling phase transformation equivalent to constant temperature phase transformation
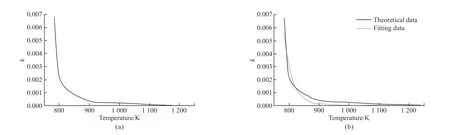
Fig.7 (a) Relation curve between k and temperature; (b) Comparison of theoretical calculation data with the fitting data
Based on all the above work, the kinetics equation of TC18 titanium alloy in isothermal phase transformation can be expressed as:
4 Constitutive modeling of TC18 alloy based on phase transition
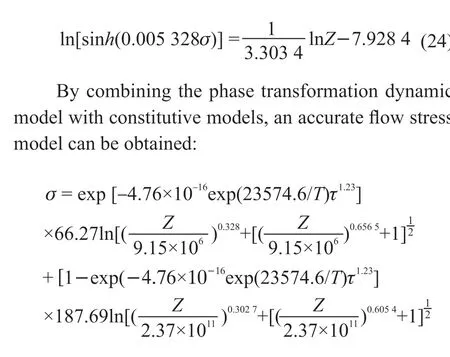
Based on the dynamic kinetics of TC18 titanium alloy phase transformation, the flow stress model of TC18 titanium alloy with phase transformation was obtained by optimizing the flow stress model in single β region at high temperatures and α+β region at low temperatures.According to the transformation kinetics model of TC18 titanium alloy, β→α+β transformation occurs when the temperature is lower than 1 143 K during the continuous cooling process.The flow stress considering phase transformation can be expressed as Eq.(12):
where,Xαis the volume fraction of phase α; σβthe flow stress in single β region at high temperatures, and σα+βthe flow stress in α+β region at low temperatures.Therefore, it is necessary to establish the flow stress equations in single β region and α+β region.
4.1 Constitutive model of single region at high temperatures
The specimens were compressed at the strain rates varying from 0.001 to 1 s-1and deformation temperatures was 1 153, 1 173, and 1 223 K.The flow stress curves are shown in Fig.8.As shown in Fig.8,it is obvious that the flow stress decreases with the increase of temperature at a constant strain rate, and the flow stress increases with the increase of strain rate at a constant temperature.This is because with the increase of temperature, the thermal activation energy increases,and the kinetic energy of atoms also increases.These weaken the binding force between atoms and promote the dynamic recovery and recrystallization of titanium alloy, having an effect on softening the deformation of TC18 alloy[23].

Fig.8 True stress-strain curves of TC18 alloy under different deformation temperatures: (a) 1 153 K; (b) 1 173 K; (c) 1 223 K
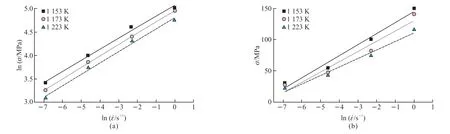
Fig.9 (a) Relationship of In σ-ln ; (b) Relationship of σ-ln of TC18 titanium alloy
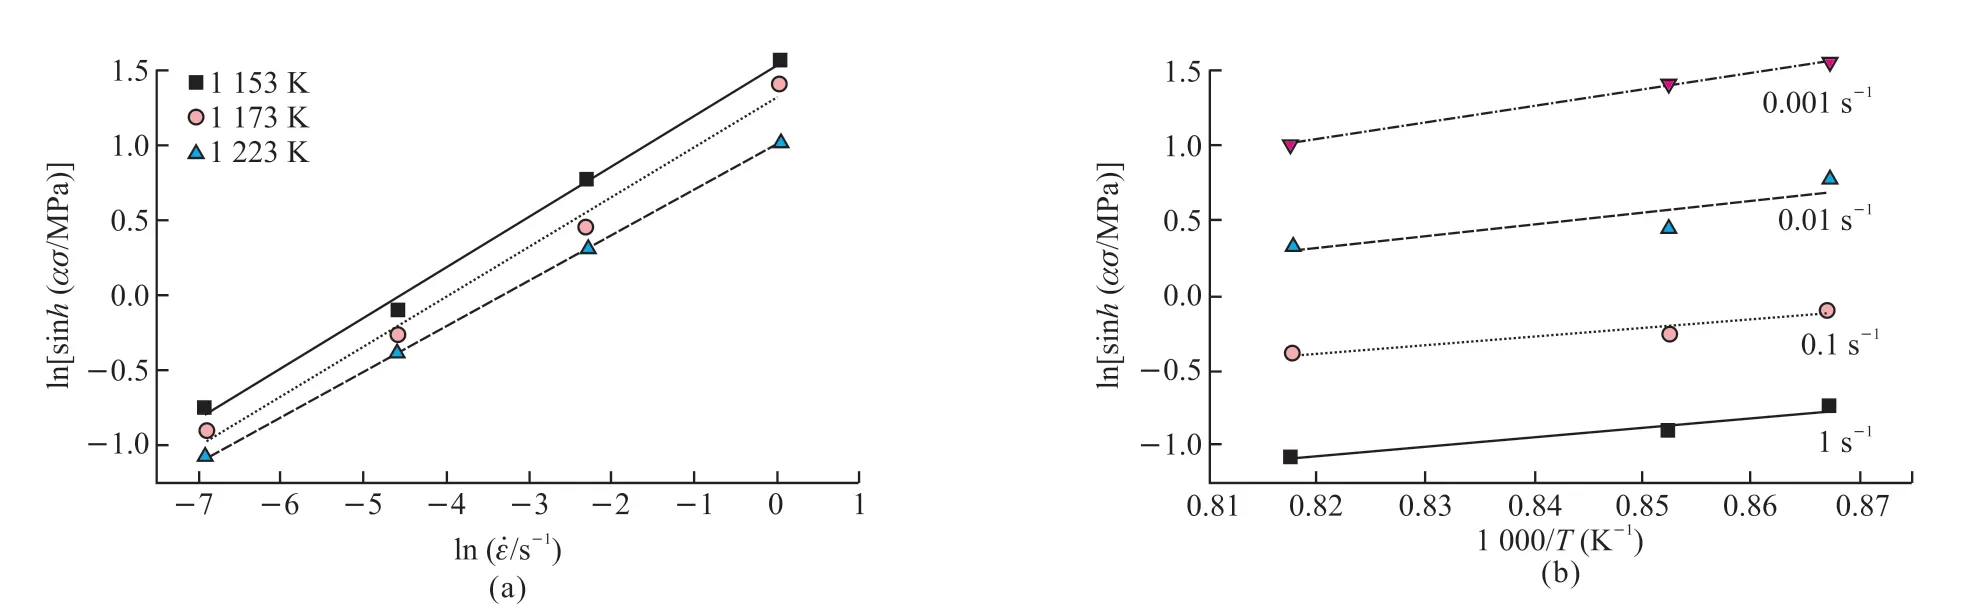
Fig.10 (a) Relationship of In[sinh(ασ)]-ln ; (b) Relationship of In[sinh(ασ)]-1 000×T-1 of TC18 titanium alloy
At the initial stage of deformation, the stress increases rapidly and reaches the peak value under very small strain.With the increase of deformation, the material softens, and the flow stress gradually decreases from the peak value and tends to be stable, reaching the stable stress state.In the process of titanium alloy deformation, not only stress softening but also work hardening exist, both of which can have an effect on the flow stress simultaneously.Due to BCC (Body-Centered Cubic) structure with high stacking fault energy in β matrix, it could speed up climbing and slipping of dislocation for DRV process[24].
Under the condition of high temperature plastic deformation, the relationship between flow stress,strain rate and temperature can be expressed by the hyperbolic sine function containing deformation activation energyQand temperatureTproposed by Sellars and Tegart[25], as shown in Eq.(13):
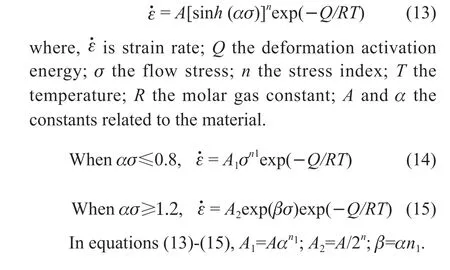
The logarithm of both sides of Eqs.(14) and (15)can determine the valuen1of β and , namely, Eqs.(16)and (17), can be expressed as:
where,n1=əln /əlnσ and β=əln /əσ.The peak stress under different conditions is regarded as the flow stress,and the relationship curves of lnσ-ln and σ-ln are obtained.The linear regression results are shown in Figs.9(a) and 9(b).n1and β can be respectively determined by the slops of lnσ-ln and σ-ln plots,and α can be calculated by β=αn1.Thenn1= 4.1669,β=0.06289 MPa-1, and α=0.01509 MPa-1.
Assuming that the activation energyQof thermal deformation is independent ofTin a certain temperature range, take logarithms of both sides of equation (13), as shown in Eq.(18):
At a certain temperature, the partial derivative of Eq.(18) can be obtained, and the calculation formula of deformation activation energyQcan be expressed as:
The relationship curves of ln[sinh(ασ)]-ln and ln[sinh(ασ)]-T-1are obtained, and the linear regression results are shown in Figs.10 (a) and 10(b).The average slope of the curve of ln[sinh(ασ)]-ln is 0.3257, son'=3.0699.The average slope is also obtained by linear fitting ln[sinh(ασ)]-1000×T-1,k=7.70533.Q=Rn'k(kJ/mol), andQis 196.664 kJ/mol.
According to the research of Zener C and Hollomon H[26], the strain rate of materials during high-temperature plastic deformation is controlled by thermal activation process, and the relationship between strain rate and temperature can be expressed byZparameter:
The physical significance ofZparameter is the temperature compensated strain rate factor, and take logarithms of both sides of Eq.(20), as shown in Eq.(21):
According to Eq.(21), the relationship of can be obtained and the linear regression result is shown in Fig.11.The value ofnis 3.0465, and lnAis 16.0298.Material constants of TC18 titanium alloy under compression deformation at high temperature are listed in Table 2.
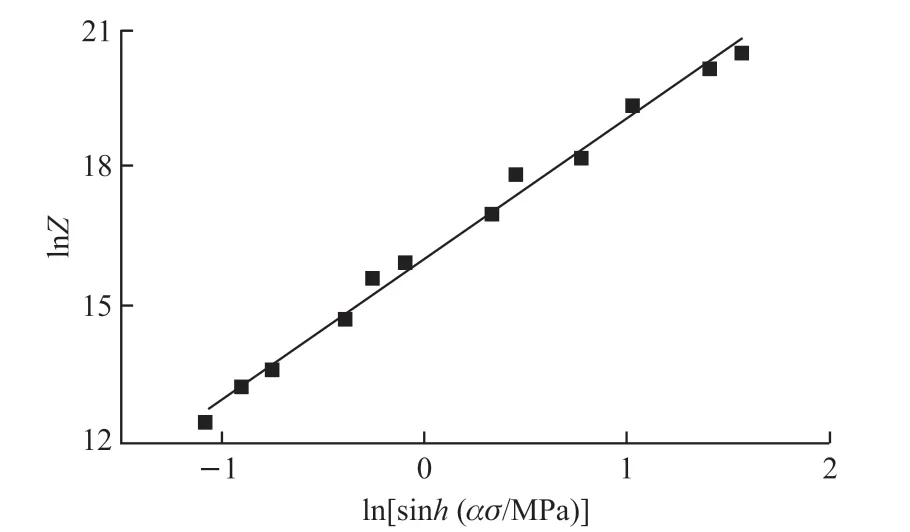
Fig.11 Relationship of InZ-In[sinh(ασ)] of TC18 titanium alloy
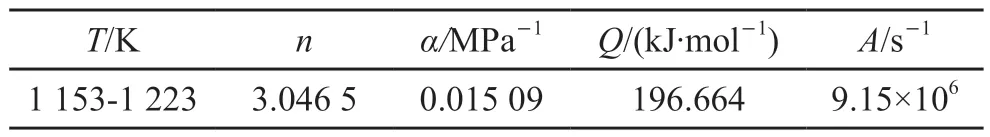
Table 2 Material constants of TC18 titanium alloy under compression deformation in single region
According to the definition of Arrhenius function and Eq.(20), σ can be expressed as a function ofZparameters, as shown in Eq.(22):
Therefore, the peak stress equation of TC18 titanium alloy can be expressed in Eq.(23):
4.2 Constitutive model of α+β region at low temperatures
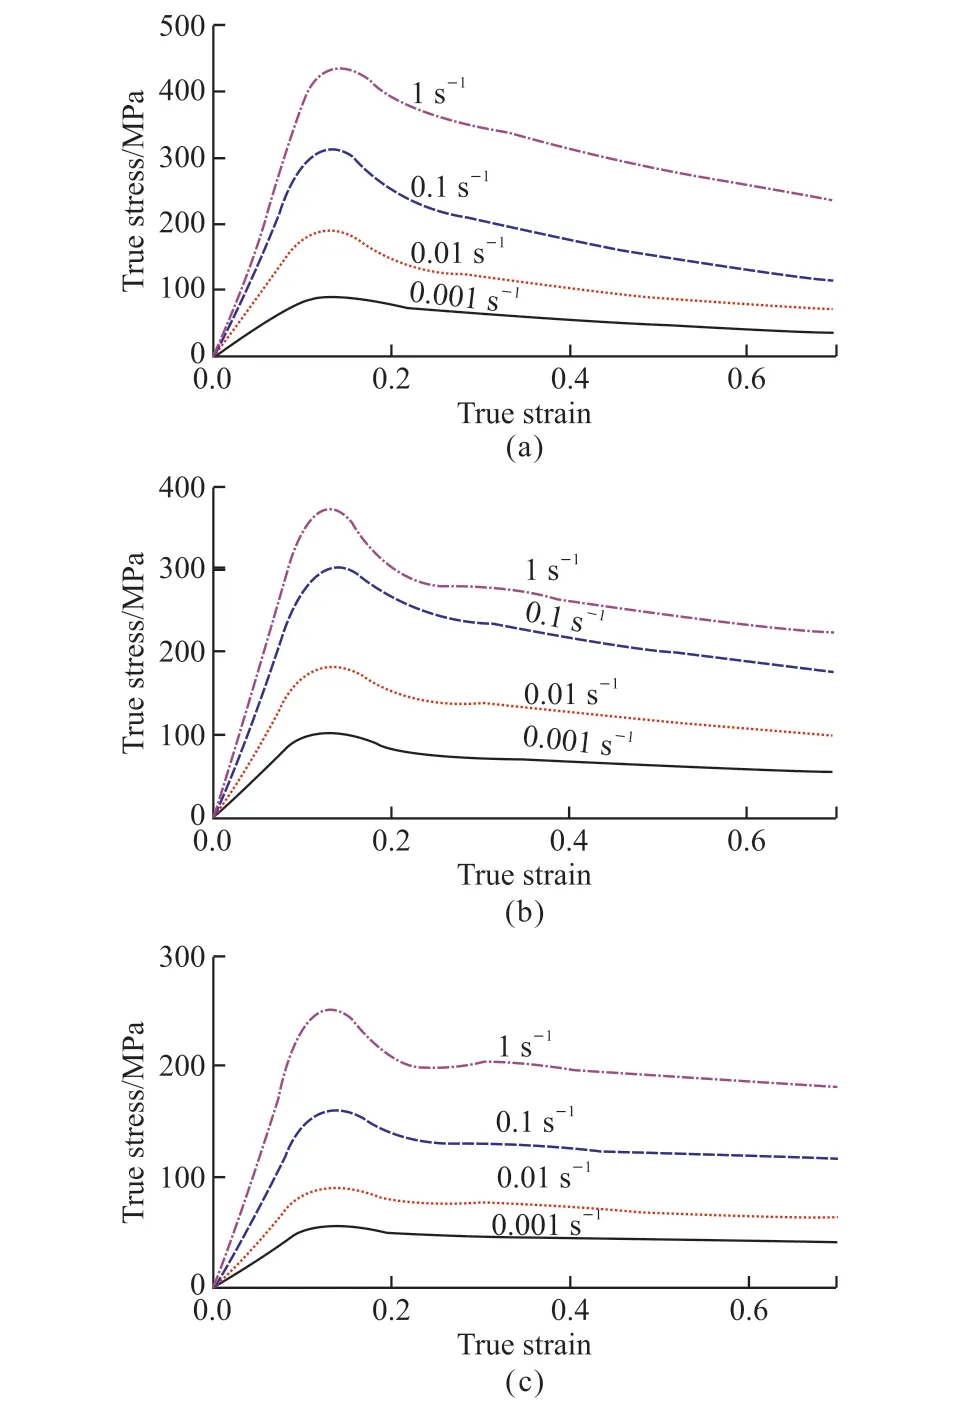
Fig.12 True stress-strain curves of TC18 alloy under different deformation temperatures: (a) 973 K; (b) 1 023 K; (c) 1 073 K
The specimens were compressed at the strain rates varying from 0.001 to 1 s-1and deformation temperatures was 973, 1 023, and 1 073 K.The flow stress curves are shown in Fig.12.Before reaching the peak strain, the variation trend of flow stress at low temperature is roughly the same as that in high temperature β region, both of which increase sharply to the peak stress, due to dislocation multiplication and continuous trapping by existing obstacles[27].As compression continues, dynamic softening has a greater effect on material behaviors than work hardening in α+β region, so the flow stress gradually decreases to the stable stress state.Fig.8 and Fig.12 exhibit that the stable state between work hardening and dynamic softening cannot be established easily with the temperature decreased and strain rate increased due to the restraint of softening effect under insufficient diffusion[23].The flow stress model of TC18 titanium alloy in α+β region was established in the same way as above, and the material constants of titanium alloy during compression deformation were obtained as shown in Table 3.
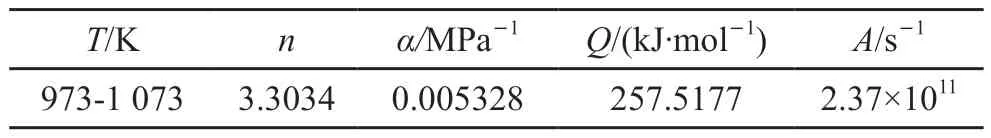
Table 3 Material constants of TC18 titanium alloy under compression deformation in region
The peak flow stress model of TC18 titanium alloy in α+β region at low temperatures was obtained,as shown in Eq.(24):
5 Conclusions
Under the thermodynamic calculation and the isothermal compression test of TC18 titanium alloy,the flow behaviors during hot deformation have been investigated and the flowing conclusions could be drawn:
a) The phase transition kinetics and the volume fraction of TC18 titanium alloy isothermal transformation at 1 073 K and continuous cooling at 1 273 K were studied by thermodynamic calculation and DSC experiment, and the phase transition kinetics equation was finally obtained.
b) Based on the hyperbolic-sine Arrhenius model,constitutive relationships were established to depict the flow stress of TC18 titanium alloy in single and regions, respectively.The results reveal that strain rates and deformation temperatures have a substantial influence on the flow stress of TC18 alloy.
c) A more accurate flow stress model was constructed by combining the phase transformation dynamic kinetics with constitutive models, giving a theoretical framework and empirical support for the hot deformation of TC18 titanium alloy.
Conflict of interest
All authors declare that there are no competing interests.
杂志排行

Journal of Wuhan University of Technology(Materials Science Edition)的其它文章
- Enhanced Electrochemical Performances of Ni Doped Cr8O21 Cathode Materials for Lithium-ion Batteries
- Design on the Prestressed Concrete Frame Beam-column
- Synthesis and Flocculation of Polyacrylamide with Low Water Absorption for Non-dispersible Underwater Concrete
- Experimental Behavior of Recycled Aggregate Concrete Filled Steel Tubular Columns
- Impact-abrasive Wear Behavior of ZTA and NbC Reinforced Fe60 Matrix Composites
- Synthesis and Characterization of Hollow Strontium Carbonate Pompons by Composite Soft Template Method