Synthesis and Flocculation of Polyacrylamide with Low Water Absorption for Non-dispersible Underwater Concrete
2024-01-03LIHonglingYANNaSUNGuowenZHENGHaoruiYANGXinyu
LI Hongling, YAN Na, SUN Guowen,3*, ZHENG Haorui, YANG Xinyu
(1. Depantment of Chemistry and Miaterials Engineering, Xinxiang Normal College, Xinxiang 453003, China; 2. School of Materials Science and Engineering, Shijiazhuang Tiedao University, Shijiazhuang 050043, China; 3. Hebei Key Laboratory of Advanced Materials for Transportation Engineering and Environment, Shijiazhuang 050043, China)
Abstract: The polyacrylamide which is directly added into concrete shows strong water absorption property.Thus the construction of underwater constructure would demand high amount of water, resulting in poor workability of concrete and strength shrinkage after hardening.Herein, a kind of anionic polyacrylamide(APAM) grafted with water reducing functional group (-COOH) was synthesized at low temperatures by partial factor design and response surface design.The structure and morphology of APAM were characterized by UV,FTIR and SEM methods.The experimental results show that the molecular weight of the synthesized APAM could reach 11 million, under the condition that the temperature was 35 ℃, the pH value was 8, the monomer concentration was 27wt%, the initiator dosage was 0.6wt%, and the monomer ratio (n(AM): n(AA)) was 3.When the APAM was applied into the underwater slurry, it presented good flocculation and low water demand.When the dosage was 1% of the mass of the cement, the water demand increased by 12%, which could meet the self-leveling and anti-dispersity of the underwater slurry at the same time.This technology provides technical guidance for the large-scale industrial production of polyacrylamide for underwater concrete construction while achieving environmental protection during production.
Key words: non-dispersible underwater concrete; anionic polyacrylamide; partial factor design; response surface design; flocculation
1 Introduction
With the fast development of the infrastructure,more and more underwater constructions such as crosssea bridges and river-crossing bridges have been built,which raises higher requirements for concrete performance.To be directly applied at underwater condition,non-dispersible underwater concrete has been developed, as called “brand new, ideal and epoch-making concrete”[1].To prepare non-dispersible underwater concrete, normally anti-wash admixtures are added into ordinary concrete, which behaves as flocculant to ensure the concrete to maintain good workability and anti-dispersity.As such, the performance of non-dispersible concrete is more stable in underwater construction[2-5].At present, the most commonly used flocculants are cellulose and polyacrylamide[6].However, the molecular structures of these two kinds of flocculants are not designed to be applied as flocculants in underwater constructions, but in many other fields,thus its performance cannot meet the needs of structural engineering and the performance requirements of underwater concrete.
Kawai and Okada[7]showed that when cellulose was mixed with naphthalene superplasticizer in alkaline environment, a gel was formed due to chemical reaction, resulting in poor compatibility.Besides, cellulose was incompatible with the polyalkyl sulfonate superplasticizer, resulting in abnormal viscosity growth.Khayatet al[8]showed that the addition of cellulose anti-wash admixtures could significantly improve the anti-dispersity of non-dispersible underwater concrete.However, it also increased the air content of concrete by 1%-2.3%, which directly led to the reduction of compressive strength by 5%-10%.Raiet al[9]showed that with the increase of polyacrylamide content, PAM dispersed in hydrated cement could induce cross-linking between solidified particles, resulting in the increase of densification and decrease of porosity.Sunet al[10]showed that anionic polyacrylamide (APAM)was suitable for inducing cement to form flocs.It could react with Ca2+produced by cement hydration to form ionic compounds and wrap them on the surface of cement particles to form an incomplete continuous network system.Macroscopically, APAM can improve the mechanical properties of concrete, while with poor construction performance.Sakutaet al[11]showed that adding glutaraldehyde as an auxiliary agent based on polyacrylamide can improve the anti-dispersity of non-dispersible underwater concrete and reduce the amount of polyacrylamide, thus reducing the cost.
Based on these previous studies, it can be found that when cellulose is applied to concrete as a flocculant, the required dosage of the superplasticizer is relatively high.Meanwhile, the setting time of concrete is long, the strength is also low, and the price of cellulose is slightly high, so there will be certain restrictions in a large-scale application.On the contrary, the price of polyacrylamide is relatively low, and there are little compatibility problems with the superplasticizer.Moreover, the reaction with Ca2+can reduce the content of Ca(OH)2, thus changing the physical structure of the interface transition zone and significantly improving the bonding strength of the aggregate-cement interface.Therefore, it is more reasonable to choose polyacrylamide as the main agent of anti-wash admixtures.
At present, polyacrylamide is mainly used in water treatment, oil exploitation and other fields.Songet al[12]synthesized amphiphilic polyacrylamide by inverse emulsion polymerization, which achieved good performances in sewage treatment.Mishraet al[13]successfully synthesized St-g-PAM copolymer by grafting polyacrylamide with starch.They have found that its flocculability in water treatment was significantly higher than that of a single polymer.Mishra[14]and Rani[15]et algrafted polyacrylamide onto the agar skeleton, and the synthesized Ag-g-PAM significantly reduced the metal content and organic pollutant load of wastewater.Zhuet al[16]applied terpolymeric cationic polyacrylamide P(AM-DMC-DAC) to activate sludge dewatering.The results showed that the moisture content of filter cake could reach 63.5% at pH of 7.Though polyacrylamide has shown many merits in the above-mentioned application, yet when it is directly applied to underwater construction, it would absorb high amount of water, leading to poor workability, strength shrinkage after hardening and poor durability of concrete.Most importantly, the water-way strength ratio can not meet the design requirements.Therefore, it is particularly important to modify acrylamide by grafting groups with lower water reducing function to reduce the water demand of concrete.
Therefore, this article combines partial factorial design and response surface design to optimize the synthesis route and parameters, grafting the carboxyl (-COOH) on acrylamide to synthesize an anionic polyacrylamide with good performance and low water absorption.Its structure and performance applied to underwater slurry were characterized to make APAM more suitable for underwater concrete construction.
2 Experimental
2.1 Materials
The synthetic materials are acrylamide (AM),acrylic acid (AA), disodium ethylene diamine tetracetic acid (EDTA-2Na), water-soluble initiators 2, 2-azobis(2-methylpropionconidine) dihydrochloride(V-50),anhydrous sodium bisulfite (NaHSO3), potassium persulphate (K2S2O8), sodium formate, urea and sodium hydroxide(NaOH).The above reagents are analytically pure.Other materials include reference cement, produced by China Resources Cement Group.
2.2 Preparation of polyacrylamide
APAM was prepared by an aqueous solution method, as shown in Fig.1.Firstly, AA was adjusted to a certain pH value with 1 mol/L NaOH solution and mixed with a certain proportion of AM solution, deionized water was added to achieve the target concentration.Urea, EDTA-2Na and sodium formate were added in turn, and the homogeneous solution was obtained by stirring at room temperature.Then the system was deaerated with nitrogen for 20 minutes, heated to a certain temperature, and then V-50, K2S2O8and NaHSO3were added.Finally, the system was sealed and polymerized for 4 h.After drying and crushing, the powdered polyacrylamide was obtained.
2.3 Microstructure characterization
2.3.1 Ultraviolet spectrum analysis (UV)
AM, AA and APAM were mixed with deionized water to prepare a certain concentration of the aqueous solution.Then the UV-2450 spectrophotometer was used to record the spectra in the range of 200-900 nm.
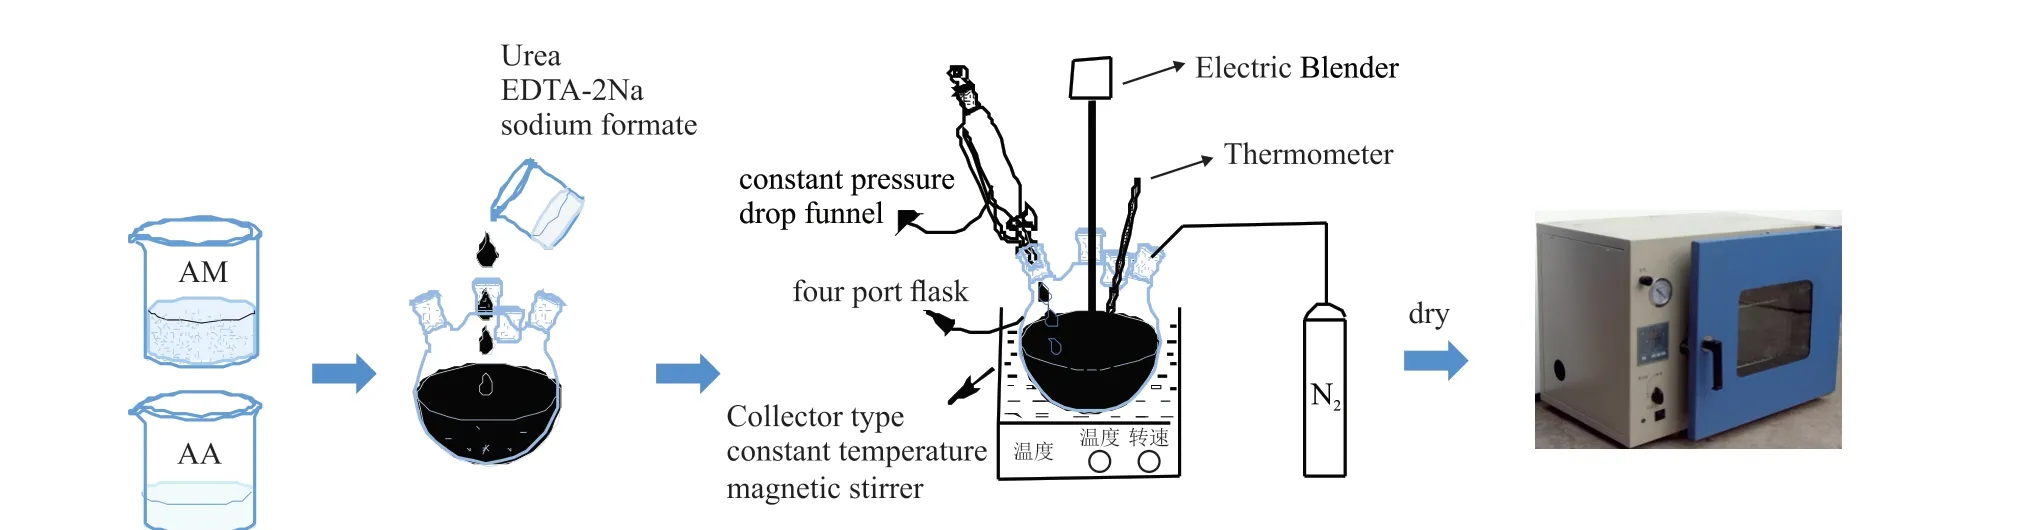
Fig.1 Synthesis diagram of APAM
2.3.2 Infrared spectrum analysis (FTIR)
The FTIR spectra of APAM were recorded using KBr pellets.An Avatar 330 Fourier transform infrared spectrometer (Nicolet, America) was used to record the spectra in the range of 4 000-400 cm-1.
2.3.3 Scanning electron microscopy analysis (SEM)
SEM using SU8010 field-emission electron microscope of HITACHI at an accelerating voltage of 5.0 kV.The samples were treated with the HITACHI MC1000 gold spraying instrument to prevent the accumulated charge generated when the incident electron beam hits the sample and affect the image effect.
2.4 Flocculation test
Anti-dispersity and fluidity are important performance indexes for non-dispersible underwater concrete.The cementitious material of concrete is mainly cement paste.Therefore, the viscosity of cement paste may fundamentally affect the workability of non-dispersible underwater concrete.The anti-dispersity test and fluidity test of cement paste are used to characterize the flocculation of APAM.
2.4.1 Anti-dispersity test
In this paper, the flocculation of APAM was evaluated by the turbidity value of the supernatant after cement passing through the water layer.The lower the turbidity value, the better the anti-dispersity of cement,that is, the better the flocculation of APAM.The test was carried out in strict accordance with the anti-dispersity regulations in DL/T 5117-2000[17].
2.4.2 Fluidity test
The jumping table test specified in GB/T 2419-2005 was used to determine the fluidity of cement paste mixed with APAM.
3 Optimization of key synthesis parameters of APAM
Factor design is mainly used to analyze the significance of each factor, which plays a key role in screen-
ing important factors from a large number of factors.In this paper, through partial factor design, five factors were designed to investigate the significance of each factor, including monomer concentration, monomer ratio (n(AM):n(AA)), initiator dosage, reaction temperature and pH value.Based on the partial factor design, the factors that have a significant influence on test indexes were selected for response surface design, and the process parameters were optimized by establishing a mathematical surface model[18,19].Both of them are widely used in optimization test[20-24].It should be emphasized that the turbidity value of anti-dispersity is selected as the evaluation index in this paper.
3.1 The process of parameter optimization

Table 1 Factors and levels of 25-factor design experiment
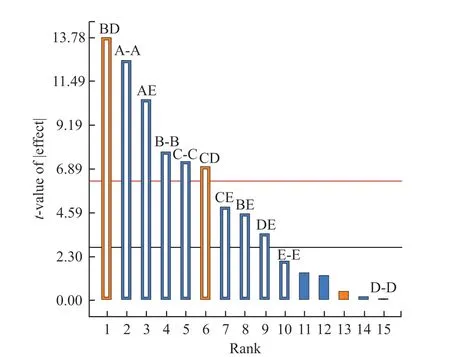
Fig.2 Pareto chart
Based on the single-factor test, the turbidity value at 0.4% dosage of the mass of cement was taken as the measurement index, and the monomer concentration(A), monomer ratio (n(AM):n(AA)) (B), initiator dosage (C), pH value (D) and temperature (E) were taken as the design variables.The factors and level values are shown in Table 1, and the partial factor design test results are shown in Table 2.
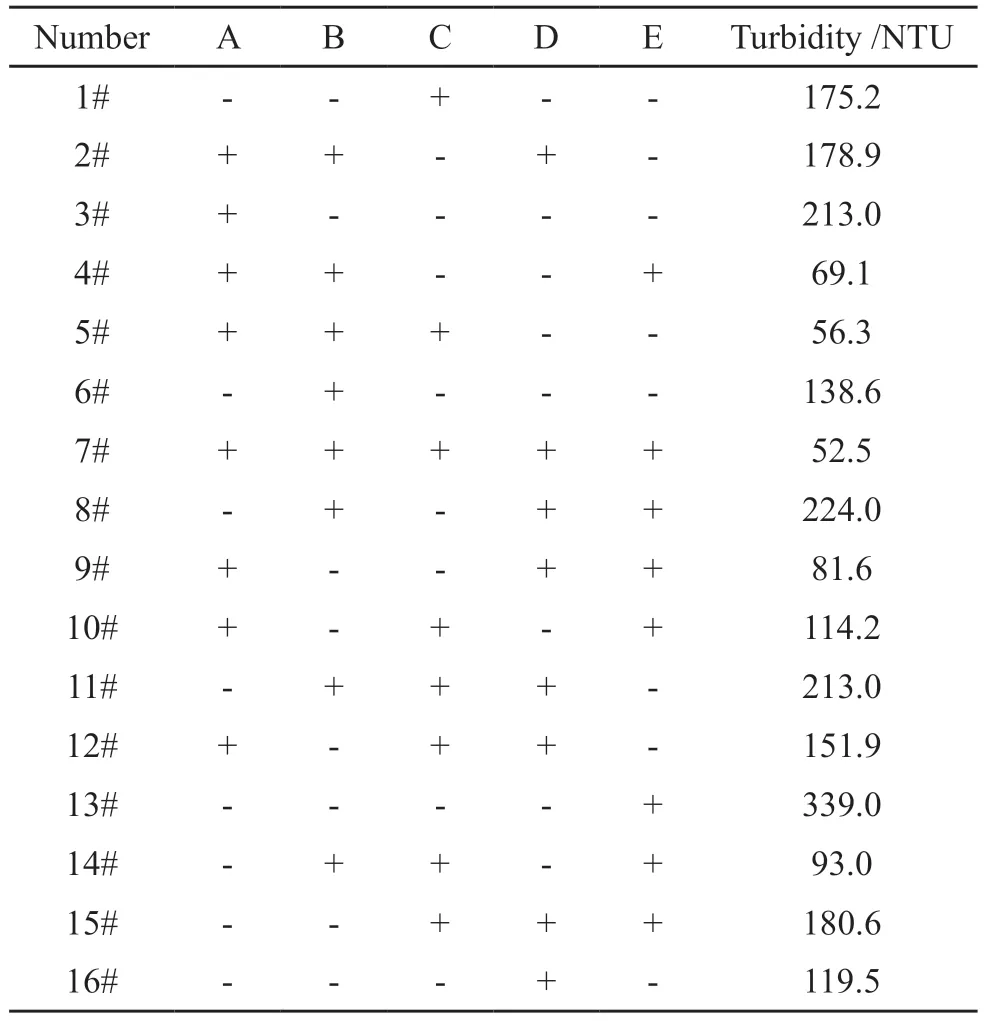
Table 2 Result of 25-factor design experiment
The Pareto chart, as shown in Fig.2 is obtained by analyzing the test results of partial factor design.The Pareto Chart takes each factor as the abscissa and is arranged from left to right according to the t-value of each factor.Under the condition of α= 0.05, the limitt-value is 2.77645, and the factor exceeding this criticalt-value is the significant factor.It can be seen from the figure that in the main effect, monomer concentration,monomer ratio and initiator dosage significant affect the turbidity value.In contrast, the temperature and pH value show minor influence on the turbidity.Therefore,considering the experimental results of the partial factor design, the monomer concentration, monomer ratio and initiator dosage were selected for response surfacedesign.
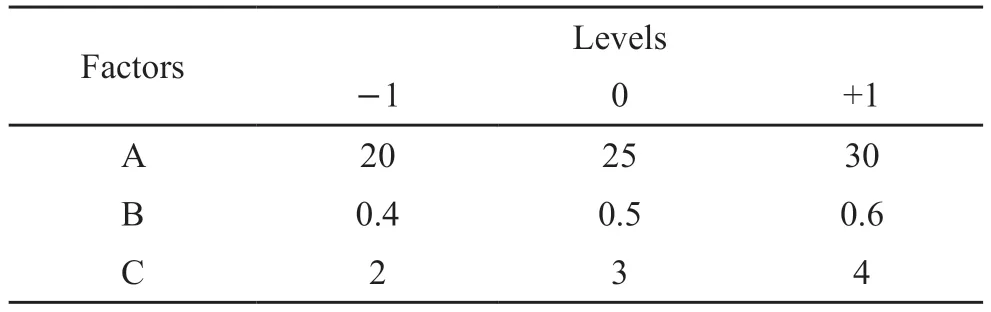
Table 3 Factors and levels of response surface design experiment
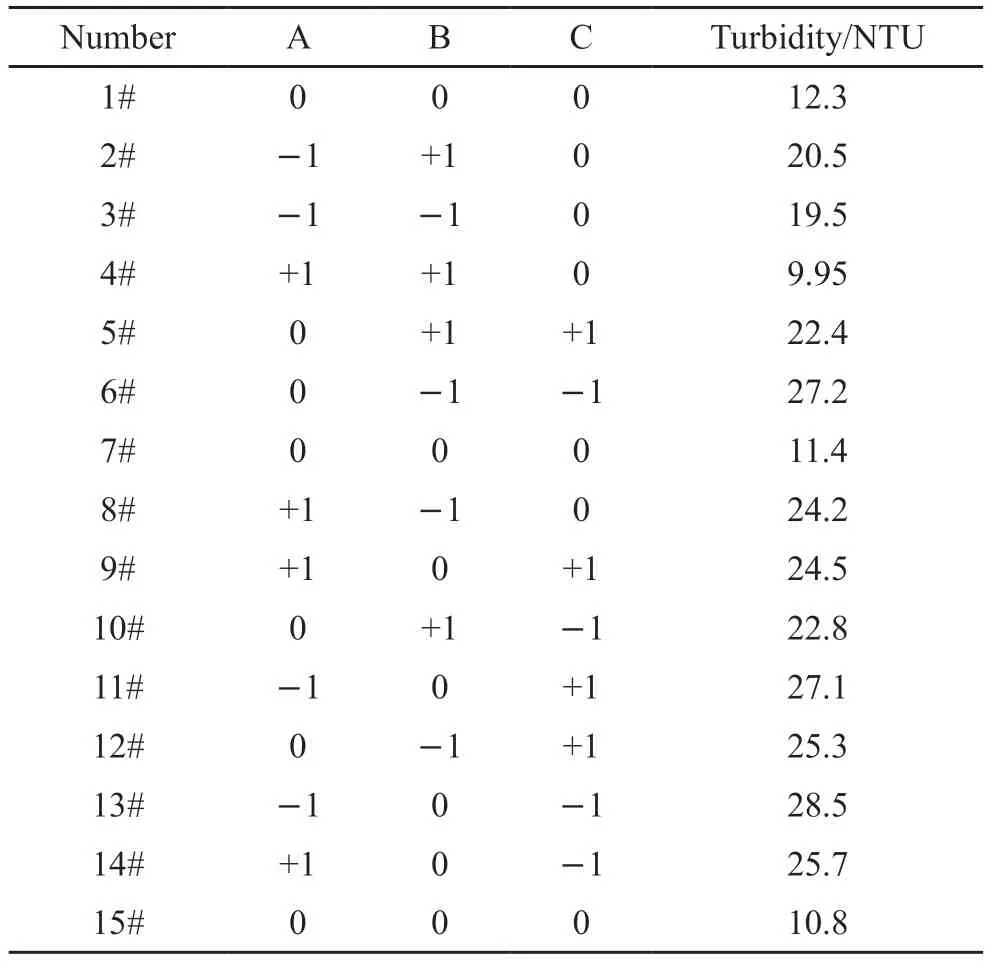
Table 4 Test results of response surface design experiment
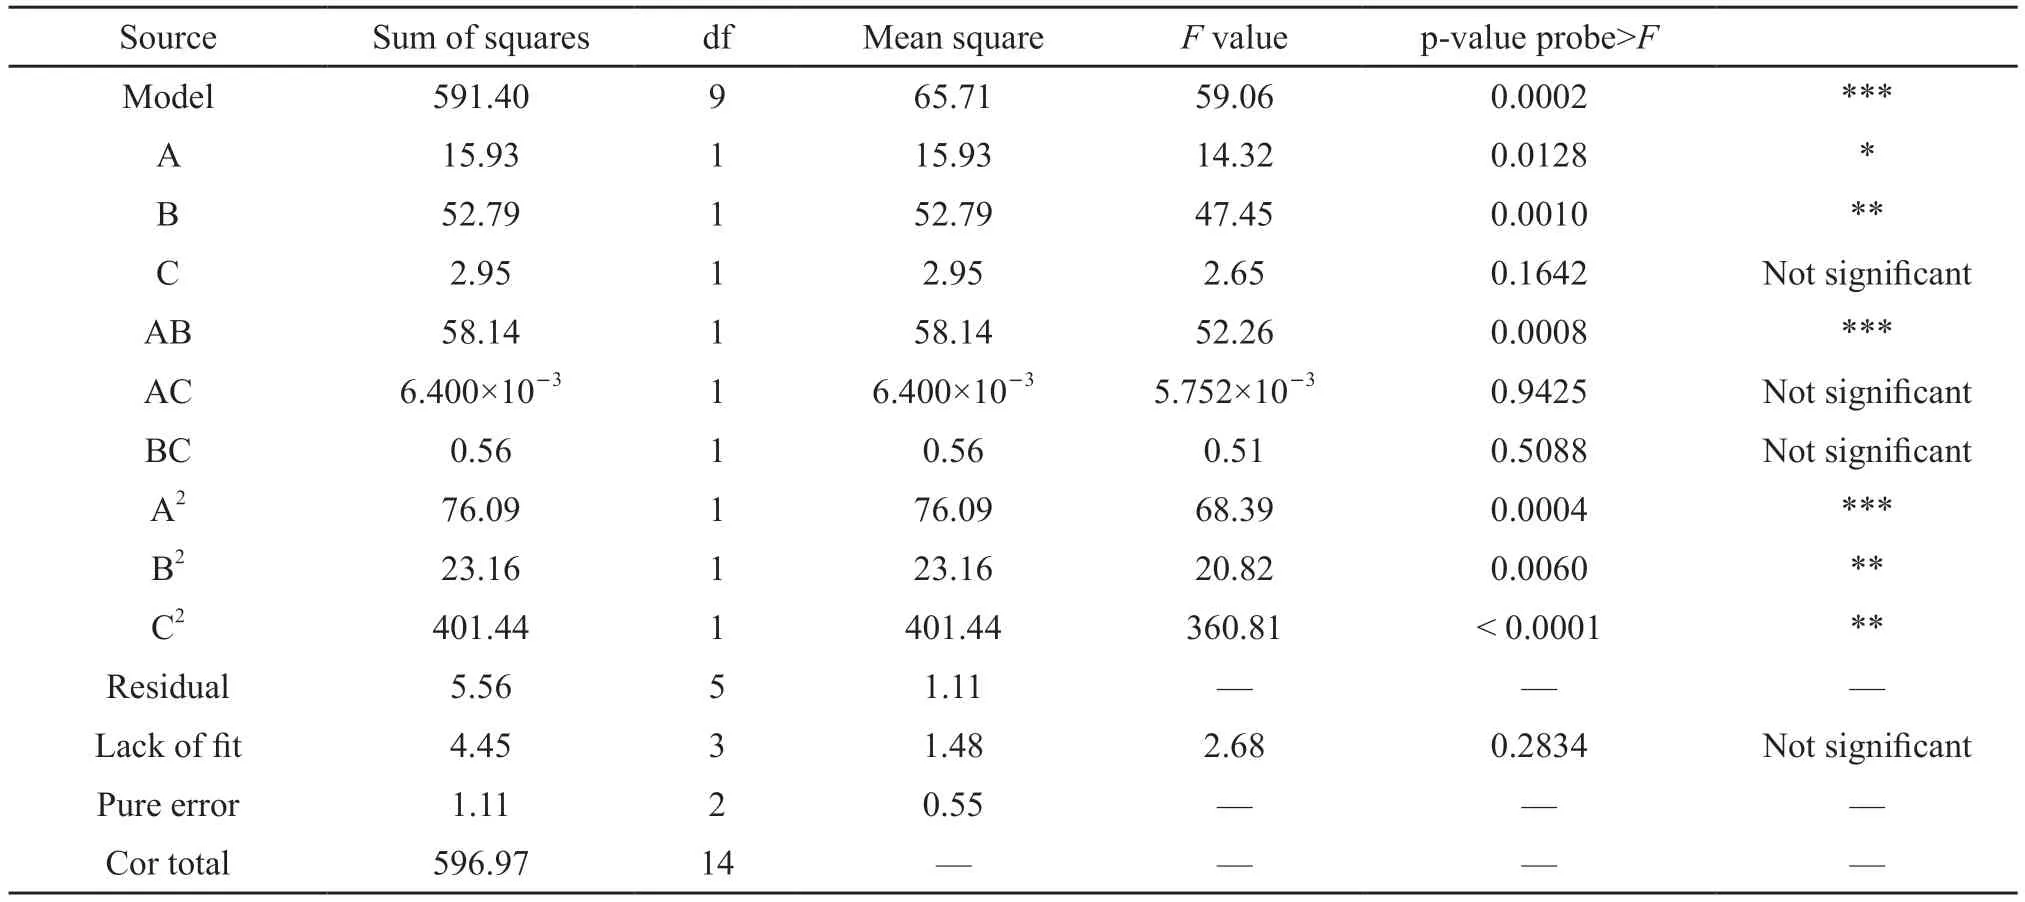
Table 5 ANOVA results
Based on the partial factor design, response surface design was used to optimize the process parameters.The Box-Behnken response surface model was established by controlling temperature at 35 ℃ and pH value at 8, taking monomer concentration (A), initiator dosage (B) and monomer ratio (C) as design variables and turbidity value at 1% dosage of the mass of cement as response value.The factors and levels of experimental design are shown in Table 3.The response surface design and test results are shown in Table 4.
The binary regression mathematical model by coding is given as follows:
The analysis of variance (ANOVA) of the model is shown in Table 5.The ANOVA results include the significance of the linear term, the quadratic term (interaction) and the square term.It can be seen from the table that monomer concentration, initiator dosage and the square terms of the three factors are significant in affecting xxx.The significance order of the main effect is B>A>C; the significance order of the square term is C2>A2>B2; the significance order of the interaction is AB>BC>AC; that is, monomer concentration and initiator dosage present a significant effect in the main effect.
Further error analysis of the established regression mathematical model is carried out, and the results are shown in Table 6.
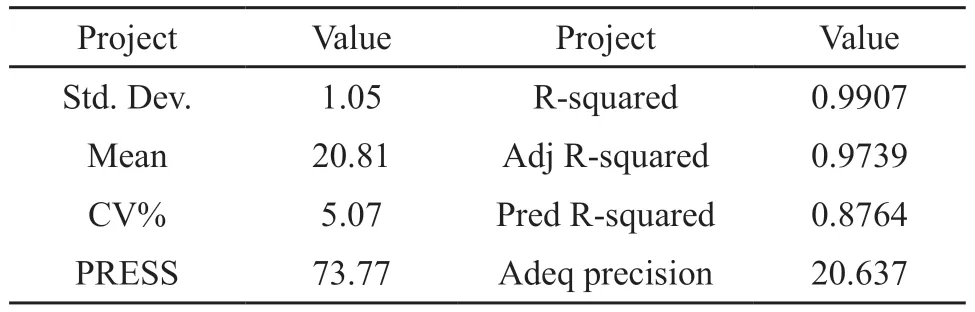
Table 6 Error analysis
According to the analyses in Table 5 and Table 6, the p-value of the model is 0.0002(<0.001), which means that the binary regression mathematical model is extremely significant; the p-value of the lack of fit is 0.2834(>0.05), that is, the lack of fit is not significant; the correlation coefficient of the model (R2) is 0.9907; the values ofRAdj2andRPred2are relatively high,andRAdj2-RPred2=0.18<0.2, which indicates that the factors considered in the model are comprehensive and can fully explain the process, and there are no other significant factors that have not been considered;CV=5.07%<10%, that is, the reliability and accuracy of the design are relatively high.
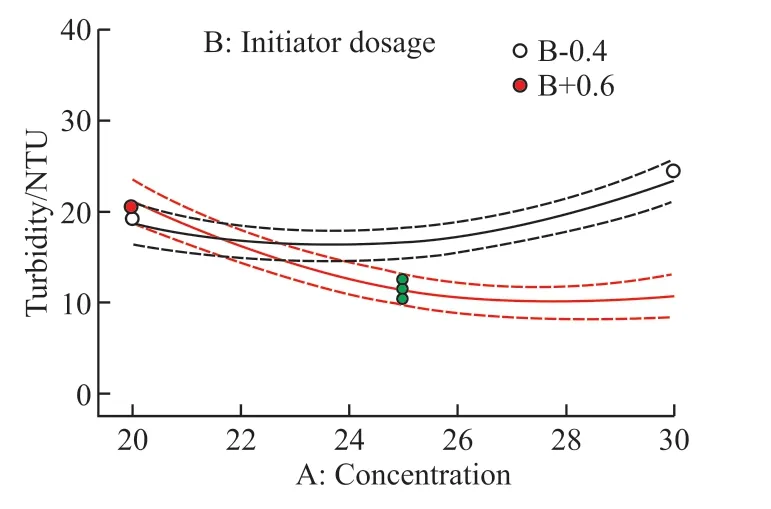
Fig.3 Interaction between factors A and B
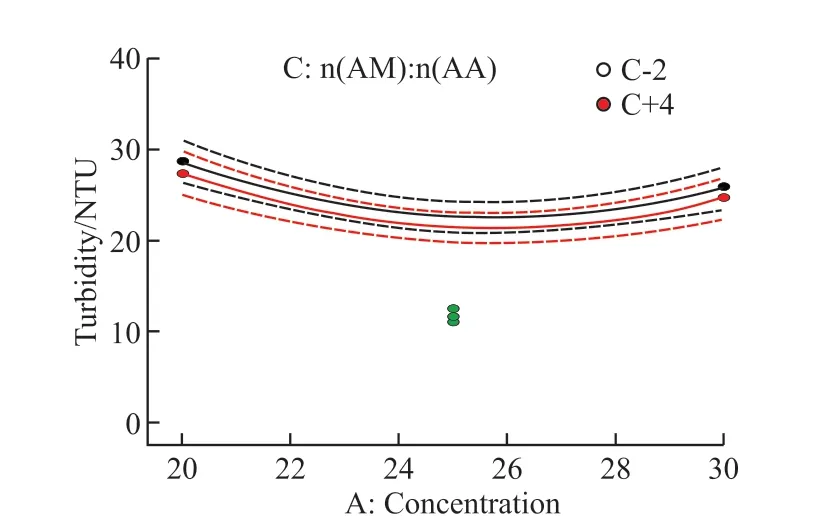
Fig.4 Interaction between factors A and C
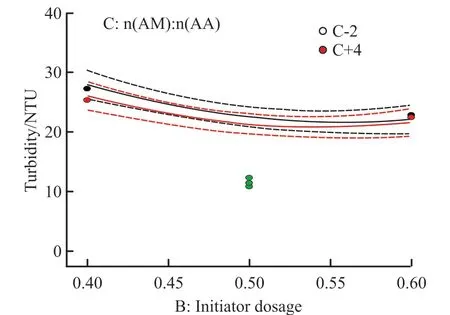
Fig.5 Interaction between factors B and C
The interaction diagram can show how the relationship between one factor and the response value depends on the second factor.Thex-axis is the value of one factor in the level range.The two separate lines in the figure are the two level values of the other factor,and the less parallel the two curves, the stronger the interaction.Fig.3-Fig.5 show the interaction between the other two factors under the condition of a certain factor in the center value (The dots in the figure are individual points in the software running process).It can be seen from the figure that the interaction between monomer concentration and initiator dosage is the strongest, followed by the interaction between initiator dosage and monomer ratio.However, the two lines in the interaction diagram of monomer concentration and monomer ratio are nearly parallel, that is, there is almost no interaction between them, which is consistent with the ANOVA results.
The significance of interaction can also be analyzed and evaluated by intuitive three-dimensional response surface charts and two-dimensional contour charts.The closer the shape of the two-dimensional contour is to the ellipse, the more significant the interaction is[25].The response surface charts and their corresponding contour charts according to the established regression mathematical model are shown in Fig.6-Fig.8.
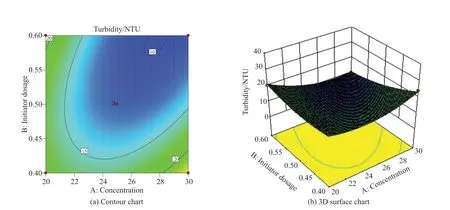
Fig.6 Interaction between monomer concentration and initiator dosage
Fig.6 shows the effect of the interaction between factor A (monomer concentration) and factor B (initiator dosage) on turbidity under the condition of factor C (n(AM):n(AA)) in the central value.It can be seen from Fig.6(a) that the contour of factors A and B are obvious ellipse, indicating that the interaction is very significant, which is consistent with the result of ANOVA(PAB=0.008<0.01).It can be seen from Fig.6(b)that with the increase of monomer concentration and initiator dosage, the turbidity value first decreases and then increases, and the curve changes steeply when the initiator dosage and monomer concentration are large.As such, the minimum value appears in the range of higher monomer concentration (26wt%-28wt%) and higher initiator dosage (0.5wt%-0.6wt%).
Fig.7 shows the effect of the interaction between factor B (initiator dosage) and factor C (n(AM):n(AA))on turbidity under the condition of factor A (monomer concentration) in the central value.It can be seen from Fig.7(a) that the contour of factors B and C are smaller than the ellipse in Fig.6(a);i e, the interaction is not very significant, which is consistent with the result of ANOVA (AB > BC); It can be seen from Fig.7(b) that with the increase of initiator dosage andn(AM):n(AA),the turbidity value first decreases and then increases,i e, the minimum value appears in the range of initiator dosage is 0.5wt%-0.6wt% and monomer ratio is 2.5-3.5.The action of the surface is the action of the square term.From the figure, it can be seen that the steepness of surface C is larger than that of surface B;i e, the significance of C2is larger.
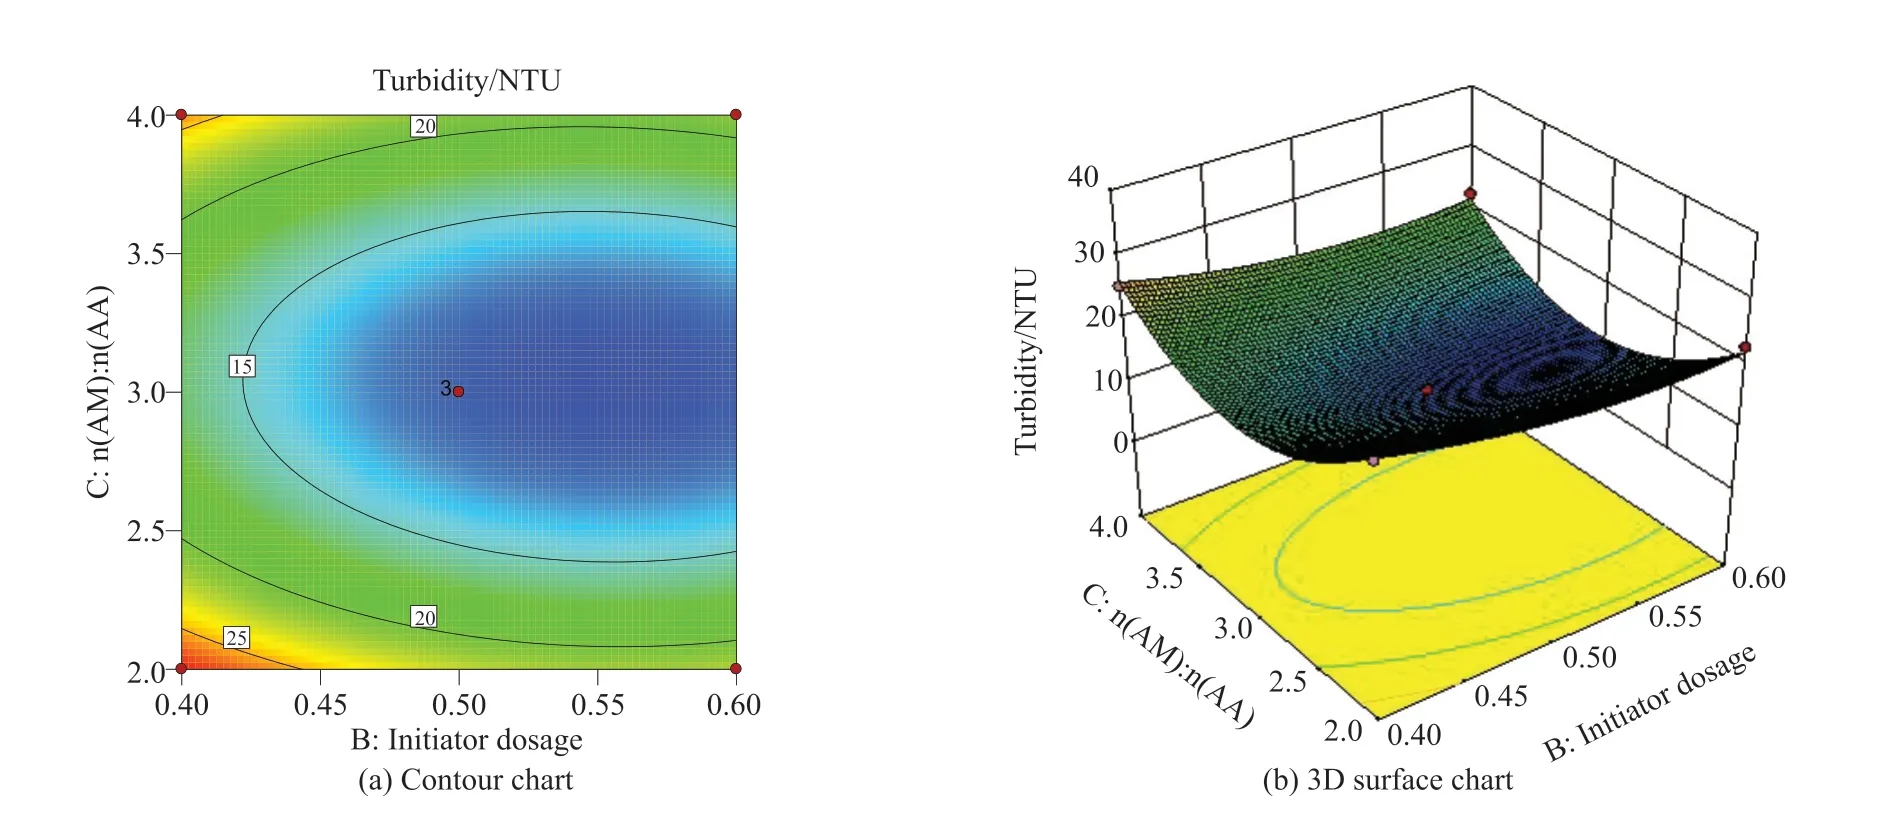
Fig.7 Interaction between initiator dosage and n(AM):n(AA)
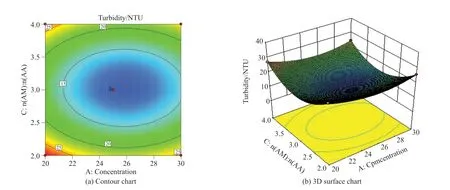
Fig.8 Interaction between monomer concentration and n(AM):n(AA)
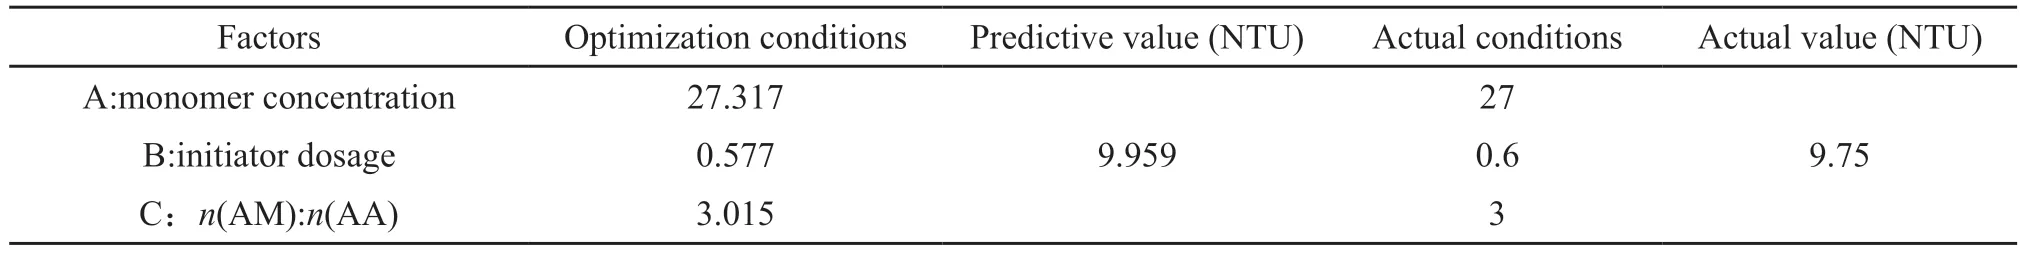
Table 8 Verification results of response surface model
Fig.8 shows the effect of the interaction between factor A (monomer concentration) and factor C (n(AM):n(AA)) on turbidity under the condition of factor B (initiator dosage) in the central value.It can be seen from Fig.8(a) that the contour of factors A and C are more circular than those in Fig.6(a) and Fig.7(a),i e,the interaction is not very significant, which is consistent with the result of ANOVA(AB>BC>AC); It can be seen from Fig.8(b) that with the increase of monomer concentration andn(AM):n(AA), the turbidity value first decreases and then increases, i.e., the minimum value appears in the range of monomer concentration is 26wt%-28wt% andn(AM):n(AA) is 2.5-3.5.And the surface C is steeper than the surface A, that is C2>A2.
The global optimization of the response surface model can obtain the optimal process conditions and corresponding predicted values and perform experimental verification.The results are shown in Table 8.In this way, based on the predicted results, the actual conditions in the table are taken for each factor level in the experimental verification.
Under this condition, the transparent viscous liquid APAM synthesized by aqueous solution methods is dried and crushed to obtain the powder, as shown in Fig.9.
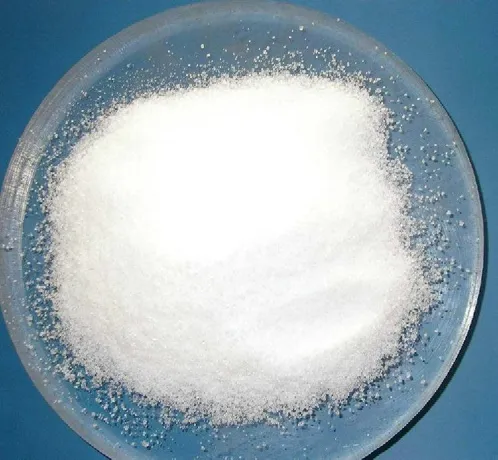
Fig.9 Synthesized APAM
3.2 Characterization of synthesized APAM
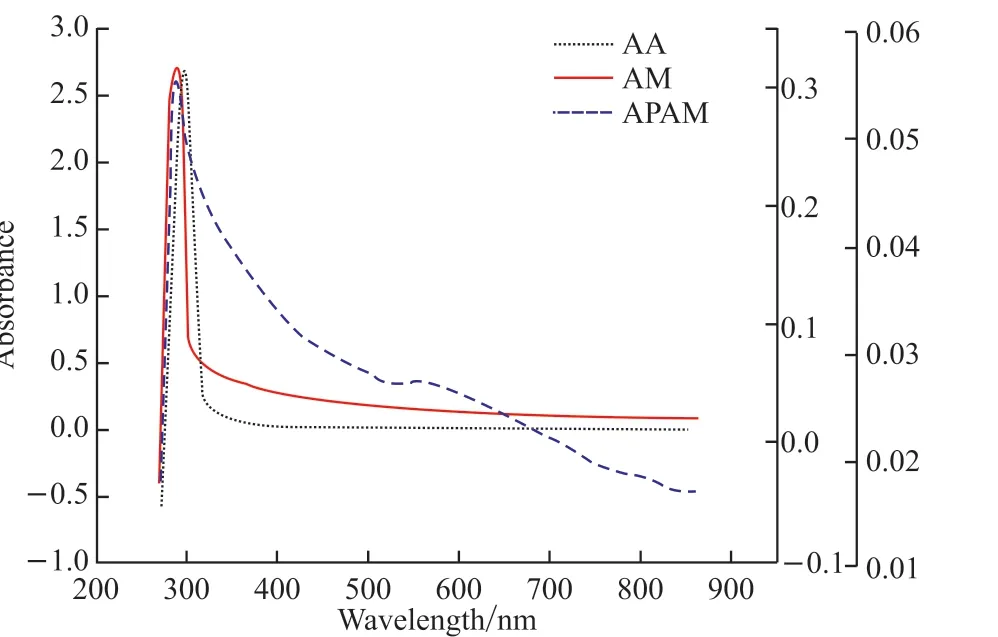
Fig.10 UV spectra of APAM
Fig.10 is the UV spectra of APAM.It can be seen from the figure that the absorption peak of AM appears at about 284 nm; the absorption peak of AA appears at about 300 nm; APAM presents two absorption peaks between 200 and 600 nm, to be explicitly, which locates at 284 and 550 nm, respectively.Compared with the absorption peaks of AM and AA, APAM shows a new absorption peak at 550 nm, which is offset from the main peak.It proves that the polymerization reaction takes place between the monomers and forms polymer.
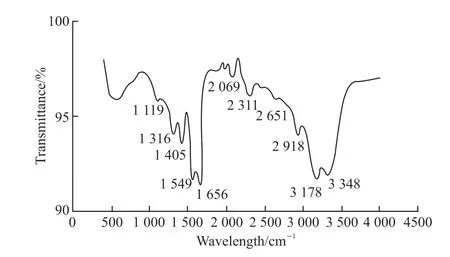
Fig.11 IR spectrum of APAM
Fig.11 is the IR spectrum of APAM, it can be seen from the figure that the stretching vibration peaks of the primary amide (-NH2) and secondary amide (-NH)in the amide group appear at 3 348 and 3 178 cm-1,respectively.The stretching vibration peaks of the carbonyl group (C=O) and -CN in amide group appear at about 1 656 and 1 119 cm-1, respectively.In addition,the absorption peaks at 1 405 and 1 549 cm-1are symmetric and antisymmetric stretching vibration peaks of the carboxyl (-COO-), respectively.The characteristic absorption peak of methylene (-CH2) in the skeleton is at 2 918 cm-1, and the peak at 1 316 cm-1is caused by the stretching vibration of methine(-CH) in the long chain[26-28].The above analysis shows that the APAM is formed by copolymerization of AM and AA.
Fig.12 shows the SEM images of APAM at the magnification of 1 000, 2 000 and 3 000, respectively.It can be seen that the surface of APAM is assembled by multiple different layers, which increases the surface area of APAM to a certain extent, and further increases its adsorption and bridging ability in the flocculation process.Macroscopically, the cement mixed with APAM possesses better underwater anti-dispersity.
4 Study on flocculation
4.1 Test of f locculation
APAM was used in cement paste to evaluate the water absorption and flocculation performance of polyacrylamide.To reduce the test error, the water-cement ratio of cement paste is 0.45, which can avoid the influence of superplasticizer and other admixtures on the test results.The mix proportion is shown in Table 9.
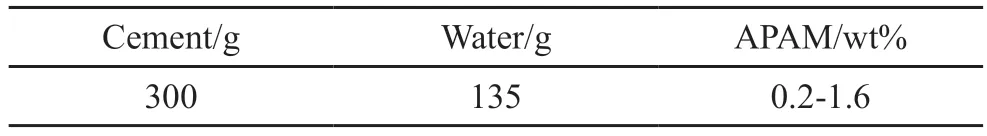
Table 9 Mix proportion of cement paste
Fig.13 shows the changes in fluidity and anti-dispersity of cement by adding various amount of APAM.Combined with Fig.14, it can be seen that the cement paste shows good fluidity and anti-dispersity when the dosage is 1% of the mass of cement.On the one hand,it can meet the requirement of underwater self-leveling.On the other hand, the segregation and dispersion of cement after being washed by water are also less and the upper water area is relatively clear after standing for a period of time.At the same time, according to the water requirement of normal consistency, the water demand of cement paste only increased by 12%.This further proves that the carboxyl groups grafted to the side chains can reduce the water absorption of polyacrylamide itself.In addition, the carboxyl groups of the side chains can also reduce the surface tension of water[29], which also significantly reduces the water absorption of polyacrylamide.
4.2 Analysis of microscopic mechanism
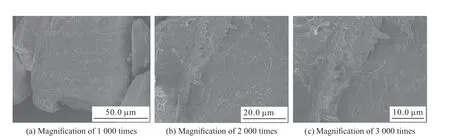
Fig.12 SEM images of APAM
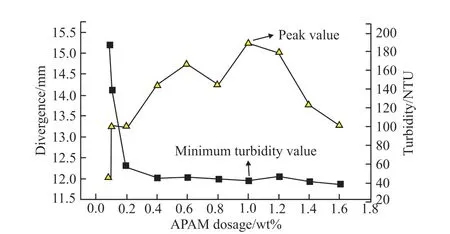
Fig.13 Curves of fluidity and anti-divergence with APAM dosage
It can be seen from the “divergence-APAM dosage” curve in Fig.13 that the fluidity of cement paste increases first and then decreases with the increase of APAM dosage.It is because the surface of cement particles has the same electric charge, leading to the repulsion between particles.When less APAM is added, the repulsive energy between the particles is reduced under the double effects of electric double layer collapse and charge neutralization[30], and the interaction between the particles begins to be dominated by the attractive interactions.Macroscopically, it reflects on the increase of viscosity.With the continuous increase of APAM content, the long chains of APAM in the system increases,and the surface of cement particles is tightly wrapped by the long chain of APAM.Under the action of steric hindrance and vacancy[30], the repulsion between cement particles increases, and the distance between cement particles increases.Macroscopically, it presents as the decrease of viscosity; When it reaches a certain value(1wt%), if the APAM content increases again, the long chain of APAM forms a spatial network under the dual effects of bridging and hydrogen bonding, thus the cement particles are clustered together, and the distance between particles decreases.
It can be seen from the “turbidity-dosage” curve in Fig.13 that the underwater anti-dispersity gradually increases with the increase of APAM dosage.When the dosage is greater than 0.2wt%, the turbidity starts to level off, that is, when the dosage reaches a certain value, increasing the APAM dosage has little effect on the anti-dispersity.It can be explained by the adsorption bridging theory from khayat[31]and Cano-Barrita[32]:when the concentration of APAM is low, the hydrogen bond on the molecular chain and free water will attract each other through electrostatic attraction to make APAM solvate and expand, thus increasing the viscosity of cement paste, as shown in Fig.15(a); when the concentration of APAM increases, the long chains between APAM are intertwined to form a gel-like network structure, restricting free water to increase the viscosity of the system, as shown in Fig.15(b); when the concentration of APAM continues to increase, the long chain of APAM are adsorbed on the surface of cement particles to form a bridge, which significantly increases the viscosity of cement[33], as shown in Fig.15(c).
5 Conclusions
a)Using AM and AA as the main monomers, the anionic polyacrylamide with a molecular weight of 11 million was synthesized under the redox-azo multi-initiating system.The microstructure was characterized by UV, FTIR and SEM analysis, which proved that APAM was successfully synthesized.
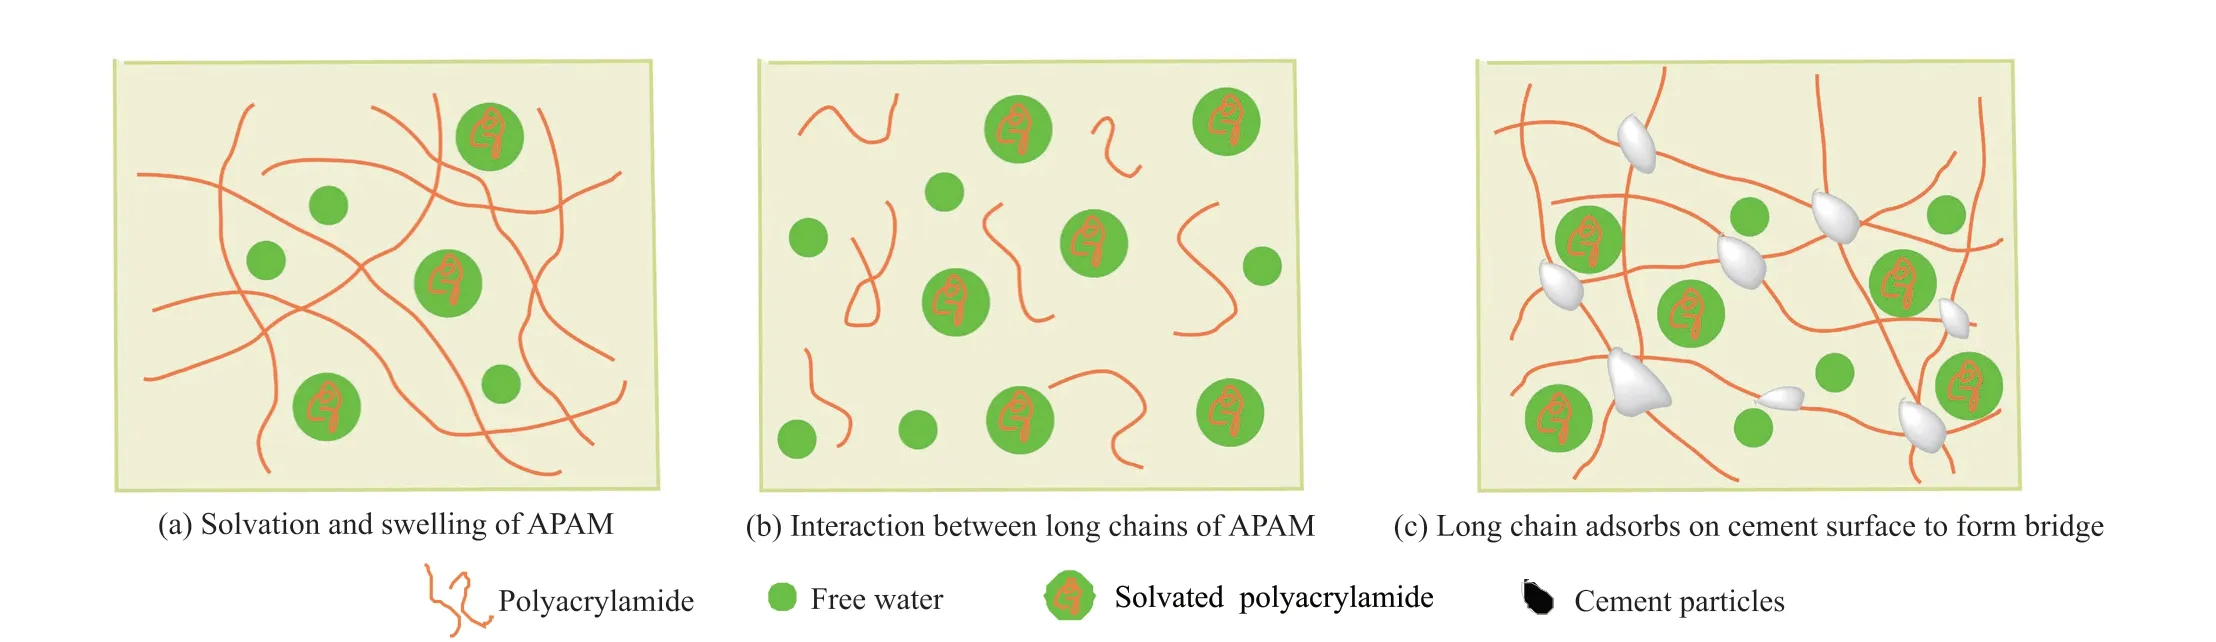
Fig.15 Schematic diagram of polyacrylamide flocculation process
b)By using monomer concentration, monomer ratio, initiator dosage, reaction temperature and pH value as factors, and using turbidity value as the index, partial factor design was carried out.The results showed that the monomer concentration, monomer ratio and initiator dosage showed a significant effect on the turbidity value.On this basis, the monomer concentration,monomer ratio and initiator dosage were selected as independent variables to establish the response surface model.The results showed that when the monomer concentration was 27.317wt%, initiator dosage was 0.577wt%,n(AM):n(AA) was 3.015, the turbidity value could reach 9.959 NTU.The experimental verification showed that the actual turbidity value was close to the predicted value of the model.
c)The flocculation test of APAM showed that the water demand of the cement paste mixed with 1wt%APAM was only increased by 12%.With the increase of APAM content, the fluidity of the cement paste increased first and then decreased, and the underwater anti-dispersity gradually improved.When the content of APAM was 1% of the mass of cement, it can meet the two major performance indexes of underwater self-leveling and anti-dispersity at the same time.
Conflict of interest
All authors declare that there are no competing interests.
杂志排行

Journal of Wuhan University of Technology(Materials Science Edition)的其它文章
- Enhanced Electrochemical Performances of Ni Doped Cr8O21 Cathode Materials for Lithium-ion Batteries
- Design on the Prestressed Concrete Frame Beam-column
- Experimental Behavior of Recycled Aggregate Concrete Filled Steel Tubular Columns
- Impact-abrasive Wear Behavior of ZTA and NbC Reinforced Fe60 Matrix Composites
- Synthesis and Characterization of Hollow Strontium Carbonate Pompons by Composite Soft Template Method
- Preparation of Co/CoOx Derived from a Lowtemperature Etching of ZIF-67 for Oxygen Reduction and Oxygen Evolution Catalytic Reaction