Energy-dispersive X-ray Spectroscopy for the Quantitative Analysis of Pyrite Thin Specimens
2024-01-03LUOTingtingGUOYiDENGZhaoLIUXiaoqingSUNZhenyaQIYanyuanYANGMeijun
LUO Tingting, GUO Yi, DENG Zhao, LIU Xiaoqing, SUN Zhenya,QI Yanyuan*, YANG Meijun,2*
(1. Center for Materials Research and Analysis Testing, Wuhan University of Technology, Wuhan 430070, China; 2. State Key Laboratory of Advanced Technology for Materials Synthesis and Processing, Wuhan University of Technology, Wuhan 430070, Wuhan)
Abstract: To explore ways to improve the accuracy of quantitative analysis of samples in the micrometer to nanometer range of magnitudes, we adopted analytical transmission electron microscopy (AEM/EDS)for qualitative and quantitative analysis of pyrite materials.Additionally, the k factor of pyrite is calculated experimentally.To develop an appropriate non-standard quantitative analysis model for pyrite materials, the experimentally calculated k factor is compared with that estimated from the non-standard quantitative analytical model of the instrument software.The experimental findings demonstrate that the EDS attached to a TEM can be employed for precise quantitative analysis of micro- and nanoscale regions of pyrite materials.Furthermore,it serves as a reference for improving the results of the EDS quantitative analysis of other sulfides.
Key words: analytical transmission electron microscopy (AEM); energy dispersive X-ray spectroscopy(EDS); pyrite; thin specimen; quantitative analysis
1 Introduction
Pyrite is the most ubiquitous and widely distributed sulfide mineral in the earth’s crust.It is commonly associated with galena, sphalerite,chalcopyrite, and other minerals of economic value[1-3].Additionally, most sulfide minerals are extensively utilized in semiconductor materials, electrode materials,catalytic materials, solar cells, and other fields[4-9].Among them, the pyrite materials in transition metal sulfides (AxSy, where A represents Mo, Mn, Cu, Fe,Sn, and Co) stand out due to their high theoretical capacity, unique physicochemical characteristics, ease of production, and environmental friendliness[9-15].As an electrode material, FeS2has sparked significant research interest since its theoretical capacity was reported to be 890 m·Ahg-1[16].Furthermore, studies have demonstrated that FeS2@C nanocomposites having a thickness of 40 nm exhibit the best catalytic behavior with a current density of 10 mA·cm-2for 150 h at an overpotential of 195 mV.The various crystal structures and compositions of pyrite considerably influence the properties of the material[17,18].The composition and structure of materials are key factors in determining material properties.It is crucial to improve the accuracy of the quantitative analysis in the nano-micro zone of sulfides.
Analytical transmission electron microscopy(AEM) is a large scientific analytical instrument that can directly observe the microscopic regions of materials.AEM is usually utilized to obtain information on the morphology, microstructure, and chemical composition of materials at the micron, nanometer,and even atomic scales[19-21].Transmission electron microscopy (TEM) combined with energy-dispersive X-ray spectroscopy (EDS) is an essential experiment technique used to assess elemental distribution and elemental quantitative analysis in localized regions.High-energy electrons incident on the sample are employed by an EDS spectrometer to excite and ionize the electrons in the inner layer of the atom.The atom subsequently generates characteristic X-rays while returning to the ground state.The EDS spectrometer collects characteristic X-rays from the sample and qualitatively identifies the elements contained in the sample based on the characteristic energy of the spectral peak.The quantitative analysis program for the thin specimen is run by the data processing system, and the percentage content of each element is determined according to its intensity value.Moreover, semiquantitative and quantitative analyses of each element are performed.TEM equipped with EDS typically has high confidence (the atomic percentage must be larger than 1%) and is used for the analysis of elements with a Z number of 11 or above.
Currently, the penetration rate of analytical transmission electron microscopy (AEM) is relatively high.Transmission electron microscope (TEM) and X-ray energy dispersive spectroscopy (EDS) are the main tools for the analysis of nanomaterials, the combination of which has been extensively employed in the quantitative analysis of various materials on the micron-to-nanometer scale[21-24].EDS is primarily used for qualitative analysis, point, line, and plane distribution of elements, and semi-quantitative analysis without standard specimen.However, the accurate quantitative analysis of microregions, particularly,nanoscale microregions, is quite challenging.To date,the non-standard element analysis software of EDS has been mainly adopted for semi-quantitative or quantitative analyses.However, even for the semiquantitative results, there has been no reliable and simple method to evaluate the accuracy of the results.Different calculation models have a great impact on the analysis results, particularly, since there are different quantitative calculation models in the EDS analysis software, and these calculation models (such as the selection of factor parameters) are also different across manufacturers.This is not sufficiently focused during the electron microscopy analysis in the laboratory.In contrast to the common EDS analysis of massive samples using a scanning electron microscope (SEM)and electron probe (EPMA), the EDS analysis of thin specimens using TEM improves the capability of AEM/EDS nanoscale component analysis and enhances the qualitative, semi-quantitative, and quantitative AEM/EDS component analysis of nanomaterials.
In this study, we employed the American EDAX Elite T super X-ray spectrometer equipped with a JEM-2100F transmission electron microscope as the analytical tool.The experimental technique for determining thekfactor of sulfide was examined using a pyrite specimen.Furthermore, the selection of an appropriate EDS software quantitative model to improve the accuracy of EDS nanoscale analysis of thin sulfide samples is crucial for the synthesis and accurate characterization of sulfide nanomaterials with various compositions.
2 Experimental
2.1 Raw materials and characterization
Single-crystal pyrite was used as the experimental specimen.The chemical constituents of the pyrite particles were analyzed qualitatively and quantitatively by using the Prodigy 7 inductively coupled plasma mass spectrometry (ICP-AES).The micro components of the particles were quantitatively analyzed utilizing the JXA-8230 electron probe microanalyzer (EPMA)coupled with the INCA X-Act energy-dispersive spectroscopy(EDS).The EDS data was acquired by the electro-refrigerated X-ray spectrometer (70 mm2,EDAX Elite T super) attached to a field emission highresolution transmission electron microscope (JEM-2100F), and the operating voltage was 200 kV.
2.2 Test scheme
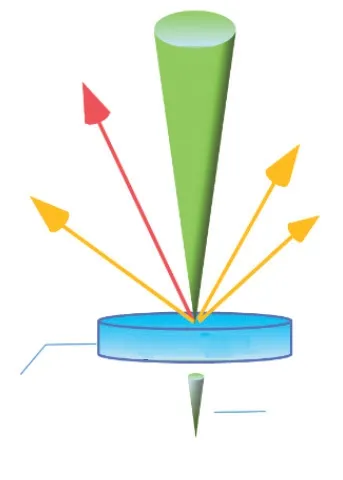
Fig.1 A schematic diagram of signals generated by electron irradiation of the specimen
The interaction of electrons with the sample excites various electronic signals, such as characteristic X-ray, secondary electrons, backscattered electrons,transmitted electrons, and cathodoluminescence, as shown in Fig.1.By bombarding the surface of the specimen with an electron beam under a vacuum chamber, the thin specimen is stimulated to emit characteristic X-rays.According to the wavelength of the characteristic X-rays, the elements of B-U in the periodic table can be qualitatively and semiquantitatively analyzed by X-ray energy dispersive spectroscopy (EDS).For this purpose, electron probe microanalyzer (EPMA) or transmission electron microscopes (TEM) are equipped with an energydispersive system for quantitative electron probe X-ray microanalysis[25].
The pyrite specimen is initially composed of yellow metallic particles.The chemical components and homogeneity of the pyrite particles were analyzed by an inductively coupled plasma mass spectrometer(ICP-AES) and an electron probe microanalyzer(EPMA), respectively, which helped to identify the types of major elements and composition.We adopt the results obtained by ICP-AES as the nominal value of the sample.
The pyrite particles were manually ground in anhydrous ethanol.A small amount of the ground sample was taken and ultrasonically dispersed for 5-10 min using anhydrous ethanol as the dispersing agent.The specimens were prepared on the copper grid,and the copper grid was inserted in the transmission electron microscope.For the qualitative and quantitative analysis of EDS elements, an appropriate thin region of pyrite specimen was selected.Based on the EDS spectra of various regions, the back and bottom of the spectra were manually deducted.The integral area of the K series ray for Fe and S elements in each EDS spectra was calculated, and the intensity of the peak IFeand ISwere determined.We adopted the Cliff-Lorimer equation to calculate the kFeS2factor values and the average kFeS2factor.Then, the quantitative results were compared with those of the corresponding EDS quantitative models in the software of the instrument.
3 Results and discussion
Pyrite reference specimens were adopted in this experiment for quantitative analysis.First, Prodigy 7 inductively coupled plasma mass spectrometry was utilized for the qualitative and quantitative analysis of its chemical components.The results are shown in Table 1.
The quantitative analysis of the specimen was measured by JXA-8230 electron probe microanalyzer(EPMA) coupled with an INCA X-Act energy dispersive spectroscopy (EDS).Fig.2 illustrates the backscattered electron image of the specimen.As shown in Fig.2, there is no clear difference in the contrast, implying that the specimen is relatively uniform and no significant second phase is evident.Eight microregions with different coordinate positions were randomly selected in this region for qualitative and quantitative analysis.Table 2 displays the EDS quantification results for the specimen analyzed by EPMA.The results reveal that Fe and S elements are evenly distributed in different microzones.The average mass percentages of Fe and S in the eight microzones collected are 46.69wt% and 53.31wt%, respectively.These results agree with those measured by the inductively coupled plasma mass spectrometry (ICP)in Table 1, demonstrating that the composition of the pyrite specimen in the micro zones is homogeneous.
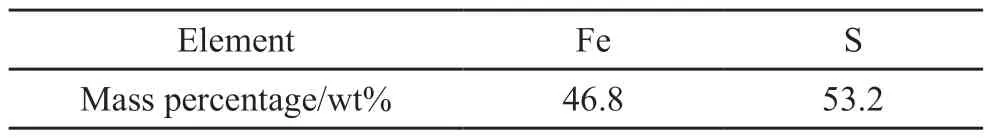
Table 1 Mass percentage of Fe and S elements measured by an inductively coupled plasma mass spectrometry

Fig.2 The backscattered electron image of the specimen analyzed by EPMA
The results reveal that Fe and S are the major elements in the pyrite reference specimen (Table 2).The chemical composition content determined using the Prodigy 7 full-spectrum direct-reading plasma emission spectrometer is considered the nominal value.The nominal value of the pyrite specimen is as follows:Fe and S have mass percentages of 46.8wt% and 53.2wt%, respectively.
Then, the copper grid attached specimen was inserted in the transmission electron microscope.An appropriate thin area in the copper grid was selected for the qualitative and quantitative analysis of elements by EDS.
In the bright field mode of TEM, a relatively flat,independently dispersed, and transparent thin specimen was selected in the field of view.The geometry of the electron beam-sample detector affects the acquisition of EDS spectral lines.Therefore, to minimize the stray effect, it must be ensured to keep the specimen tilted at 0°.A wedge-shaped specimen must be oriented such that the thinner part is aligned with the detector to reduce the absorption of X-ray by the specimen.If the region of interest is close to the strong two-beam dynamic diffraction condition, the specimen must be tilted slightly toward the kinematic condition[24-26].
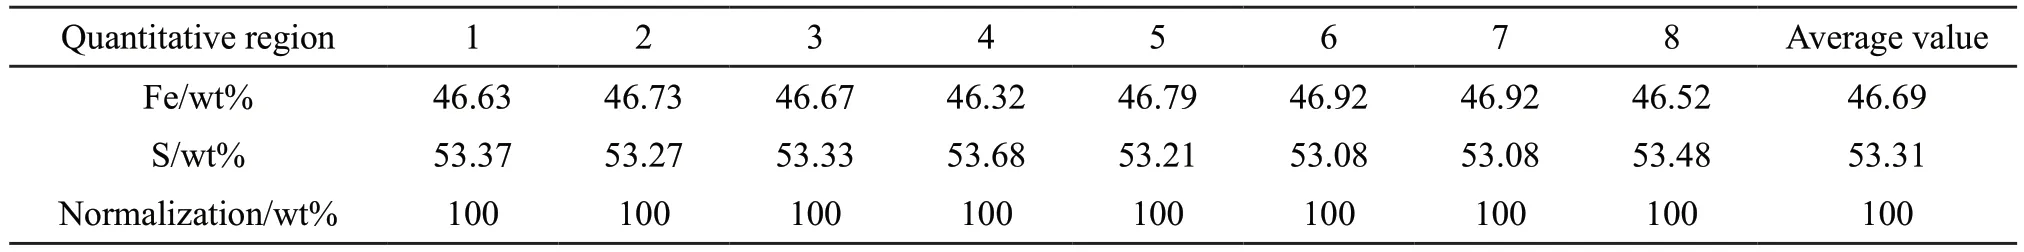
Table 2 EDS quantification results for the specimen
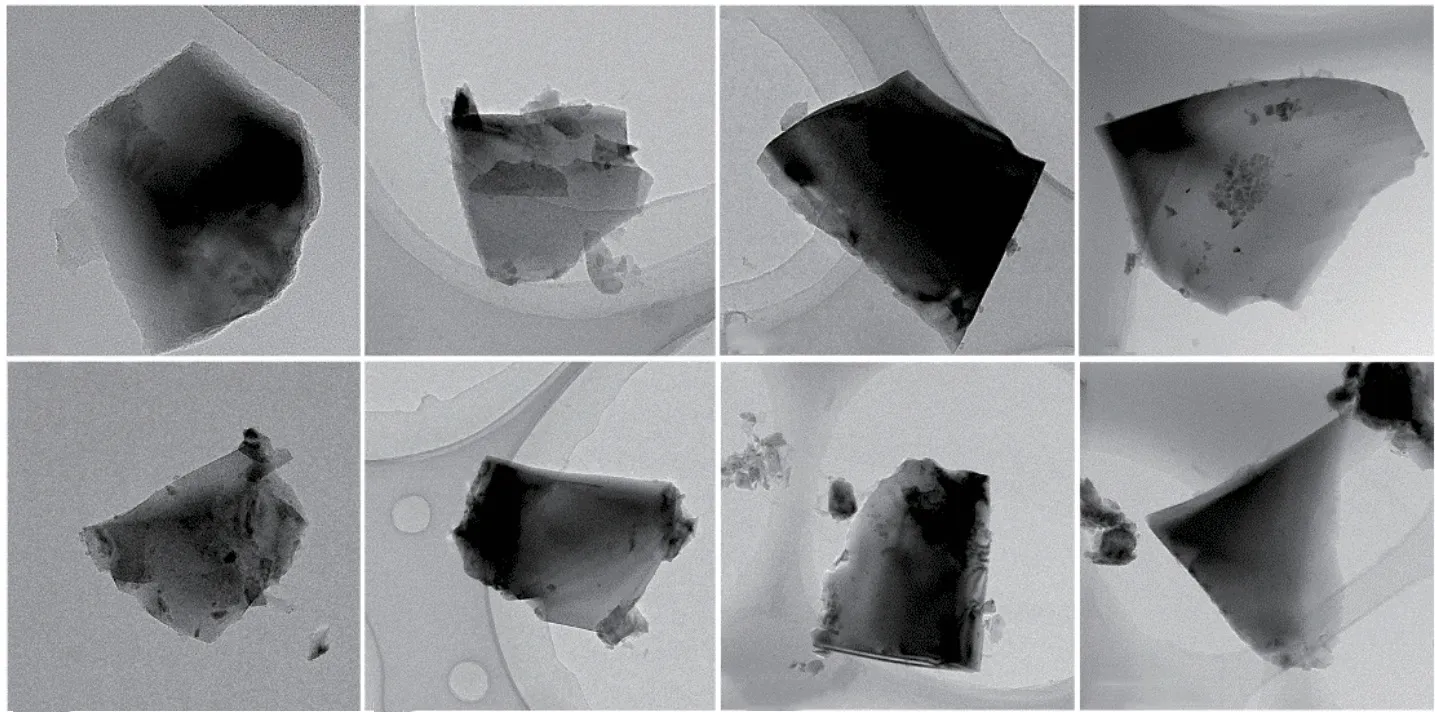
Fig.3 TEM images of thin specimens in different regions
Moreover, the X-ray emission process is affected by the detection diameter, current, and convergence angle.The current of the primary condenser C1, known as spot size control, determines the probe size, and the convergence angle is determined by the size of the secondary condenser C2, which also impacts the probe size.Therefore, the appropriate spot or current of the electron beam and analysis time must be adjusted at the selected working voltage of 200 kV.This ensures that the X-ray intensities of the elements to be measured in the sample meet acceptable counting and statistical requirements and are neither too high nor too low.In TEM mode, the overall count rate typically ranges from 10,000 to 50,000 cps.other spectral peaks characteristic of impurity elements were observed, demonstrating the high purity of the pyrite specimen.These results excluded the C and Cu elements at the back and bottom of the copper grid.
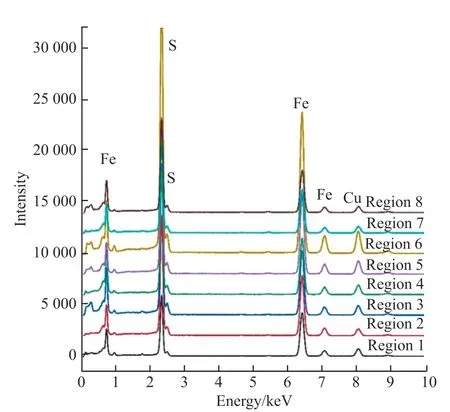
Fig.4 EDS spectra of thin specimens in different regions
The X-ray quantitative analysis in electron beam instruments (such as scanning electron microscopy and electron probes) primarily focuses on bulk samples that can fully absorb the electron beam,unlike the thin specimens through which the electron beam can penetrate.However, the effects of X-ray absorption and X-ray fluorescence are not considered in the quantitative analysis of thin specimens that are transparent under the electron beam.Only the atomic numberZis corrected, and the amount of analysis is significantly reduced, which facilitates better spatial resolution.In this experiment, the bright field mode of TEM was utilized to randomly collect the EDS data of eight thin specimens on the copper grid.The integrated areas of the K system ray spectrum peaks of Fe and S elements were calculated after deducting the background manually.Moreover, the peak intensities,IFeandIS, were determined.The value of thekFeS2factor[26]was calculated as per the Cliff-Lorimer equation[24,25]:
where,CA,CBare the mass percentage of elements A and B;IA,IBthe characteristic strength of elements A and B measured above the background;kABthe cliff-Lorimer factor.
kABrepresents the sensitivity factor, and thekfactor varies with the TEM/EDS system and the voltage.The factorkABis related only to the atomic number correction factor (Z) in the Castaing ratio equation since the absorption and fluorescence effects are ignored.The Cliff-Lorimer equation is the basis of quantitative analyses of AEM.In the experiment, the intensitiesIAandIBof the spectral peaks of elements A and B are determined by deducting the background and then integrating the count of the peaks of each element.As presented in Table 3, the average value of thekFefactor calculated based on the EDS spectra of the eight microregions after artificially deducting the back and bottom is 1.31.
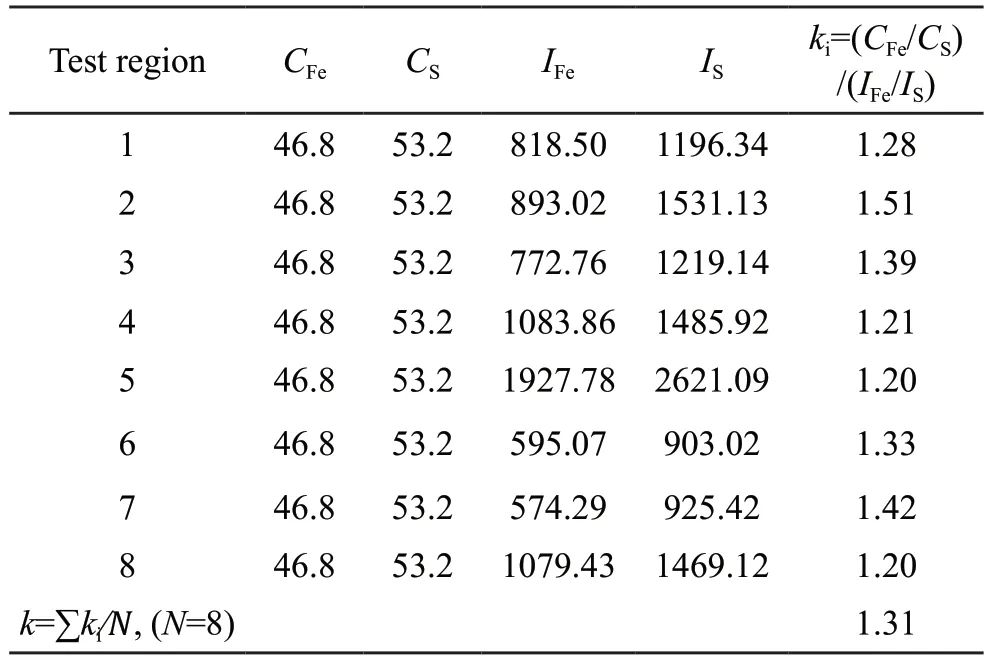
Table 3 The k factor of element Fe
Additionally, William and Goldsteinet alanalyzed the calculation ofk-factor expressions from the first principles[27]:
where,TA,TBare the atomic weights of elements A and B;QA,QBthe ionization cross sections of elements A and B;ωA,ωBthe fluorescence effect of elements A and B;athe relative transition efficiency;kABthe cliff-Lorimer factor.
Eq.(2) demonstrates that the main factor affecting the k value is acceleration voltage, which impacts the ionization cross sectionQof elements.The atomic number affects the value ofω,T, anda.Moreover,different peak integrals also impact the value ofa.Although thek-value calculation method is simple, it cannot accurately measure certain parameters, such as the optimalQvalue of elements.It is more accurate to calculate thekfactor using the K line than the L line since theQvalue of the L line is more speculative.The accurate determination of thekfactor is impossible due to the uncertainty in theQvalue and detector parameters.Hence, to ensure the accuracy ofkvalues calculated by the software, the EDS calculation software of AEM must preset the values of all the parameters in the aforementioned formula and then verify them with known samples or standard samples.However, the presets of software packages offered by various instrument manufacturers may vary.
The currently available AEM/EDS quantitative analysis models include Brown, Powell, Zaluzec,Brown-Powell, Schreiber-Wims,etc[25].The EDS quantitative analysis software mostly combines theoretical calculations with empirical parameters for calculating thek-factor.The element mass percentage concentration in the sample is determined by normalization.Different EDS quantitative analysis models utilize different optimal values of physical parameters.Besides, the performance of EDS detectors is considered.Consequently, thekfactors calculated by these models differ.Sincekfactors are nonstandard, highly sensitive factors, it is necessary to utilize the same standard specimens, acceleration voltages, detector configurations, peak integration, and background deduction methods to obtain the same k factor on different AEMs.When a quick analysis is required and the accuracy of quantitative detection is not high, there is no appropriate standard specimen,and a non-stoichiometric phase exists in the specimen,the software calculation model can be utilized to select the appropriatekfactor.
The EDS spectral data of the eight thin specimens in microregions collected by TEM in the bright field mode are quantitatively analyzed by TEM in conjunction with the non-standard element analysis software of the EDAX spectrometer.Table 4 displays the results.A relatively large error (> 5%) is observed between the quantitative results and nominal valueswhen the Schreiber-Wims or Zaluzec model is used for the quantitative analysis of elements.When Brown,Powell, and Brown-Powell models are employed for quantitative analysis, the error between quantitative results and nominal values is less than 5%.The mean value and nominal value of the obtained results are the closest when applying the Brown model for quantitative analysis.ThekFeset by the model software is 1.29,which is quite close to thekFefactor (1.31) calculated based on the Cliff-Lorimer equation after artificially deducting the back and bottom.The results indicate that the Brown model is more accurate when the nonstandard element analysis software of the instrument is used for quantitative analysis of thin specimens of pyrite.Furthermore, the Brown model is suitable for the analysis of thin specimens of iron sulfide and other disulfide compounds with non-stoichiometric ratios.
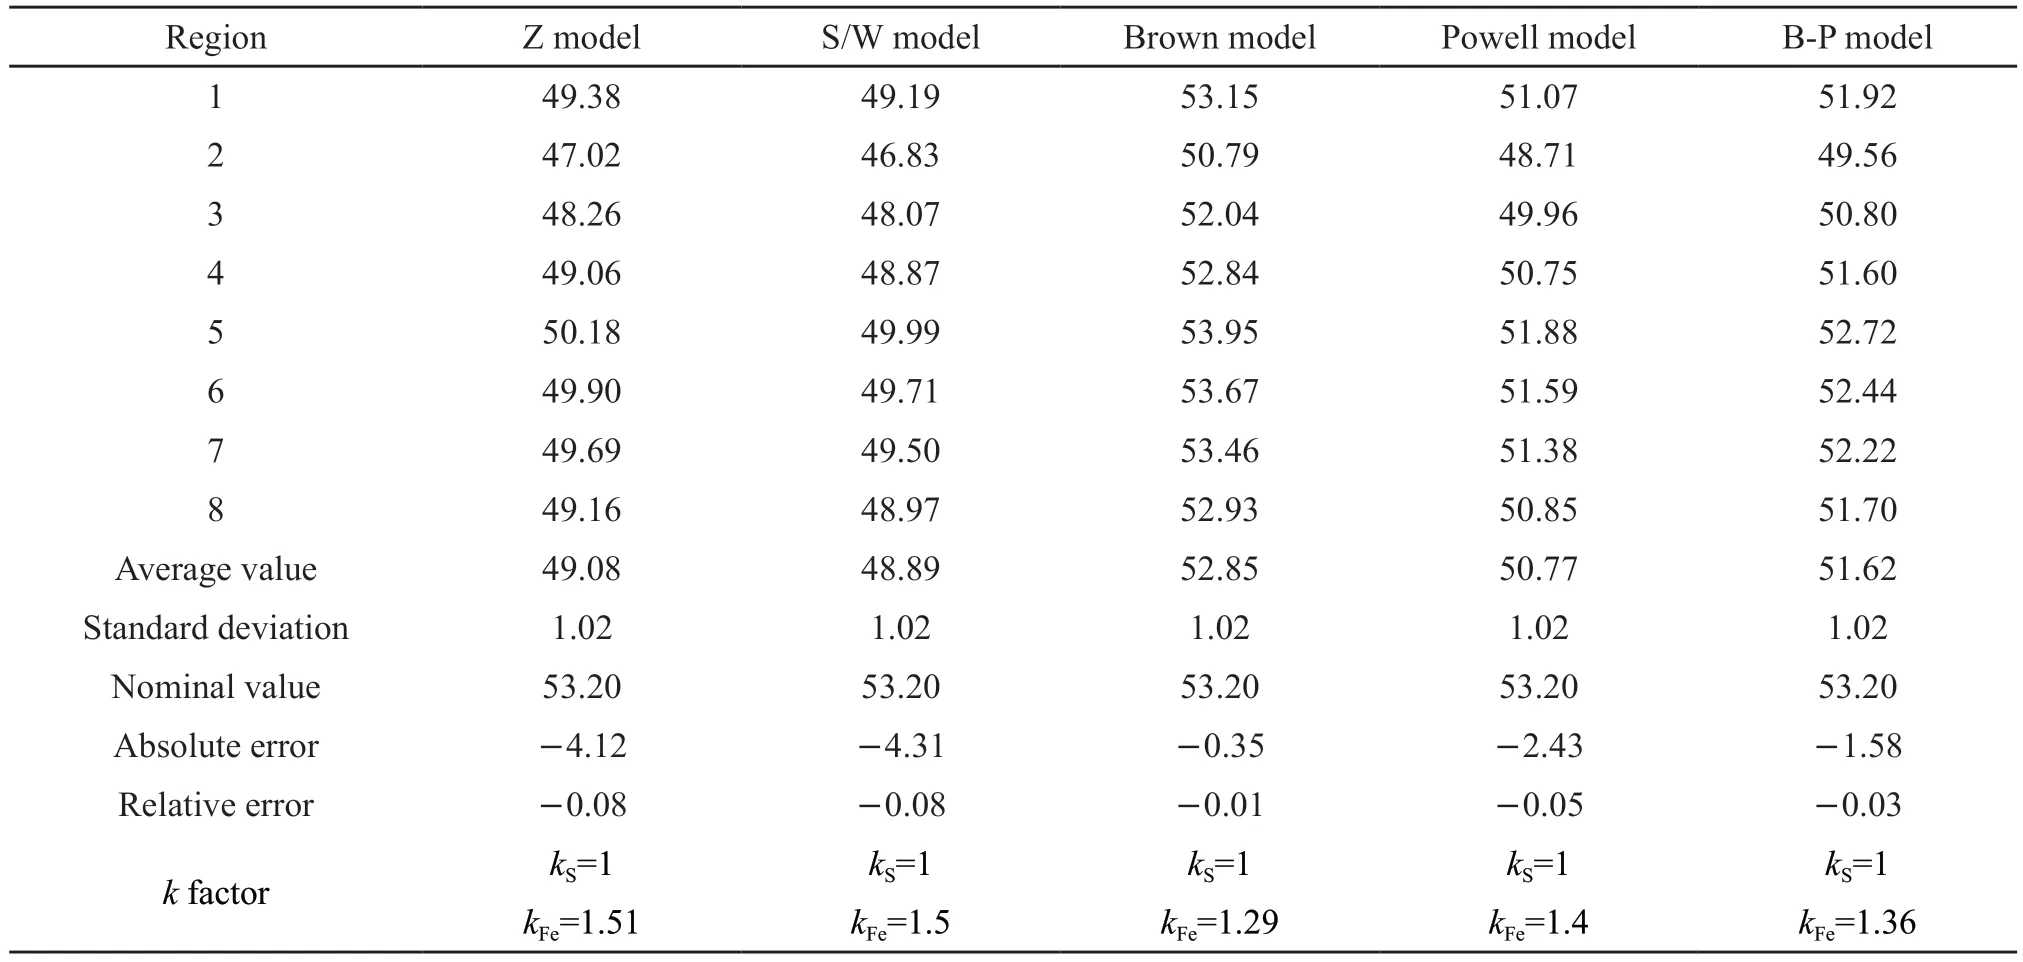
Table 4 Quantitative results of different quantitative analysis models and different k factor values using a transmission electron microscope (TEM) plus EDAX spectrometer software
4 Conclusions
Compared to electron probe and scanning electron microscopy, transmission electron microscopy has larger heterogeneity in microregions, which significantly affects the quantitative analysis results.Here, we adopted the pyrite material as a specimen for the quantitative analysis and applied thek-factor quantization correction method to analyze the quantitative results.Thekproportion factors of pyrite compounds were calculated experimentally and the calculated averagekFeS2factors were compared with the corresponding quantitative results of different EDS quantitative models in the software of the instrument without standard specimens.According to the results,the Brown model is found to be more accurate in quantitative analysis.The experimental approach of calculating the proportion factorkfor chalcogenide compounds is useful in selecting the appropriate EDS software quantitative model, thereby improving the accuracy of EDS nanoscale analysis of thin sulfide specimens.This method is anticipated to be more extensively applied in the microscale quantitative analysis of binary chalcogenide nanomaterials, as it is vital for the synthesis and accurate characterization of sulfide nanomaterials with different compositions.
Conflict of interest
All authors declare that there are no competing interests.
杂志排行
Journal of Wuhan University of Technology(Materials Science Edition)的其它文章
- Flow Characteristics Analysis of TC18 Titanium Alloy during Hot Deformation Based on Phase Transformation
- Effect of Hydrated Calcium Aluminate Cement on the Chloride Immobilization of Portland Cement Paste
- Expansion Performance and Microstructure of High-performance Concrete using Differently Scaled MgO Agents and Mineral Powder
- Effect of Curing Age on Tensile Properties of Fly Ash Based Engineered Geopolymer Composites (FA-EGC) by Uniaxial Tensile Test and Ultrasonic Pulse Velocity Method
- A Fiber Optic Sensor for the Simultaneous Measurement of Dual-parameter Based on Hydrogelimmobilized Enzyme Complex
- Bioprocess-inspired Actin Biomineralized Hematite Mesocrystals for Energy Storage