Thermal Stability and Electrochemical Properties of Separators for Lithium-ion Batteries
2024-01-03YIGuangyuanXUCaiyunLIUWanQUDeyuWANGHongbingTANGHaolin
YI Guangyuan, XU Caiyun, LIU Wan, QU Deyu*, WANG Hongbing, TANG Haolin*
(1. State Key Laboratory of Advanced Technology for Materials Synthesis and Processing, Wuhan University of Technology, Wuhan 430070,China; 2. Department of Chemistry, Wuhan University of Technology, Wuhan 430070, China; 3. Wuhan Huiqiang New Energy Materials Technology Co., Ltd, Wuhan 430070, China)
Abstract: The mechanical properties, contact angle, thermomechanical and electrochemical properties of PE, PVDF, and ceramic separators were compared.The experimental results show that the PE separator has the largest porosity, the PVDF separator has the best mechanical properties, wettability, and heat resistance.Three kinds of separators were assembled into lithium-ion batteries for electrochemical tests.Among them, the PE separator has the best rate performance, and the ceramic separator has poor performance in charge-discharge cycles.At the same time, the PE and ceramic separators were tested with different amounts of electrolytes at room temperature and a high temperature, and it is found that the capacity of the PE separator is higher at room temperature, while the performance of the ceramic separator is better at a high temperature.The amount of electrolyte also has a certain influence on its electrochemical performance.
Key words: lithium-ion battery; separator; tensile strength; electrochemical performance
1 Introduction
Lithium-ion batteries (LIBs) play a vital role in the use of portable electronic devices (smartphones,digital cameras, laptops,etc.) and electric vehicles due to their high energy density, lightweight, long life, and environmental friendliness[1-4].In recent years, due to the rapid development and use of these devices, the demands for more efficient lithium-ion batteries have become more obvious[5,6].The separator, which acts as a physical barrier that separates the positive and negative electrodes from short circuits in the battery,while it must be presented in small and compact batteries, should be as thin as possible to reduce battery resistance and be highly porous to aid ion transport[7-10].Furthermore, the separator should remain mechanically, thermally, and electrochemically stable within the operating temperature range of the battery[11,12].At present, the most widely used commercially are polyolefin membranes, as well as non-woven membranes and ceramic coated membranes.Polyolefin separators have good mechanical properties and stable electrochemical properties and are more reliable for use in lithium-ion batteries[13].The ceramic coating separator can improve its thermal stability and mechanical strength due to the inorganic coating, which can improve the electrochemical performance of the battery to a certain extent[14].
In this study, three lithium-ion battery separators were taken as the research object to explore the thermal stability and the electrochemical performance after being assembled into LIBs, and to analyze their inherent structure-activity relationship.
2 Experimental
2.1 Raw materials and instruments
Polyethylene separator (PE), polyvinylidene fluoride separator (PVDF), ceramic separator (C) was used in this study.GB-A120 glove box, produced by Braun Company, USA.MSK-110 battery manual sealing machine, YP type tablet press machine was obtained from Shenzhen Kejing Co., Ltd.CT2001A battery testing system were purchased from Wuhan Product of Blue Electric Co., Ltd.CHI 660E Electrochemical Workstation was obtained Shanghai Chenhua Instrument Co., Ltd.Positive and negative materials include active material, conductive agent, binder were provided from BRT Co., Ltd.Electrolytes were prepared by Suzhou Duoduo Chemical Technology Co., Ltd.
2.2 Preparation and assembly of batteries
2.2.1 Preparation of electrode sheets
(a) Ternary NCM523 electrode sheet
Using N-methyl pyrrolidone (NMP) as the solvent, NCM523, conductive agent Super P, and polyvinylidene fluoride (PVDF) were mixed in a mass ratio of 8:1:1, zirconia beads were added, and then a micro-shaker was used for grinding, grind 4 times for 3 min each time to prepare a uniform slurry.Then, the uniform slurry was evenly coated on the aluminum foil,and then dried in a vacuum drying oven at 100 ℃ for 24 h.After drying, it was pressed and cut into electrode sheets.The area loading of NCM523 was 1-1.5 mg·cm-1.
(b) Graphite electrode sheet
Graphite, conductive agent Super P, sodium carboxymethyl cellulose (CMC), and styrene-butadiene rubber (SBR) were mixed in a mass ratio of 8:1:0.5:0.5,added with zirconia beads, and then ground using a micro-shaker.For 3 min, grind 4 times to prepare a uniform slurry.Then, the uniform slurry was evenly coated on the copper foil, placed in a blast drying oven for 1 h at 80 ℃ to initially remove moisture, and then dried in a vacuum drying oven at 100 ℃ for 24 h.The post-pressing sheet is cut into electrode sheets.The area loading of graphite in this study was 1-1.5 mg·cm-1.
(c) Lithium-sulfur composite electrode sheet
The sulfur powder and Ketjen black (EC-600JD)with a mass ratio of 7:2 were fully grounded until the yellow sulfur powder was not visible.Then, hot melting was performed by holding the temperature at 155 ℃for 12 h to make the sulfur powder enter the pores of the Ketjen black, and the sulfur carbon composite material (S/C) was obtained.The S/C and carbon nanotube slurry were mixed accurately according to the mass ratio of 7:3, zirconia beads were added, and then the micro-shaker was used for grinding, 3 min each time, and the grinding was performed 4 times.Then, the uniform slurry was evenly coated on the carbon-coated aluminum foil, which was first air-dried for 12 h, and then vacuum-dried at 50 ℃ for 24 h.Finally, a microtome was used to cut electrode sheets with a diameter of 20 mm and the loading of active material is controlled by adjusting the thickness of the electrode.In this study,the loading of sulfur active material was 1.5-3.5 mg·cm-1.
2.2.2 Assembly of the battery(a) Ternary half battery
The prepared ternary electrode sheet was used as the positive electrode, the lithium foil was used as the negative electrode, and 1 M LiPF6(EC/DMC:v/v=1/1) was used as the electrolyte.A button cell of type CR2032 was made.The Assembly of the coin cell was done entirely in a glove box filled with an argon atmosphere.
(b) Graphite half cell
The prepared graphite electrode was used as the positive electrode, the lithium foil was used as the negative electrode, and 1 M LiPF6(EC/DMC:v/v=1/1) was used as the electrolyte.A button cell of type CR2032 was made.
(c) Ternary/graphite full battery
The prepared graphite electrode was used as the negative electrode, the ternary electrode sheet was used as the positive electrode, and 1 M LiPF6(EC/DMC:v/v=1/1) was used as the electrolyte.A button cell of type CR2032 was made.
(d) Lithium-sulfur battery
The prepared lithium-sulfur electrode was used as the positive electrode sheet, and the lithium foil was used as the negative electrode.The electrolyte 1 mol· L-1LiTFSI (DOL/DME:v/v=1/1) with 2%LiNO3was used as the electrolyte.
2.3 Testing and Characterization
Mechanical property test: We cut the PE, PVDF,and ceramic separator samples into a size of 100-20 mm (marked horizontal and vertical), and used a thermomechanical analyzer (TMA) to test room temperature to 200 ℃.The stress was measured from distance,and the strain was measured by fixed tensile force, after stretching, both are measured after 11 MPa (30 days),and 20 k is the magnification.
Electrochemical test: After the battery is assembled, it needs to rest for 6 hours, and then use the electrochemical workstation and the CT2001A battery testing system to test and analyze the performances of the prepared LIBs.Among them, the charging and discharging voltage range of the lithium-sulfur battery is 1.7-2.8 V, the charging and discharging voltage range of the full battery is 1.8-4 V, the charging and discharging voltage range of the ternary half-cell is 3-4.3 V, and the charging and discharging voltage range of graphite half-cell is 0-1.5 V.The scan rate for cyclic voltammetry (CV) testing was 0.5 mV·s-1.A small amount of electrolyte is 1-2 drops, an appropriate amount is 3 drops, and an excess is 5-6 drops (one drop is around 0.05-0.067 mL).In the battery test, the room temperature test is 30 ℃ and the high-temperature test is 50 ℃.
3 Results and discussion
3.1 Morphology and pore distribution analysis
Fig.1 shows the SEM images of PE, PVDF, and ceramic separators before and after stretching at 20 k,respectively.It can be seen from Figs.1(a)-1(d) that the PE separator is in the form of three-dimensional fibers,while the PVDF and ceramic separators are granular and have certain gaps.
Table 1 shows the porosity of PE, PVDF, and ceramic separators.It can be seen from the table that the porosity of the PE separator is the highest, at 62%,compared with that of the PVDF and ceramic separators, which are slightly lower, at 55% and 53%, respectively.
Fig.2 is the SEM images of the brittle fracture section of the PE and PVDF separators before and after 20 k transverse and longitudinal stretching.It can be seen from the figure that the two types of separators are of the multi-layer structure, with slight differences in the transverse and longitudinal sections, and the brittle fracture section changes to a certain extent after stretching, but the overall morphology is still not much different from that before stretching.
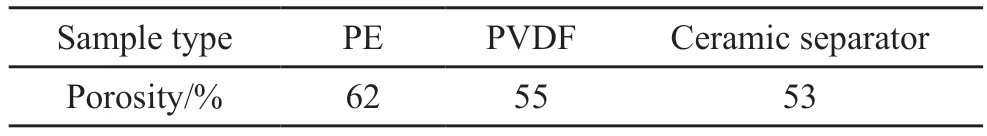
Table 1 Porosity of the three separators
3.2 Mechanical property analysis

Fig.1 SEM images of three kinds of separators before and after stretching at 20 k.PE: (a) and (d); PVDF: (b) and (e); Ceramic separator: (c)and (f)

Fig.2 SEM images of the brittle fracture section of the two separators before and after 20 k transverse and longitudinal stretching.PE: (a)Transverse, (b) Transversely stretched, (c) Longitudinally, and (d) Longitudinally stretched; PVDF: (e) Transverse, (f) After transverse stretching, (g) Longitudinal, and (h) After longitudinal stretching
Fig.3 shows the stress-strain curves of PE, PVDF,and ceramic separators.The experiments were carried out on the three types of separators, and the average values were 140.2, 165.7, and 138.8 MPa, among which the PVDF separator had the best mechanical properties.
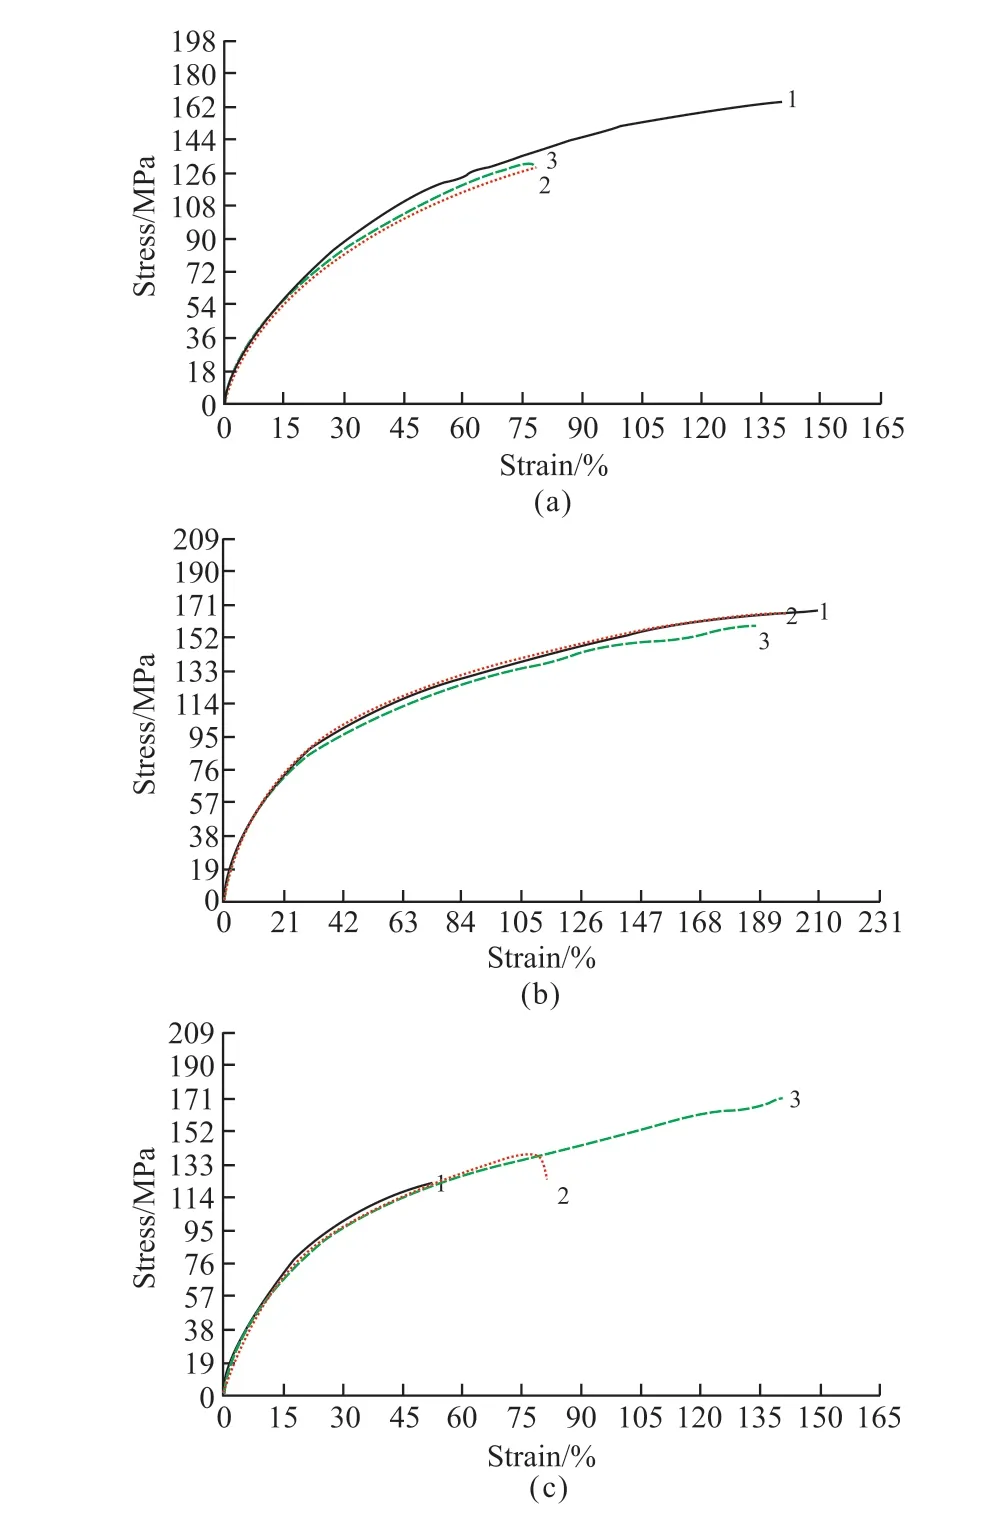
Fig.3 Stress-strain curves of three separators: (a) PE, (b) PVDF, and(c) Ceramic separator
3.3 Contact angle and wettability analysis
Fig.4 shows the contact angle changes of the three separators with the electrolyte.The contact angle values on the right side are 118.4o, 74.7o, and 82.3o,respectively.The PVDF separator was found to have better wettability.
3.4 Thermomechanical analysis
The thermomechanical properties of the three separators were tested to obtain their melt rupture temperatures.It can be seen from Fig.5 that the rupture temperatures are 133, 144, and 139 ℃, respectively,and the PVDF separator has the highest closed-cell temperature, indicative of the best heat resistance.
3.5 Electrochemical performance
We assembled three separators C, PE, and PVDF into ternary half-cell, graphite half-cell, lithium-sulfur batteries, and ternary/graphite full-cell batteries for electrochemical performance tests.
Fig.6 shows the comparison of the CV curves and the first cycle charge-discharge curves of three kinds of separators assembled into four kinds of batteries with a scan rate of 0.5 mV·s-1and 1 C, respectively.It can be seen from the CV curve of the lithium-sulfur battery in Fig.6(a) that the oxidation peaks of the C and PVDF separators are not much different, at around 2.2 V, while the peak positions of the PE separators are significantly different from other separators, with oxidation peaks and reduction peaks.The peak positions are consistent with the charge-discharge plateau potentials shown in Fig.6(b).In the CV curve of the full cell in Fig.6(c), the peaks position, as well as the integrated charges of three separators, matches well with the plateau potentials and capacities shown in Fig.6(d).From the CV curves of the ternary half-cell in Fig.6(e), the peak shapes of PE and PVDF are similar,and the charge-discharge plateaus are at 3.7 and 4.0 V,respectively.In the CV curve of the graphite half-cell in Fig.6(g), we can observe that the voltage range is 0-1.5 V, the peak shape of C is like that of the PE separator,and there are obvious peaks at 0.1 and 0.4 V, which agrees with the charge-discharge curves.
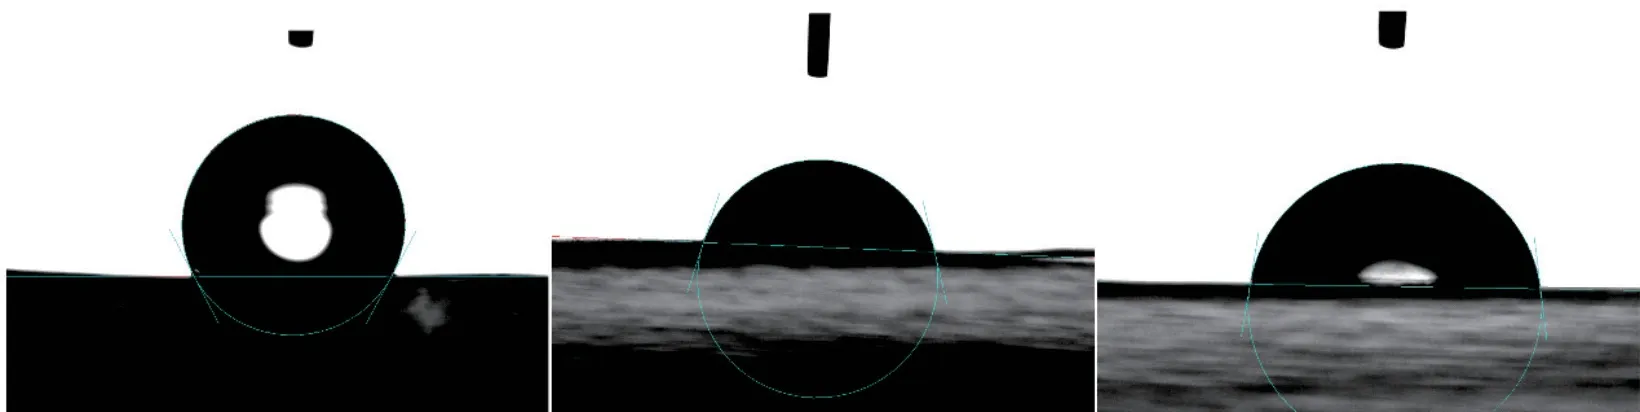
Fig.4 Contact angle test of three separators: (a) PE, (b) PVDF, and (c) ceramic separator
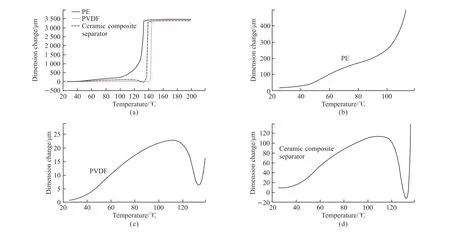
Fig.5 TMA curves of three kinds of separators: (a) PE, PVDF and ceramic separator, (b) PE, (c) PVDF, and (d) Ceramic separator
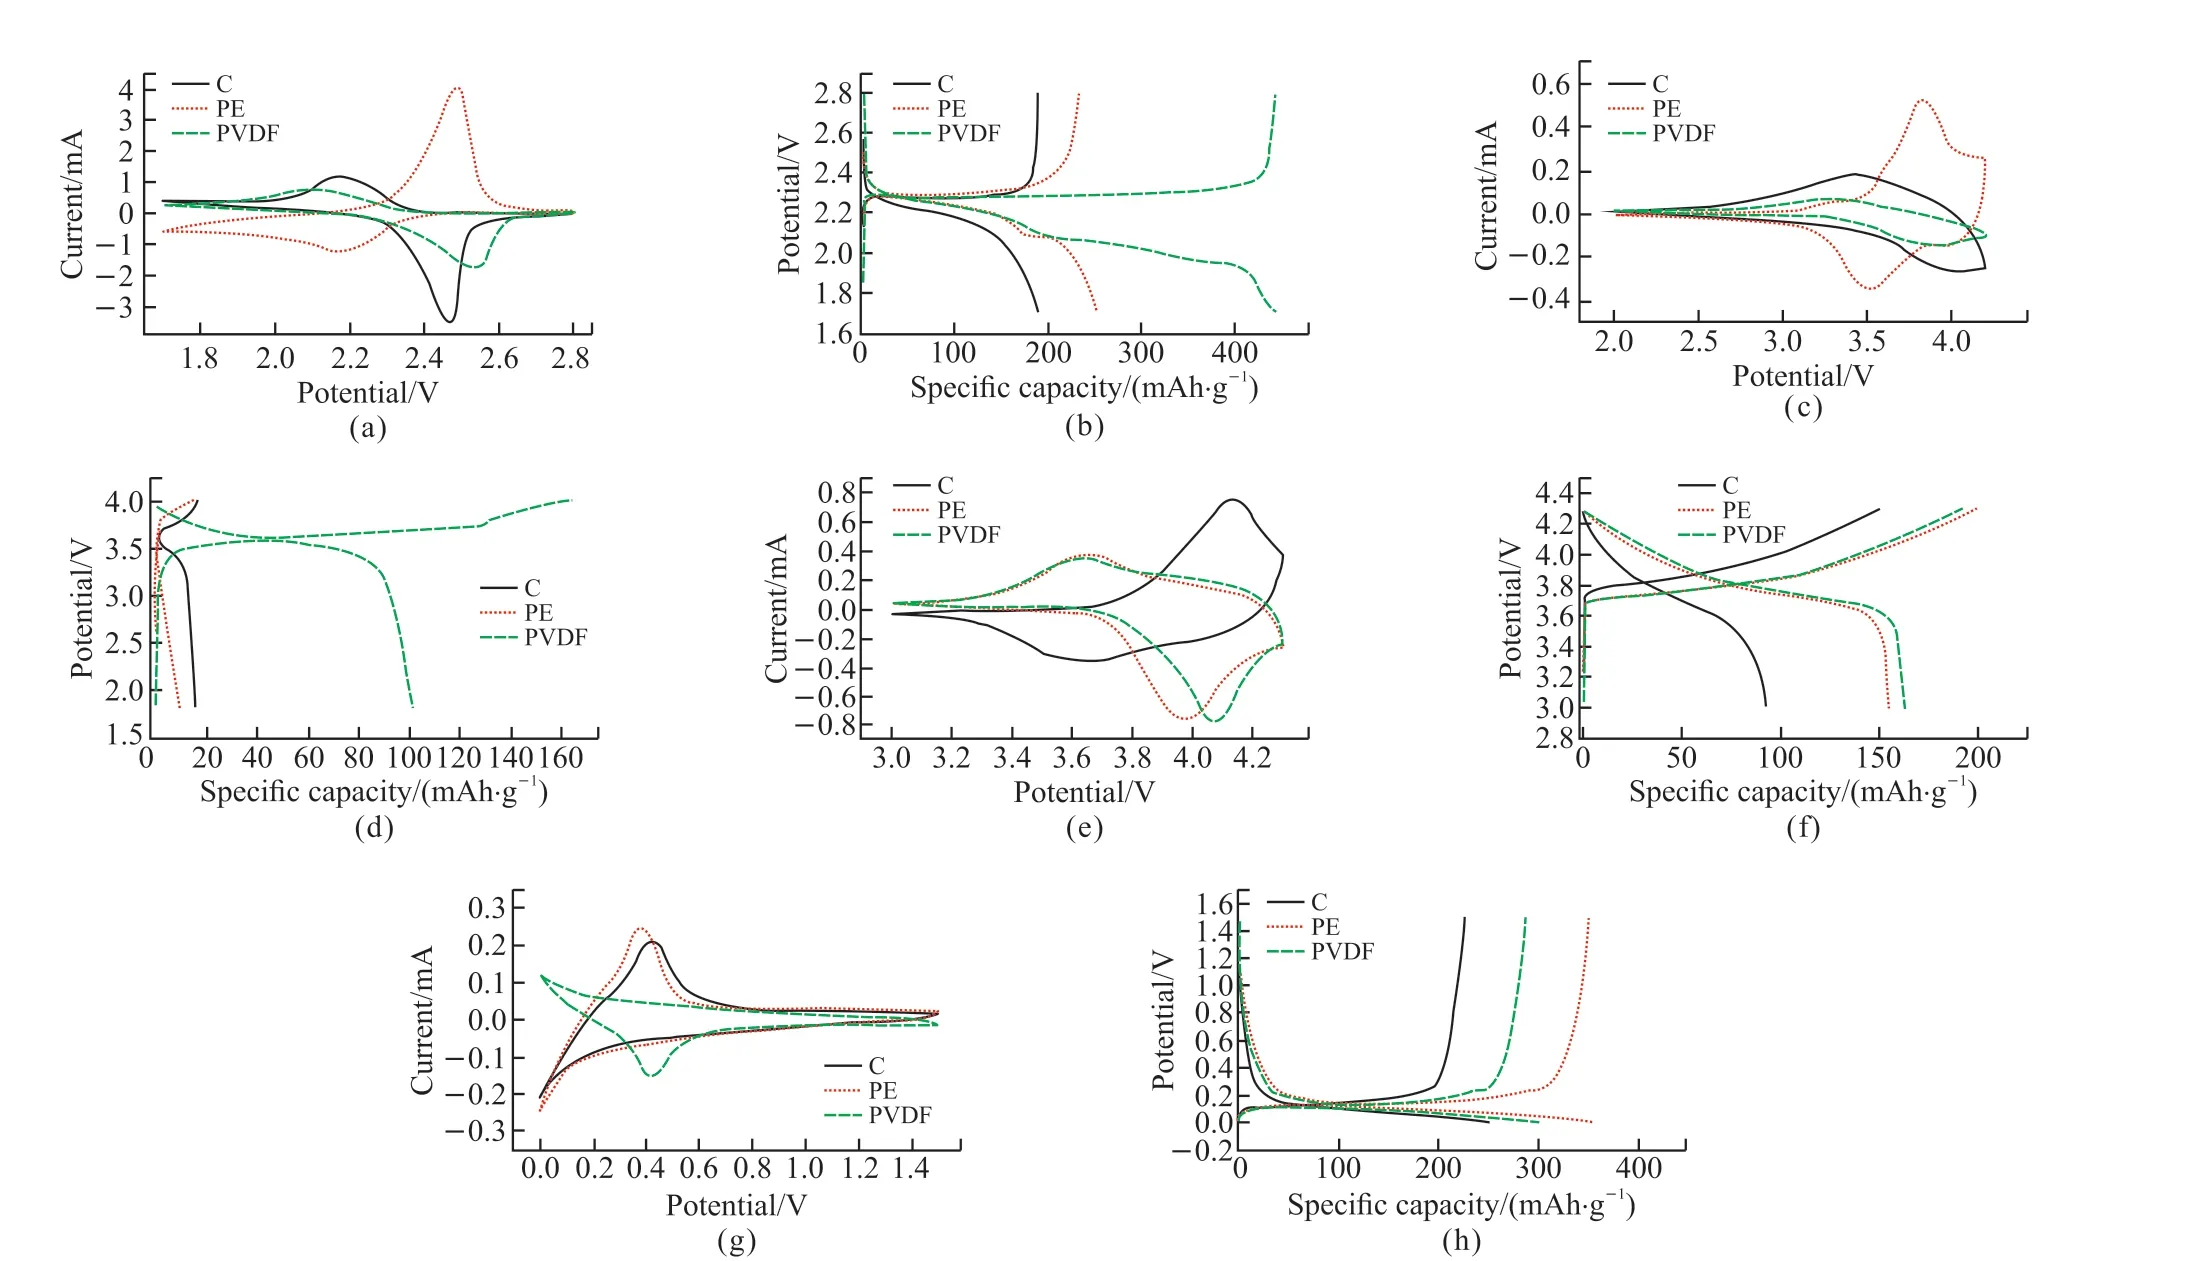
Fig.6 CV curves of three separators in (a) lithium-sulfur battery, (c) full battery, (e) ternary half-cell, (g) graphite half-cell (scan rate 0.5 mV·s-1).The first cycle charge-discharge curves of (b) lithium sulfur battery, (d) full battery, (f) ternary half-cell, and (h) graphite half-cell(under 1 C)
The rate performance of lithium-sulfur batteries assembled with three separators is also tested and the results are shown in Fig.7.The C separators in Fig.7(a)can provide capacities of 157.4, 113.5, 76.3, 65.1, and 60 mAh·g-1at current densities of 0.1, 0.2, 0.5, 1, and 2 C, respectively, and the capacity retention at 2 C is 38%, when the current density returns to 0.2 C, the capacity of 126.5 mAh·g-1can still be maintained, and the capacity retention rate is 111%.In Fig.7(b), the capacity retention of PVDF separator in the same rate range is 168.9, 90.3, 72.7, 59.9, and 49 mAh·g-1, and the capacity retention rate at 2 C is 29%.When the current density returns to 0.2 C, it can still maintain a capacity of 107.9 mAh·g-1, and the capacity retention rate is 119%.In Fig.7 (c), the capacities of the PE separators in this range are 216.3, 216.2, 219.3, 179.1, and 119.9 mAh·g-1, respectively, and the capacity retention rate at 2 C is 55%.When the current density returns to 0.2 C, the capacity of 265.4 mAh·g-1is maintained, and the capacity retention rate is 122%.Compared with the rate performance of the three types of separators, the rate performance of the PE separator is the best, and the rate performance of the PVDF separator is poor, but it is relatively stable.
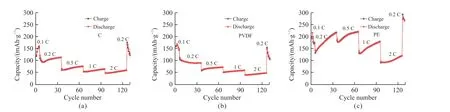
Fig.7 Rate performance curves of lithium-sulfur batteries with three separators: (a) C, (b) PVDF, and (c) PE
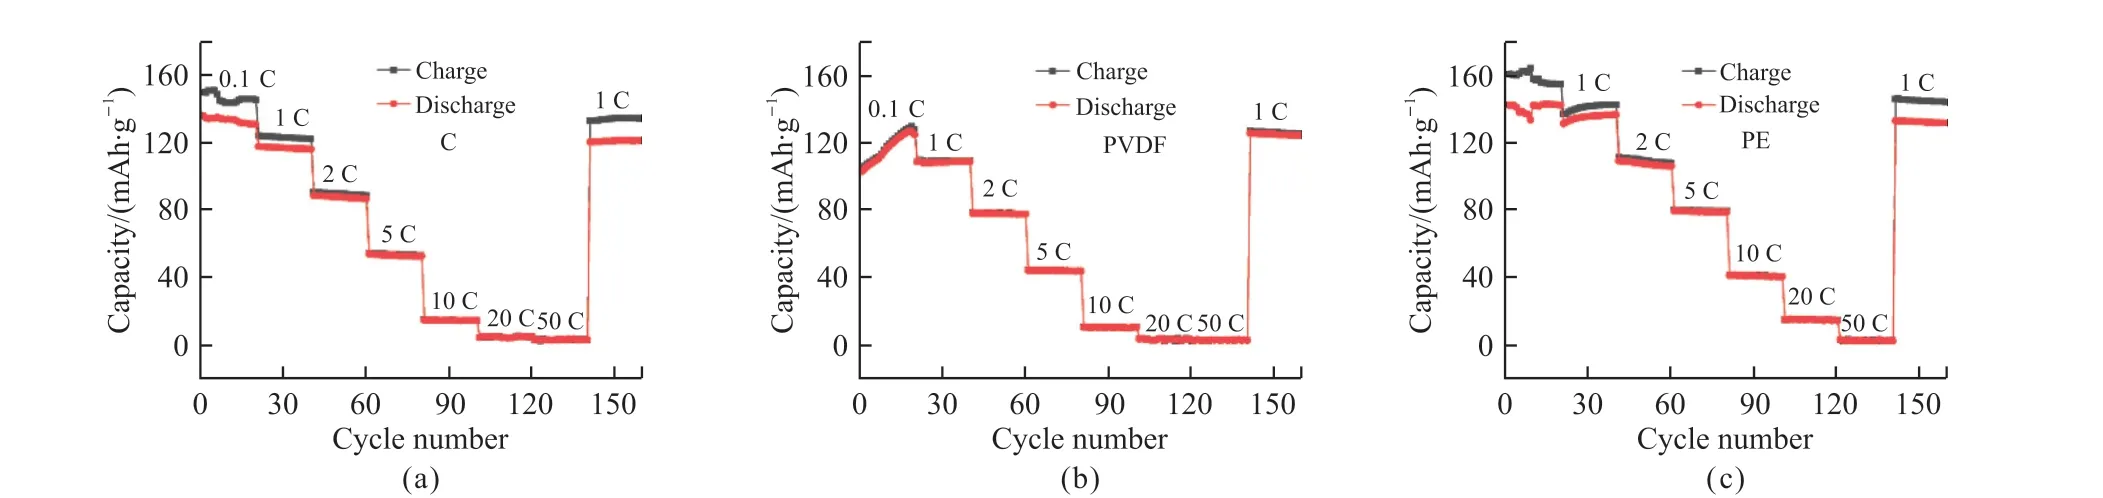
Fig.8 Full cell rate performance curves of three separators: (a) C, (b) PVDF, and (c) PE

Fig.9 Rate performance curves of ternary half-cells with three separators: (a) C, (b) PVDF, and (c) PE
Subsequently, the three separators were tested for rate performance in full cells, and the results obtained are shown in Fig.8.Fig.8(a) shows the retained capacities of C separators at current densities of 0.1, 1, 2, 5,10, 20, and 50 C, are 130, 115.5, 86.1, 52.1, 14.2, 2.6,and 2.6 mAh·g-1, respectively.Under 50 C, the capacity is almost 0.When the current density is returned to 1 C, the capacity is 120.4 mAh·g-1, and the capacity retention rate is 104%.In Fig.8(b), the PVDF separator maintains capacities of 126.5, 108.5, 77.7, 44, 10.7,3.5, and 3 mAh·g-1in the same rate range, respectively.At current densities of 20 and 50 C, the capacities are also close to 0.As back to 1 C, the retained capacity is 123.9 mAh·g-1with a capacity retention rate of 114%.In Fig.8(c), the capacities of the PE separators at different current densities are 142.2, 136.3, 106, 78.9, 40.6,14.6, and 2.7 mAh·g-1, respectively, and the retained capacity when returning to 1 C is 131.4 mAh·g-1, and the capacity remains the rate is 96%.Among the assembled full cells, the rate performance of the PE separator is the best among the three separators, and the stability is also superior, which may be because the PE separator has the highest porosity and the better wettability.
We assembled those separators into ternary halfcells for rate performance tests, and the results are shown in Fig.9.The cells with three separators were charged and discharged at current densities of 0.1, 1, 2,5, 10, 20, and 50 C, respectively, and the capacities of the C separators in Fig.9(a) are 103, 85.6, 57.6, 27.2,2.5, 2.4, and 2 mAh·g-1, respectively, the capacity is 86.2 mAh·g-1when the current density returns to 1 C,and the capacity retention is 100%.The capacities of PVDF separators in Fig.9(b) are maintained at 145.3,124.5, 85.9, 35.8, 2.6, 1.6, and 2.6 mAh·g-1, respectively, and the capacity was 137.6 mAh·g-1when the current density returned to 1 C, and the capacity retention rate was is 110%.In Fig.9(c), the capacities of the PE separators were maintained at 138.7, 111.6, 67.6, 24.7,2, 1.6, and 2.5 mAh·g-1, respectively.When the current density returned to 1 C, the capacity was 117.9 mAh·g-1, and the capacity retention rate was 117.9 mAh·g-1.is 105%.The capacity of these three types of separators drops sharply when the current density reaches 10 C,indicative of the poor-rate performance at high current density.The PVDF separator has the best rate performance, which may be due to the smallest contact angle and better wettability.
The rate performance curves of the three separators in the graphite half-cell are shown in Fig.10.Fig.10(a) shows the capacities maintained by the C separator at current densities of 0.1, 0.5, 1, 2, 3, 5, and 8 C, are 340.6, 324.6, 257.5, 127.7, 75.9, 38.1, and 30.1 mAh·g-1, respectively.The capacity retention at 8 C was 8%, and when the current density returned to 1 C, the capacity is 314.6 mAh·g-1, and the capacity retention is 122%.The capacities of the PVDF separators in Fig.10(b) are maintained at 386.9, 380.8, 320.4,256.2, 129, 48.2, and 33.9 mAh·g-1, respectively.When the current density returns to 1 C, the capacity is 346.6 mAh·g-1, and the capacity retention rate is 108%.The capacities of the PE separators in Fig.10(c) are maintained at 349.3, 311.8, 215.6, 135.6, 53.9, 29.3, and 22.5 mAh·g-1, respectively.When the current density returns to 1 C, the capacity is 228.8 mAh·g-1, and the capacity retention rate is 106%.Among them, PE and PVDF separators have better rate performance and are the most stable in the cycle process.
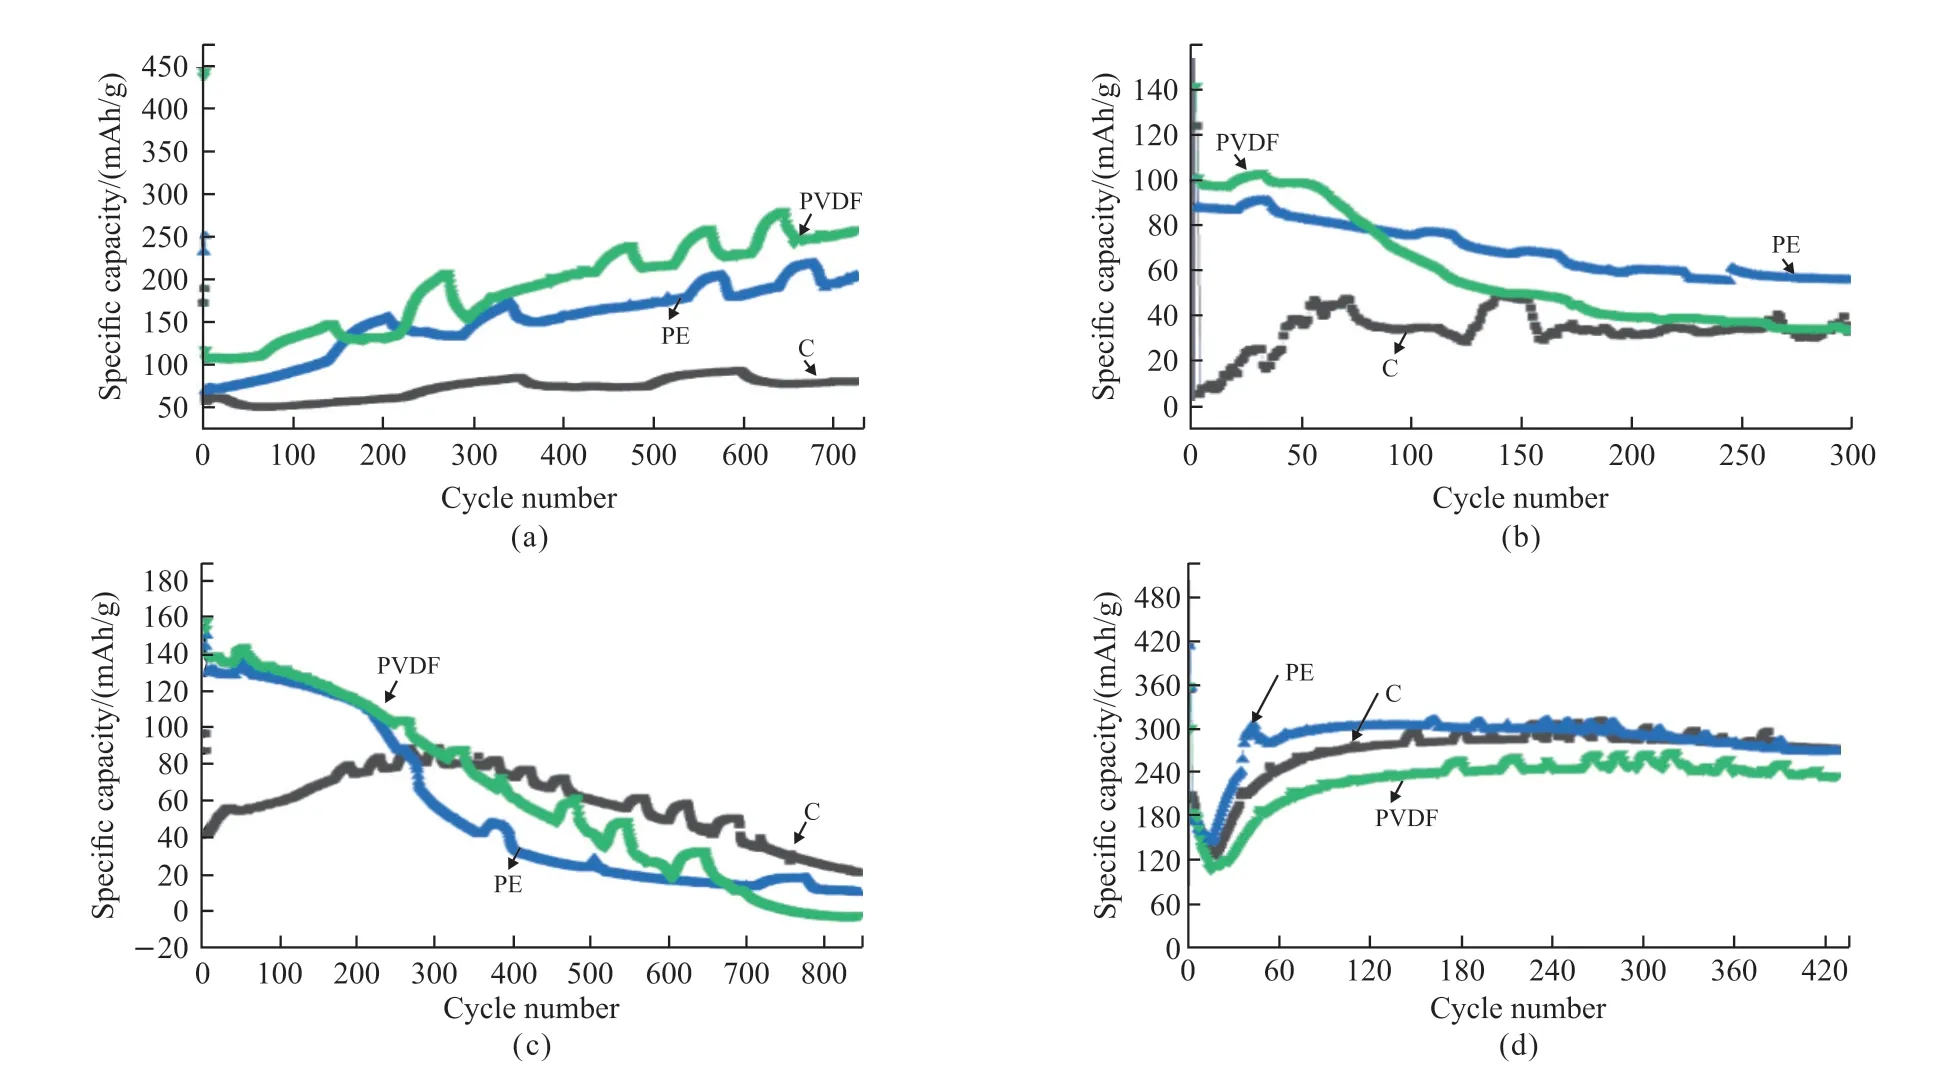
Fig.11 Cycling performance curves of three separators in (a) lithium-sulfur battery, (b) full battery, (c) ternary half-cell, and (d) graphite half-cell
To further test the electrochemical performance of the battery assembled with the three separators, the cycle performance test was carried out, and the results are shown in Fig.11.In the case of the lithium-sulfur battery shown in Fig.11(a), after 720 cycles, the capacity of the assembled lithium-sulfur battery all showed an upward trend, and the C separator had a short downward trend in the first 100 cycles.The PVDF separator has a discharge specific capacity of 439 mAh·g-1in the first cycle, and Coulombic efficiency of 102%.The reason is that the contact angle of the PVDF separator is small and it is in full contact with the electrolyte.The first discharge specific capacity of the PE separator is 232.8 mAh·g-1, the Coulomb efficiency is 97%, and the capacity after 720 cycles can still maintain 205 mAh·g-1.The capacity of the C separator remains at about 80 mAh·g-1after cycling, which is slightly lower than that of the PE and PVDF separators.
Fig.11(b) is the cycle performance of the assembled full battery.It can be observed that the C separator shows an upward trend in the first 70 cycles,and then remains stable up to 300 cycles with a stable capacity of 36 mAh·g-1.The coulombic efficiencies of the three separators in the first cycle are 94%, 96%,and 93%, respectively.The PE and PVDF separators maintained a gentle upward trend in the first 50 cycles,and then showed a downward trend.The capacities were 55.9 and 34.4 mAh·g-1after 300 cycles, respectively.Fig.11(c) shows the cycle performance curves of the assembled ternary half-cell, and the Coulomb efficiencies of the first cycle are 69%, 29%, and 38%,respectively.The capacities of PE and PVDF separators maintained a high level in the first 60 cycles, and then began to decrease gradually.The capacity of the C separator maintained an upward trend in the first 380 cycles, reaching a maximum capacity of 93.6 mAh·g-1,and then decreased to only 26 mAh·g-1.The cycle performance curves of the graphite half-cells in Fig.11(d)show similar trends and capacities for three separators.In the first 20 cycles, the capacity reached the lowest level and then began to gradually increase.After 420 cycles, the capacities were 271.9, 268.5, and 235.4 mAh·g-1, respectively.

Fig.12 CV curves for PE separator: (a) Room temperature lithium-sulfur, (c) Room temperature full cell, (e) High temperature lithium sulfur, and (g) High temperature full cell (scan rate at 0.5 mV·s-1).The first cycle charge-discharge curves for PE separator: (b)Room temperature lithium sulfur, (d) The room temperature full cell, (f) High temperature lithium-sulfur, and (h) High temperature full cell.CV curves for ceramic separator: (i) Lithium-sulfur, and (k) Full cell (scan rate at 0.5 mV·s-1).First cycle charge-discharge curves for ceramic separator: (j) Lithium-sulfur, and (l) Full cell
After a series of tests on four batteries assembled with three kinds of separators at room temperature, we assembled the PE separators and ceramic-coated separators into lithium-sulfur batteries and full batteries for testing at different temperatures and electrolyte dosages.Fig.12 shows the cyclic voltammetry curve (scan rate at 0.5 mV·s-1) and the first cycle charge-discharge curves.around 2.45 and 2.53 V, respectively.Two reduction peaks appeared and were located at around 2.0 and 2.2 V, respectively.Figs.12(g)-12(h) are the results of the full battery at high temperatures.The peak shapes in the CV curve of three different amounts of electrolyte are similar and match well with the charge-discharge plateau.Figs.12(i)-12(j) show the test results of lithium-sulfur batteries assembled with ceramic separators at different temperatures.The oxidation peaks at room temperature and high temperature are at 2.2 and 2.5 V, respectively, and the reduction peaks are at 2.48 and 2.2 V, respectively, which are consistent with the charge-discharge plateau.In Figs.12(k)-12(l) of the full battery assembled with a ceramic separator, the peak position of the CV curve can correspond to the plateau of the charge-discharge curve, the capacity of the lithium-sulfur battery, and the full battery assembled with the ceramic separator at high temperature is significantly improved.
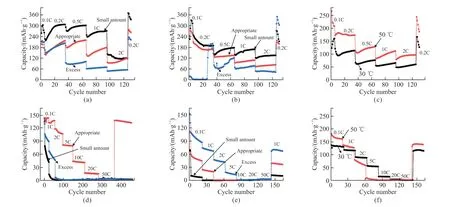
Fig.13 Rate performance curves of two separators.PE separator: (a) Room temperature lithium-sulfur, (b) High-temperature lithium-sulfur,(c) Room temperature full battery, (d) High-temperature full battery; Ceramic separator: (e) Lithium-sulfur and (f) Full battery
Fig.12 a and b are the CV curve and the first cycle charge-discharge curve of the lithium-sulfur battery assembled with the PE separator at room temperature,respectively.It can be seen from the figure that the oxidation peak and reduction peak potential are biased when the electrolyte is added in a small amount of excess.When the excess electrolyte was added, two oxidation peaks appeared, located at 1.9 and 2.2 V,respectively, which were consistent with the plateau of the charge-discharge curve in Fig.12(b).Figs.12(c)-12(d) are the results obtained by testing the PE separator in the full cell.The peak position of the appropriate amount of electrolyte in the CV curve is obvious, and the plateau of the charge-discharge curve cannot be fully displayed due to the low capacity.Fig.12(e) shows the CV curves of lithium-sulfur batteries assembled with PE separators at high temperatures.The peak shapes of the curves are similar under the three different amounts of electrolyte, but two oxidation peaks appear in a small amount of electrolyte is located at
Fig.13 shows the rate performance curves of the PE separator and ceramic separator under different current densities.Fig.13(a) shows the test results of a lithium-sulfur battery assembled with PE separators at room temperature.The capacity continues to decrease from 0.1 to 2 C, and the capacity level remains the highest with a small amount of electrolyte, and can still be maintained at a current density of 2 C.The capacity of 120 mAh·g-1is maintained, that is, the capacity retention is at about 39.7%, while the capacity of the lithium-sulfur battery using an appropriate amount and excess electrolyte at room temperature is lower than that of a small amount of electrolyte.In Fig.13(b), the rate performance of the lithium-sulfur battery assembled with PE separator at high temperature is poor compared with that at room temperature.The lithium-sulfur battery after using a small amount of electrolyte has the best performance and can still be used at a current density of 2 C.A capacity of 135.4 mAh·g-1is maintained.Figs.13(c)-13(d) are the rate test results of the full battery assembled with the PE separator.As the current density increases, the capacity gradually decays.At room temperature, the capacity of an appropriate amount of electrolyte is close to 0 at a current density of 30 C.When the electrolyte is used in a small or excessive amount.The capacity is close to 0 at a lower current density; the full-cell test results at high temperature show that the capacity decay is significantly accelerated, but it can still return to the original capacity level when the current density returns to 1 C, but at high current density, the capacity is quite low.Figs.13(e)-13(f) are the rate performance of the ceramic separator in lithium-sulfur batteries and full cells with appropriate electrolytes.The rate performance of the lithium-sulfur battery at high temperature in Figure e is better than that at room temperature, and the current density of 2 C at room temperature and high-temperature capacities are maintained at 60 and 96.8 mAh· g-1,respectively.The test of the full cell in Fig.13(f) shows unsatisfactory results, mainly due to lower capacity at high rates, but the current density can still return to the original capacity level when the current density returns to 1 C.In the lithium-sulfur battery assembled with an appropriate amount of electrolyte, the performance of the PE separator is better than that of the ceramic separator, mainly due to the higher liquid absorption and high porosity of the separator, which can improve the cycle and rate performance of the battery.In the full battery assembled with an appropriate amount of electrolyte, the performance of the PE separator is better at room temperature, while the performance of the ceramic separator is better than that of the PE separator at high temperatures.So that its pore size is smaller than that of the ceramic separator, its rate performance is reduced.

Fig.14 Cycle performance curves of two separators.PE separators: (a) Room temperature lithium-sulfur, (b) High-temperature lithium-sulfur,(d) Room temperature full battery, and (e) High-temperature full battery; Ceramic separator: (c) Lithium-sulfur and (f) Full battery
Fig.14 shows the cyclic test results of a lithium-sulfur battery and a full battery assembled with PE and ceramic separators using different amounts of electrolytes at different temperatures.From the lithium-sulfur battery cycle test in Figs.14(a)-14(c), the capacities of the two separators gradually increased over 700 cycles.Under a moderate amount of electrolyte at room temperature, the capacity of the PE separator was much higher than that of the ceramic separator, with capacities of 195.2 and 80.7 mAh·g-1.A small amount of electrolyte at room temperature can relatively reduce the shuttle effect of lithium-sulfur batteries.In Fig.14(a),the capacity of a small amount of electrolyte is high during the cycle.Among the lithium-sulfur batteries with appropriate electrolytes at high temperatures, the capacity of the battery using the ceramic separator is slightly higher than that of the PE separator, and the capacity reaches 244.9 and 263.9 mAh·g-1after 700 cycles, respectively.Figs.14(e)-14(f) are the cycle test results of the assembled full battery.It can be seen from the figure that the capacity of the full battery gradually decreases with the increase of the number of cycles.The capacity of the PE separator is higher than that of the ceramic separator at room temperature and high temperature with an appropriate amount of electrolyte.It can be seen from the results that the use of excess electrolytes is conducive to long-term charge and discharge, making the cycle more stable.
4 Conclusions
In this study, the physical and chemical properties of PE, PVDF, and ceramic separators and their electrochemical properties in lithium-ion batteries and lithium-sulfur batteries were investigated.The structure and properties of the three kinds of separators are different.Among them, the PE separator has the highest porosity,which can reach 62%.PVDF separator has the best mechanical properties, and its stress can reach 165.7 MPa.PVDF separator has a contact angle of 74.7°, which has good wettability.The close-cell temperature is 144 ℃,with good heat resistance.In the case of electrochemical performance, the PE separator has the best rate performance in LIBs, and the capacity retention rate is over 90% at low current density.The PVDF separators exhibit the best cyclic stability upon the Li-S battery.The PE and ceramic separators are also tested in lithium-sulfur batteries as well as lithium-ion full batteries with different amounts of electrolytes at room temperature and high temperature.In the full battery test, the rate and cycle performance of the ceramic separator is better than that of the PE separator with the appropriate amount of electrolyte at high temperature, which may be since the PE separator shrinks at high temperature and the pores become smaller.The PE separator was tested with different amounts of electrolytes at different temperatures.At room temperature, the electrochemical performance of the battery was better with a moderate amount and a small amount of electrolyte, while at high temperature, the excess electrolyte was conducive to the long-term cycle of the battery.In conclusion,the PVDF separator may be used in Li-S batteries due to its ability to restrain the shuttle effect.The ceramic separator, however, can be used in both LIBs and Li-S batteries under high-temperature conditions.
Conflict of interest
All authors declare that there are no competing interests.
杂志排行
Journal of Wuhan University of Technology(Materials Science Edition)的其它文章
- Enhanced Electrochemical Performances of Ni Doped Cr8O21 Cathode Materials for Lithium-ion Batteries
- Design on the Prestressed Concrete Frame Beam-column
- Synthesis and Flocculation of Polyacrylamide with Low Water Absorption for Non-dispersible Underwater Concrete
- Experimental Behavior of Recycled Aggregate Concrete Filled Steel Tubular Columns
- Impact-abrasive Wear Behavior of ZTA and NbC Reinforced Fe60 Matrix Composites
- Synthesis and Characterization of Hollow Strontium Carbonate Pompons by Composite Soft Template Method