Effects of Strain Rate on the Mechanic Performance of Lattice Materials
2021-06-14NIUHaiyanYOUNingMIAOChengMUXiaomingYANGZizhenLURuijiaoLAIXinLIGuofei
NIU Haiyan, YOU Ning, MIAO Cheng, MU Xiaoming, YANG Zizhen,LU Ruijiao, LAI Xin, LI Guofei
(1. Beijing Special Vehicle Research Institute, Beijing 100072, China; 2. 32178, Beijing 100012, China; 3. Science and Technology on Materials in Impact Environment Laboratory, Yantai 264003, China; 4. Department of Engineering Structure and Mechanics, Wuhan University of Technology, Wuhan 430070, China)
Abstract: Split Hopkinson pressure bar (SHPB) was utilized to explore the effects of loading strain rate on the dynamic compressing strength of the titanium alloy lattice material. Results reveal that the yield strength of alloy lattice material reaches 342 MPa initially and then drops to 200 MPa before it rebounds to 252 MPa while the loading strain rate correspondingly increases from the static value 1 401/s to 2 084/s.Numerical simulations were then carried out to explore the possible reason underlying. Results show that the lattice structure changed the stress distribution and caused significate stress concentration at finite strain with high strain rate. It is believed that the strain rate strengthening effect and layer-wise failure mode are the main reasons of the above mechanical properties change.
Key words: titanium alloy; lattice material; dynamic properties
1 Introduction
Lattice material is a new kind of lightweight multi-functional materials formed by threedimensional configuration and periodic arrangement of microstructures[1-2], which has excellent mechanical properties such as high porosity, ultra-light, high specific strength, high specific stiffness, high strength and high energy absorption[3-5]. The excellent mechanical properties of lattice materials make them widely used in space, aviation, land transportation and other transportation tools, military facilities and packaging fields[6-8]. As porous materials, lattice materials are ideal lightweight structural materials that resist explosion and ballistic impact for its special lattice structure causing strong retardation, divergence and interference effects on stress waves[9,10].
There are many works showing the advantages of this type of materials. However, there were very few published works on the quantitative relationship between the lattice structure and the dynamic performance of the lattice material. The absence of the quantitative relationship greatly limited the optimization of the lattice structure of this type materials. In this paper, a series of the split-Hopkinson-bar (SHPB)experiments were conducted and the dynamic properties of the titanium alloy lattice material have been investigated to explore the above quantitative relationship. The effects of loading strain rate on the dynamic compressing strength of the titanium alloy lattice material and its intrinsic reason were focally explored.
2 Methodology
2.1 Experimental materials and processing
The raw material used for the specimen is the titanium alloy lattice material prepared by selective laser melting technology with a commercial TC4 powder, as shown in Fig.1. Fig.1(a) gives the schematic diagram, and Fig.1(b) illustrates the real specimen for the mechanic properties test. The latticed titanium alloy could be considered as the periodic piling of single body-centered cubic (BCC) primitive cell in 3 D. In the cubic of the primitive cell, whose side length is 2 mm,the line connecting the center point of the cube and the four diagonal points are used as the axis of the pillarshaped pillar, and the four pillars intersect at the center point. The intersecting position is smoothed by rounded corners with radiusR=0.25 mm, and the pillar diameter is 0.6 mm. The density of titanium alloy lattice material is 1.38 g/cm3. The manufactured specimen is shown in Fig.1(c).
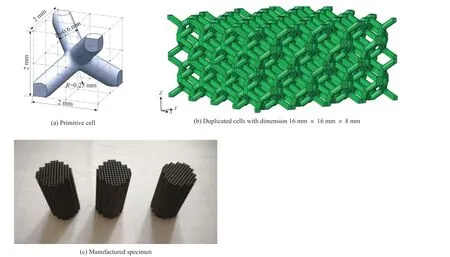
Fig.1 Titanium alloy lattice material
The quasi-static and dynamic compression experiments were carried out on a universal material testing machine and an SHPB equipment respectively.During the tests, the quasi-static loading speed was set as 2 mm/min and the nominal strain rate was 3.3×10⁻³/s[11], and the dynamic compression loading strain rates were 807/s, 1 401/s and 2 084/s. The dimension for the quasi-static and dynamic compression isФ10×8 mm.The compressing direction of specimen is consistent with the thickness direction of material.
Based on the assumption of one-dimensional stress wave in the bar and the assumption of stress and strain along axial uniformity in the specimen, the stress and strain relationship is derived according to the onedimensional stress wave theory[12].
For the sake of illustration, let us number the end surface of the specimen that connected with the incident bar of SHPB as 1, and the surface connected to the transmission bar as 2. The displacement of interface 1 and 2 isU1(t) andU2(t) respectively. It is assumed that the strain of the specimen under tension loading is negative and positive for compression. Thus, we have:

where
c0is the Elastic wave velocity;
εi(τ),εr(τ),εt(τ) are strain signal of incident wave,reflected wave, and transmission wave, respectively.Strain signal of incident wave, reflected wave, and transmission wave.
It is assumed that the original length and cross section area of the specimen arelsandAsrespectively,so the average strain in the specimen is:

Eq.(3) is used to calculate the derivative of time,and the strain rate in the sample is obtained.

The force of the end face 1 and the end face 2 of the specimen isP1(t) andP2(t) respectively, in which


Fig.2 Modelling of the titanium alloy lattice material specimen
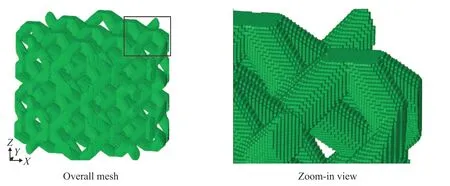
Fig.3 FEM numerical model after meshing
whereA0is cross-sectional area of the bar, andEis Elestic modulus of the bar.
The average stress in the specimen is then expressed by:

The above equations are used to calculate strain rate, strain and stress in the specimen by incident ,reflection and transmission wave.
2.2 Numerical modeling
In this work, finite element analyses are carried out to investigate and explore the fundamental nature of the unique dynamic mechanical properties of the lattice material. Since titanium alloy lattice material could be treated as a periodic duplication of its primitive cell, we build our numerical model through cutting the duplicated cell by a cylinder, as illustrated in Fig.2.The numerical model consists of 322 832 hexahedron elements and 390 313 nodes, with averaged grid size 0.05 mm. The discretized numerical model is shown in Fig.3, in which one may find the mesh stepping along the out-surface of the geometry. We believe that compared to the not precisely detailed local characteristic, the hexahedron element outweighs other elements in aspect of its performance under high-strain rate condition.

Fig.4 Schematic diagram of the numerical modelling and configuration setup
The discretized mesh is then subjected to the high strain-rate by applying virtual SPHB experiment, which is realized by adding two solid surfaces of incident and transmission bar, respectively, as illustrated in Fig.4. In the schematic illustration, only one fourth of discretized mesh is explicitly modelled to improve the computational efficiency without loss of accuracy. The displacement of the top face is fully controlled and described by Eq.(8).


Table 1 Parameters for Johnson-Cook constitutive relationship[1]

Table 2 Parameters for Grüneisen equation of state
3 Results and discussion
3.1 The experimental results
3.1.1 Quasi-static compression

Table 3 Mechanical properties of TC4
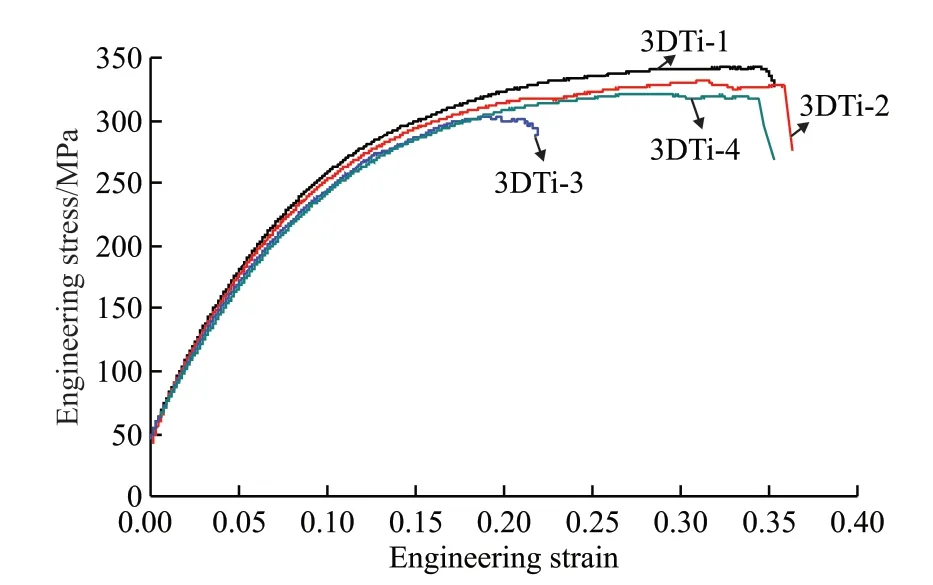
Fig.5 Quasi-static stress-strain curves
The stressversusengineering strain curves obtained by quasi-static compression experiment are illustrated in Fig.5. To improve the accuracy of the results, the experiment was repeated four times.The yield strength of the lattice is about 342 MPa and its extreme engineering strain is about 35%. The mechanical properties of real TC4 material is then obtained by averaging the experimental data and its lattice structure, which is listed in Table 3. The yield strength of TC4 is about 950 MPa and the corresponding elongation is about 16%. Both of them are almost the same with the reported value[13].
3.1.2 Dynamic compression
The results of dynamic compression were analyzed by one dimensional elastic wave theory. The dynamic compressive stress-strain curves of titanium alloy lattice material under different strain rates were shown in Fig.6. It showed that all the maximum yielding strengths of the lattice material are about 252 MPa with different loading strain rates from 807 to 2 084 s-1(specimen photos are shown in Fig.7). There is no notable change of the yielding strength of the TC4 itself. It may be the relatively small change of the loading strain rate or the TC4 not sensitive to the strain rate in this range. However, the dynamic yielding strength showed a small decrease comparing with the static yielding strength. Furthermore, there were more than one yielding stress peaks with the strain increase.It should be the result of the layered failure of lattice TC4 during yielding. The shattered extent of the specimen increases with the loading pressure, as shown in Fig.8, also proving the above suggestion.
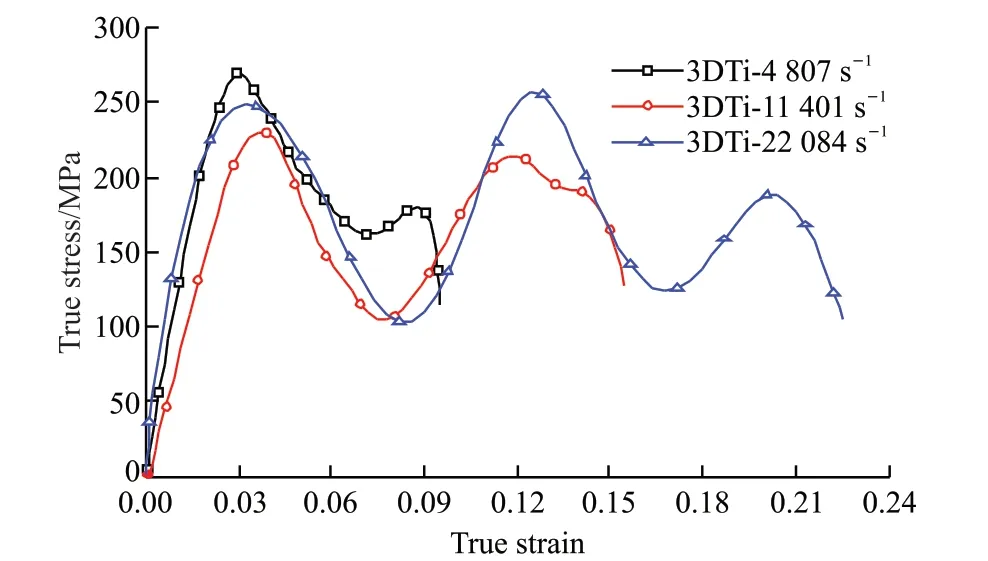
Fig.6 The real stress-strain curves of TC4 lattice materials under different strain rates
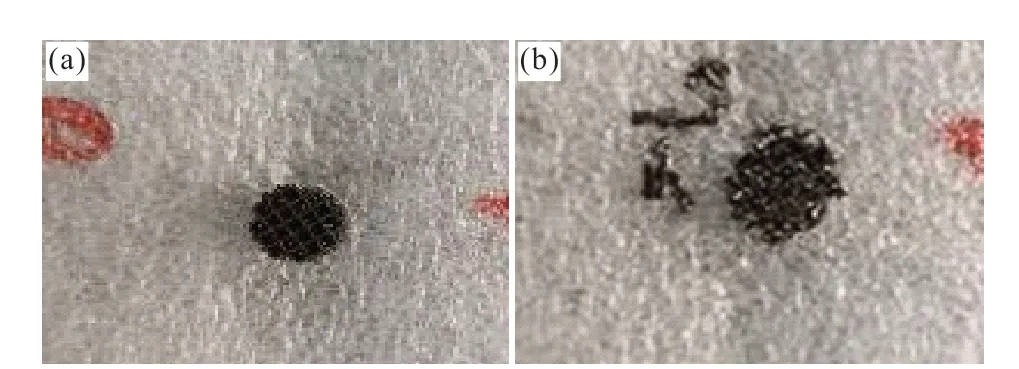
Fig.7 Failure condition of the specimens: (a) Loading pressure of 0.39 MPa and strain rate of 807 s-1; (b) Loading pressure of 0.60 MPa and strain rate of 1 686 s-1
The area enclosed under the stress-strain curve is used to calculate the energy absorbed by the material per unit volume during the dynamic compression. The results were shown as Fig.8.
The energy absorbed per unit volume of titanium alloy lattice material increased from 17 543.6 kJ at 807 s-1to 39 101.5 kJ at 2 084 s-1. It is notable that,the larger strain rate the material undergoes, the more energy is absorbed. As discussed before, the dynamic yield strength of titanium alloy lattice material is estimated around 252 MPa, which does not vary with the loading condition. The obvious increase of the fracture strain of the TC4 lattice materials must be the main reason. It could be found that the ultimate strain or fracture strain showed obvious increases with the strain rates, which shows promising prospects of the application in energy-absorbing field.
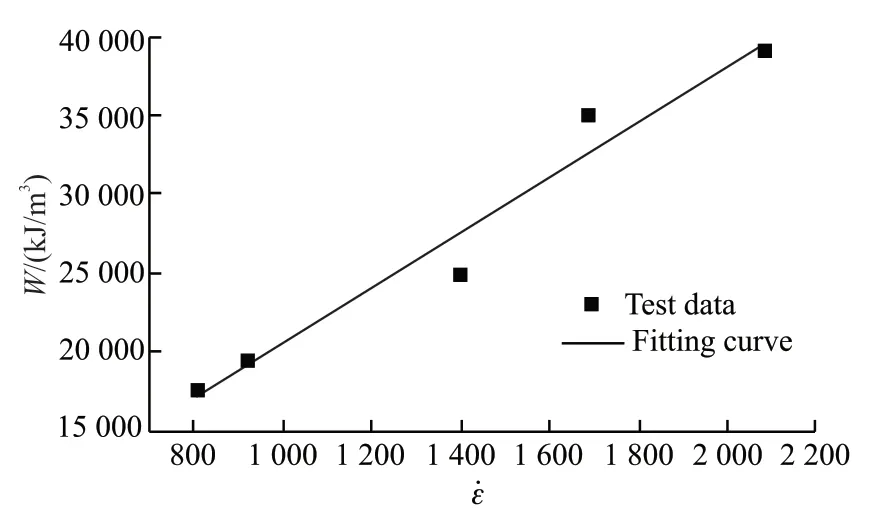
Fig.8 The relationship between energy absorbed per unit volume and strain rate of TC4 lattice materials
3.2 The numerical results
In order to validate the numerical discretization of the specimen, and help exploring the fundamental mechanism underneath, quasi-static and high strain-rate loading are applied to the numerical model. The stressstrain relationship is obtained and plotted in Fig.9. The numerical prediction shows good agreement with the experimental results in the quasi-static loading case, as illustrated in Fig.9(a). In the whole quasi-static loading progress, the specimen shows uniform deformation for both experimental and numerical results.
The results for high strain-rate are given in Fig.9(b), 9(c), and 9(d), for 807, 1 401 and 2 084/s,respectively. Good agreements could be found between numerical simulations and experimental results for the former two loading conditions of the three, as illustrated in Fig.9(b) and 9(c). The position of the stress peak, as well as the overall pattern are highly consistent.
For 807/s strain-rate loading, the stress evolution process of lattice structure under different deformation are plotted in Fig.10. One can find that the overall stress remains relatively low level, except moderate stress concentration at the intersecting sections of the pillars of the primitive cell when ε=0.02. As the strain goes up to 0.03, stress distribution becomes non-uniform,while stress level of middle section of the pillar inside the primitive cell remains low, and the stress level at the position of the stress concentration keeps increasing,which makes the stress concentration intensified. It is predicted that these positions will fracture first; whenεt= 0.06, the structure of the first layer starts to break down gradually, and the overall stress level is reduced at this time, and there is a serious stress concentration at the connection position of the second layer and other layers; when εt=0.09, the first layer is completely broken in structure at this time. Due to the incompleteness of the lattice structure, the ability of the first layer to resist external damage is gradually weakened, while the structure of the other layers is relatively complete and has a strong ability to resist deformation.
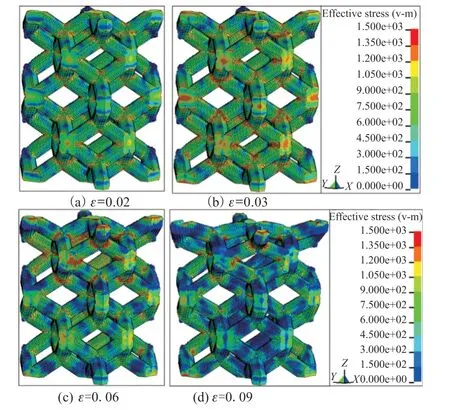
Fig.10 Stress evolution process of lattice structure under different deformation at 807/s strain rate
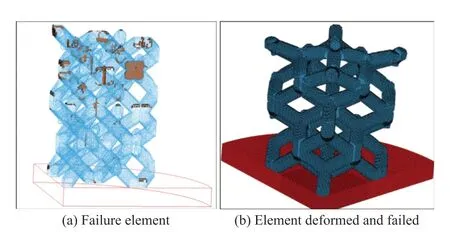
Fig.11 Final deformation and failure morphology of lattice structure at 807/s
Fig.11 shows the final deformation and failure topography of the lattice structure at 807/s strain rate. It can be illustrated that the damage in the lattice structure occurs in the unit cell mirror image, and the cracking is oriented along the height direction. The unit cell mirror image position of the first layer is directly broken, and the unit cell mirror position unit of the other layers is severely distorted.
For the 1401/s strain-rate loading, the stressstrain curve obtained by the dynamic compression experiment and the stress-strain curve obtained by the simulation are in good agreement within a certain range (Fig.9(c)). The dynamic compression process under the 1 401 s-1strain rate is similar to the dynamic compression process under the 807 s-1strain rate.The elastic response is observed at the beginning of loading, when each layer of the sample exhibits consistent deformation. With the increasing of the deformation, the bearing stress reaches the peak value,and the lattice material begins to undergo relatively large plastic deformation at certain spots, which makes the structure gradually breaking down and the bearing stress decreasing.
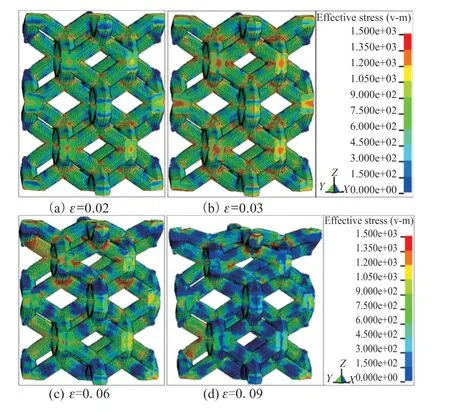
Fig.12 Equivalent stress cloud diagram of lattice structure under different deformations at 1 401/s strain rate
Fig.12 gives the equivalent stress cloud diagram of the lattice structure model under different strains.From the Von-Mises stress cloud diagram, it can be seen that whenεt= 0.02, it is in the elastic section of the stress-strain curve. Except for some stress concentration positions, the other parts have relatively uniform stress distribution and are at a lower stress level. There is a small amount of deformation, and the sample remains intact at this time; whenεt= 0.03, the stress level at the stress concentration position reaches the peak, mainly concentrated in the unit cell mirror position, the unit at this position begins to fail, and the overall stress level is increasing. Whenεt= 0.06,as the integrity of the first layer structure is gradually destroyed, the structure of the first layer is maintained when the stress level is low. The stress concentration at other layers is alleviated. Whenεt= 0.09, the first layer is almost destroyed, while the unfractured structure is superimposed on the second layer which makes the stress easier transferred and causes the stress concentration increased again.
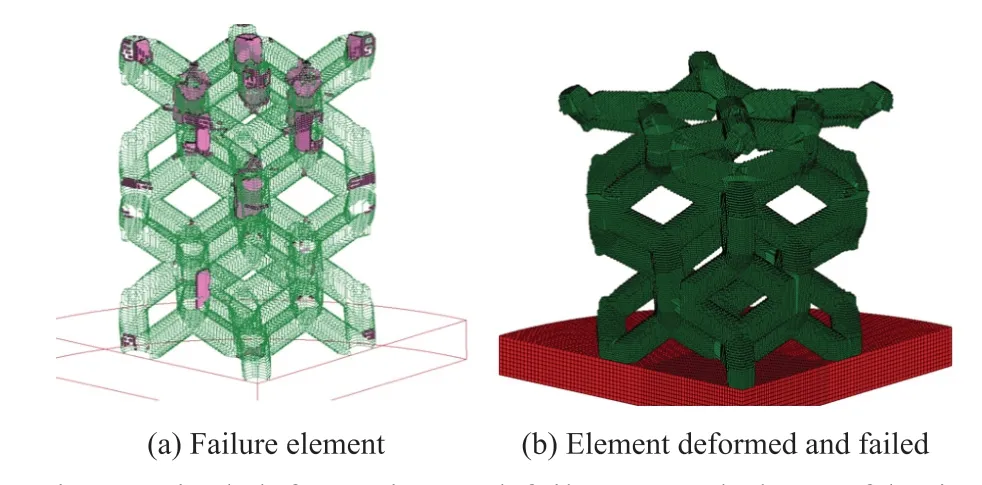
Fig.13 Final deformation and failure morphology of lattice structure at 1 401/s strain rate
Fig.13 shows the final deformation and failure topography of the lattice structure at 1 401/s strain rate.When the loading is applied completely, damage occurs immediately at the mirror position of each layer of the primitive unit. At the beginning, the unit at this position is stretched as a whole piece, and then fracture occurs along the direction of height. The most severe damage happens in the intersecting position of the pillars at the top layer, among which the inner pillars of the unit cell break at the intersecting position. The intra-cell pillars of the other layers have different degrees of cracking at this position. The extent of damage monotonously decreases along the direction from top to bottom, but as the damage progresses, no propagation of cracking occurs in the top layer.
For the 2 084/s strain-rate loading, the numerical results show good consistence with experimental data before true strain reaches 0.07, after which, massive elements in the numerical simulation are deactivated when they reach the failure criterion. Actually, the material is still capable of load bearing after that, which leads to stress increasing as loading continues. The curves differ further as more elements being removed,which significantly altered the accuracy of the final prediction.
3.3 Discussion
3.3.1 Mechanical performance analysis
There are obvious differences between dynamic mechanical properties and quasi-static mechanical properties of titanium alloy lattice materials as shown in Fig.14. At the initial loading, linear elastic response could be found in both cases. However, the lattice material exhibits higher elastic stiffness during dynamic compression than that under quasi-static compression. The lattice structure of top layer is first destroyed during dynamic compression, and when the strain for dynamic compression failure is reached, the quasi-static compression is still in the elastic stage. For dynamic compression, the peak stress value is almost unchanged, and the material behavior shows stress hardening due to the strain rate effect as the nominal elastic modulus increases significantly. However, the ultimate stress is reached much sooner at a low strain.After that, the first layer begins to fail. In the quasistatic compression process, due to the low strain rate,the grains can have enough time to coordinate with each other to deform, and more slip systems could be activated to enhance the strength by dislocation strengthening effects, which in also increase the stress in turn.
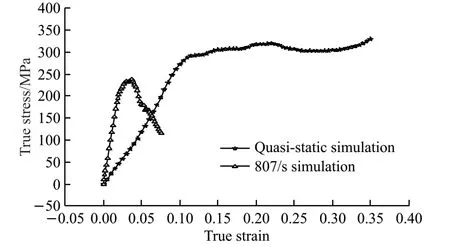
Fig.14 Dynamic mechanical compression simulation and quasistatic compression simulation stress-strain curve
3.3.2 Damage morphology analysis
Fig.15 show the final deformation morphology of lattice materials under quasi-static and dynamic compression. The quasi-static compression process and the dynamic compression process show a completely different failure process, and significant difference could be found in aspect of the final failure morphology. For dynamic compression, the sample exhibits the characteristics of top-down failure layer by layer, especially at the location of the mirror image of the unit cell and the intersection of the pillars in the unit cell, which are prone to stress concentration that leads to failure. During the damage process of this layer, cracks initiate and propagate in the second layer, when the system stress fluctuates. In contrast,the material exhibits good plasticity in the quasi-static compression process, due to the low strain rate, when the dislocations have enough time to slip dynamically.The deformation of the specimen along the height direction in the quasi-static compression process shows symmetry. In the elastic stage, the whole shows a relatively uniform plastic deformation. After yielding,the two layers of the lattice structure which adjacent to the input rod and the output rod begin to deform first,following which finite deformation is developed in the middle layer. After failure of the top and bottom layers,further deformation could be found in the middle layer,and the quasi-static deformation process reflects the effect of symmetrical destruction from the outside to the inside.
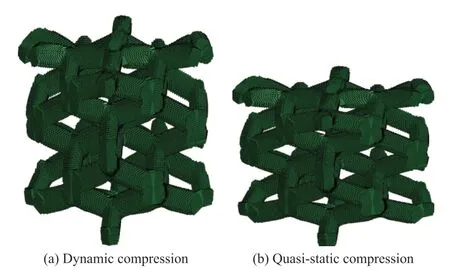
Fig.15 The final deformation morphology of lattice materials under quasi-static and dynamic compression
4 Conclusions
In this work, a series of experiments have been conducted to explore and investigate the mechanical properties and energy-absorbing capability of a titanium alloy lattice material based on the Split Hopkinson Pressure Bar (SHPB). The lattice structure and the configuration of the specimen was designed and prepared. Results reveal that the titanium alloy lattice material has unique dynamic mechanical characteristic,which is caused by its lattice structure. The fracture of titanium alloy lattice material increases with the increase of loading pressure. In the range of 807 to 2 084/s of strain rate, the energy absorbed per unit volume of the sample monotonically increases from 17 543.6 to 39 101.5 kJ with the increasing of the strain rate. Numerical modelling and simulation are then carried out to explore the underlying mechanism using FEM explicit method. After the validation of numerical approach, FEM dynamic simulations are performed to reproduce the evolution of the stress and damage of the structure. The numerical and experimental results show that the strain rate strengthening effect and layer-wise failure mode are the main reasons of the above mechanical properties improvement. The lattice material shows its promising prospect in applications of shielding and protective field for its lightweight and energy-absorbing efficiency per unit weight.
杂志排行
Journal of Wuhan University of Technology(Materials Science Edition)的其它文章
- Effect of Nano Silver Modification on the Dielectric Properties of Ag@TiO2/PVDF Composites
- Preparation and Photocatalytic Performance of Double-Shelled Hollow W18O49@C3N4@Ti3C2 Microspheres
- Effects of Cracks on the Mass Transfer of Polymer Electrolyte Membrane Fuel Cell with High Performance Membrane Electrode Assembly
- Refinement of TiB2 Powders with High-speed Planetary Mill and Its Effect on TiB2 Sinterability
- Fabrication of Ordered Meso-macroporous HPW/TiO2 Catalyst for Efficient Heterogeneous Oxidative Desulfurization
- The Preparation of Porous Activated Slag Granules/TiO2 Photocatalyst and Its De-NOx Performance
