Effects of Cracks on the Mass Transfer of Polymer Electrolyte Membrane Fuel Cell with High Performance Membrane Electrode Assembly
2021-06-14SHIJinrongZHANZhigangZHANGDiYUYuanYANGXiaoxiangHELuyanPANMu
SHI Jinrong, ZHAN Zhigang*, ZHANG Di, YU Yuan,YANG Xiaoxiang, HE Luyan, PAN Mu
(1. Foshan Xianhu Laboratory, Foshan 528000,China; 2. State Key Laboratory of Advanced Technology for Materials Synthesis and Processing, Wuhan University of Technology, Wuhan 430070, China)
Abstract: A two-dimensional geometric model is developed for a polymer electrolyte based on the liquid water penetration mechanism in the membrane electrode assemblies under the action of capillary pressure.The effects of the diameter, number, and distribution of cracks in the micro-pore layers (MPLs) of the modeled MEA on the performance of the PEMFC are simulated to investigate the influence of mass transfer across the membrane. The results indicate that liquid water in the catalyst layer (CL) of the MEA can be discharged to gas channels through the cracks in MEA under the action of capillary pressure, thereby alleviating the flooding in the CL and enhancing the diffusion of oxygen to the CL. When the proportion of the total area of cracks in the active area of the MEA was 8%-12%, crack diameter was 20-30 μm, and cracks were distributed uniformly.MEAs with and without cracks were prepared, fuel cells were assembled, and their performance was measured.The effects of cracks on mass transfer were then verified. This study helps prepare MEAs with controllable cracks.
Key words: PEMFC; MEA; cracking; liquid saturation; oxygen concentration; transfer
1 Introduction
Polymer electrolyte membrane fuel cells(PEMFCs) have become the focus of research on new energy power plants worldwide as they have high energy density, low noise, and low operating temperature and they do not pollute the environment[1].However, owing to their high cost and short life, fuel cells cannot be widely used. Platinum, a precious metal,is the main catalyst material of fuel cells. Therefore,improving the performance of the membrane electrode assembly (MEA) of such fuel cells and reducing its platinum load are the main directions of study.The former can reduce the amount of material used to achieve the same power grade, and the latter can directly reduce the amount of platinum used. However,through these approaches, the number of active points for the electrochemical reaction in the catalyst layer(CL) are reduced; however, the reaction is more intense, the flooding of the electrode and mass transfer polarization are more severe, and the coupling between mass transfer polarization and the oxygen reduction reaction is more prominent[2].
Researchers are currently working to resolve the above issues from various aspects. Kim[3], G Zhang[4]designed different three-dimensional flow fields to study the two-phase flow phenomena in the MEAs,hoping to reduce the saturation of the liquid phase by forced convection and increase the concentration of oxygen in the CL. X Yan[5]proposed two types of flow fields with three-dimensional channel geometry.One flow field was designed with waved channels to induce local oxygen flow from flow channel/ gas diffusion layer (GDL) interface to CL in order to enhance the oxygen supply. The other one had waved channels with gradient channel depth that resulted in increasing flow velocity at both in-plane and throughplane directions from upstream region to downstream region, accommodating the uneven distribution of oxygen concentration. The experimental results clearly demonstrated that the 3D channel geometry is capable of improving cell performance especially at high current densities, which can be attributed to the enhanced oxygen transport and water removal as illumined by a numerical simulation. R Schweiss[6]and Y Zeng[7]researched ordered MEAs to shorten the oxygen transfer path, improve the oxygen diffusion efficiency, and improve the performance of MEAs. Z G Zhan[8,9]. researched water and gas transport in the gas diffusion layers and micropore layers (MPLs) with a gradient porosity structure to improve the discharge capacity of liquid water and enhance the oxygen diffusion effect. ZH Wan[10,11]added hydrophobic components to the MEAs in order to increase their porosity, thereby improving their drainage performance and reducing the oxygen diffusion resistance.
Highly complex micro-surface morphologies can be formed during the preparation of CLs and MPLs,including cracks, troughs, and peaks, which greatly affect water and gas transport, and the electrochemical reaction. Extensive research has been focused on issues related to these factors. For example, J Zhanget al[12]prepared MEAs by different methods and characterized their surfaces through atomic force microscopy. Their scanning electron microscope (SEM) images indicated that sufficient cracks were uniformly distributed on some samples, and their effects on the performance of the cells were also compared. F E Hiziret al[13]employed optical profilometry to characterize the surfaces of MPLs and CLs, and observed deep cracks along the MPL and CL surfaces that differed significantly in their orientation, size, shape, depth,and density. The areal crack density of the tested CL was 3.4±0.2%, while that of the MPL varied from 2.8% to 8.9%. These cracks can significantly influence multi-phase transport. T Sasabeet al[14]employed a laboratory-based soft X-ray radiography technique to investigate the effect of the cracks in an MPL on liquid water transport, and found that the liquid water mainly flowed through the cracks in the MPL to the substrate layer. They observed no liquid water in the MPL as it is hydrophobic and can limit the access of liquid water to the substrate layer. J H Chunet al[15]investigated the progression of the mechanical degradation of MPLs with and without cracks by accelerated stress tests.In their degradation experiment on MPL with cracks,puddle-shaped defects were only formed around the cracks on the surface of the MPL and negatively affected the performance of the PEMFC. However, no puddle-shaped defects were detected for the crack-free MPL, and the decrease in the cell performance after the mechanical degradation of the MPL was insignificant.P Deevanhxayet al[16]used high-resolution soft X-ray radiography to investigate the liquid water transport in the MPL and GDL of an operating PEMFCin-situ,and found that liquid water is mainly transported to the GDL through the cracks in the MPL. They also observed dynamic liquid water transport from the cracks in the MPL to the interconnected pores in the GDL. T Ouset al[17]summarized that the key aspects of PEMFC degradation are associated with the water formation, retention, accumulation, and transport mechanisms within the cell and found that the cracks in the MPL play an important role in liquid water transport. J S Maet al[18]reconstructed a pore structure model using a focused ion beam and used a pore network flow model to simulate the flow of gas, liquid,or their mixture in both micro and nano-pores, and their results showed that, for a strongly hydrophobic MPL containing nano-pores alone, the MPL would act as a buffer to water. Therefore, the preferential structural paths in MPLs, such as cracks, are likely to facilitate significant liquid water transport from the CL to the GDL. J Shenet al[19]numerically studied the effects of perforations on a GDL on mass transfer and found that they could improve the performance of a PEMFC. N Geet al[20]developed a one-dimensional model to investigate the relationship between liquid and vapor transport through a cathode GDL with crack-free MPL and the temperature distributions within a fuel cell. They found that, when the current density was increased from 1.4 to 2.4 A cm-2, MPL breakthrough was observed. Immediately following MPL breakthrough events, the fraction of vapor-phase transport of the total water flux in the MPL increased by up to 5%. Therefore, they believed that the temperature gradient should be considered in two-phase flow and pore network modeling due to its impact on liquid water distributions. M P Arcotet al[21]used optical microscopy and image analysis to identify defects that may lead to failure of PEMFCs under durability tests,and the initial size and shape of defects in the CL at the beginning-of-life (BOL) and end-of-life (EOL) were characterized. They found that the defected area in catalyst coated membrane (CCM) samples increased from approximately 2.4% of the total CL area at BOL to 10.5% by EOL, and CCMs with a large number of cracks in the CL exhibited a voltage loss of 2.55 mV·h-1, while those with thin/missing/empty CL defects exhibited a loss of 1.12 mV·h-1.

Fig.1 Geometric model (a), the computational domain (b) and mesh model (c)
In summary, researchers have characterized the morphology of the cracks in the CLs and MPLs of membrane electrodes, and observed the dynamic characteristics of liquid water flowing through these cracks. It is believed that the presence of cracks is beneficial to the discharge of liquid water from the MEAs, reducing the transmission resistance of oxygen,and improving its diffusion efficiency. However, to our best knowledge, no studies have reported the effects of the size, number, and distribution of cracks on the performance of a MEA. In this study, a twodimensional (2D) model is established to simulate the influence of factors on the performance of a fuel cell containing MEAs, including the diameter, number,and distribution of cracks in the MPL; the effect of the cracks on mass transfer was investigated, and experimental comparison of performance between MEAs with and without cracks was conducted; finally some conclusions were made with respect to the quantitative parameters of cracks, which will help the preparation of controllable cracks in MEAs.
2 Model description
2.1 Model assumption
In this study, we assume the following:
a) The reaction gas is the ideal gas;
b) The GDL, MPL, and CL are all isotropic porous media, and for a 2D model with through plane cross section, it’s reasonable;
c) The water generated in the MEA is gaseous, the ionomer will preferentially absorb it until saturated, the water vapor in the pores of the MEA will accumulate and condense as a liquid after reaching the saturation pressure, and gaseous, membrane, and liquid water can be converted into one other[22].
d) The real cracks in MEAs have complex shape, and one main crack may have branches and different size for different parts, but the liquid water and gas transfer in the pores and cracks in MEAs just follow the capillary pressure and gas diffusion theory respectively[3,8,9]. Therefore, in order to simplify the problem, the cracks in the MEAs can be assumed to be cylindrical holes, and the porosity of the hole area is 1.
Based on the above assumptions, the following model was established.
2.2 Geometric model
The geometric model includes a bipolar cathode and anode, GDL, MPL, CL, and a proton exchange membrane. In this study, we focus on the cracks on the MPL. The porosity of GDL is typically approximately 0.5-0.8, and the diameters of most pores are approximately 3-30 μm[23]. The cracks on the MPL and interconnected pores on the GDL form continuous mass transfer channels, and are represented as fully cylindrical holes, as shown in Fig.1. The geometric and mesh models are shown in Fig.1. A grid sensitivity was performed with several levels of grid refinement, and it was determined that adequate resolution is provided by grid consisting of 12 500 elements used for all simulations.
2.3 Mathematical model
Details regarding the basic equations of mass and heat transfer, and the electrochemical reactions inside PEMFCs can be found in previous studies[3,19-20,24].
In MEAs, cracks mainly exist to efficiently remove liquid water and improve the diffusion efficiency of oxygen. To simplify the analysis, the conservation equations of gas species and liquid water are listed below. As it is a 2D problem, the gas flow in the flow channel is not solved, and the related convection term in the other equations can be neglected.
Species conservation:

whereYiis concentration of componenti,Siis the source term of componenti; ρgis the gas density,is the effective diffusion coefficient of gas componenti, which is related to porosity and saturation of liquid water:

whereDiis the diffusion coefficient of componentiunder a certain temperature and pressure, ε is the porosity of porous media,slqis the liquid water saturation.
Liquid water conservation:

where ρlqis the liquid water density,Slqis the source term of liquid water, and the liquid water diffusion coefficientDlqis related to the effect of the capillary pressure differential[8,9,24,25]; therefore:

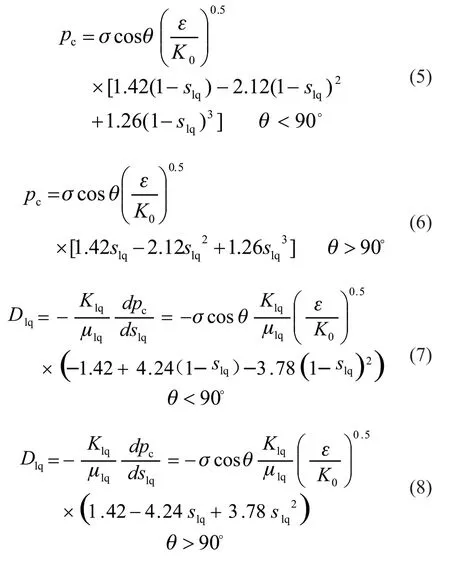
where μlqis the dynamic viscosity of liquid water,respectively,is the permeability of the rates of liquid water, respectively,Xvpis the volume fraction of water vapor,pgandTare gas pressure and temperature,Risidealgas constant,MH2Oisthe molecular weightof water, andpsatis thesaturated vapor pressure of water:liquid water, andK0is the intrinsic permeability of the porous media:
Conversion between vapor and liquid water
At a certain temperature, when the partial pressure of water vapor exceeds its local local saturated pressure, the vapor will condense into liquid water;otherwise, the liquid water becomes vapor. Therefore,the relationship between vapor and the liquid water is as follows:

The above formula is the source term of Eq.(3).γcondand γevapare the condensation and evaporation

Boundary conditions and numerical procedures
Both the left and right sides of the model use periodic boundary conditions. The reaction gas temperature is 75 ℃, and the inlet pressure is 150 kPa.It is assumed that liquid water can be removed in time at the gas inlet; therefore, the saturation at the inlet is zero. The geometric parameters, material properties,and other parameters used are listed in Tables 1 and 2.

Table 1 Geometric parameters of the present model
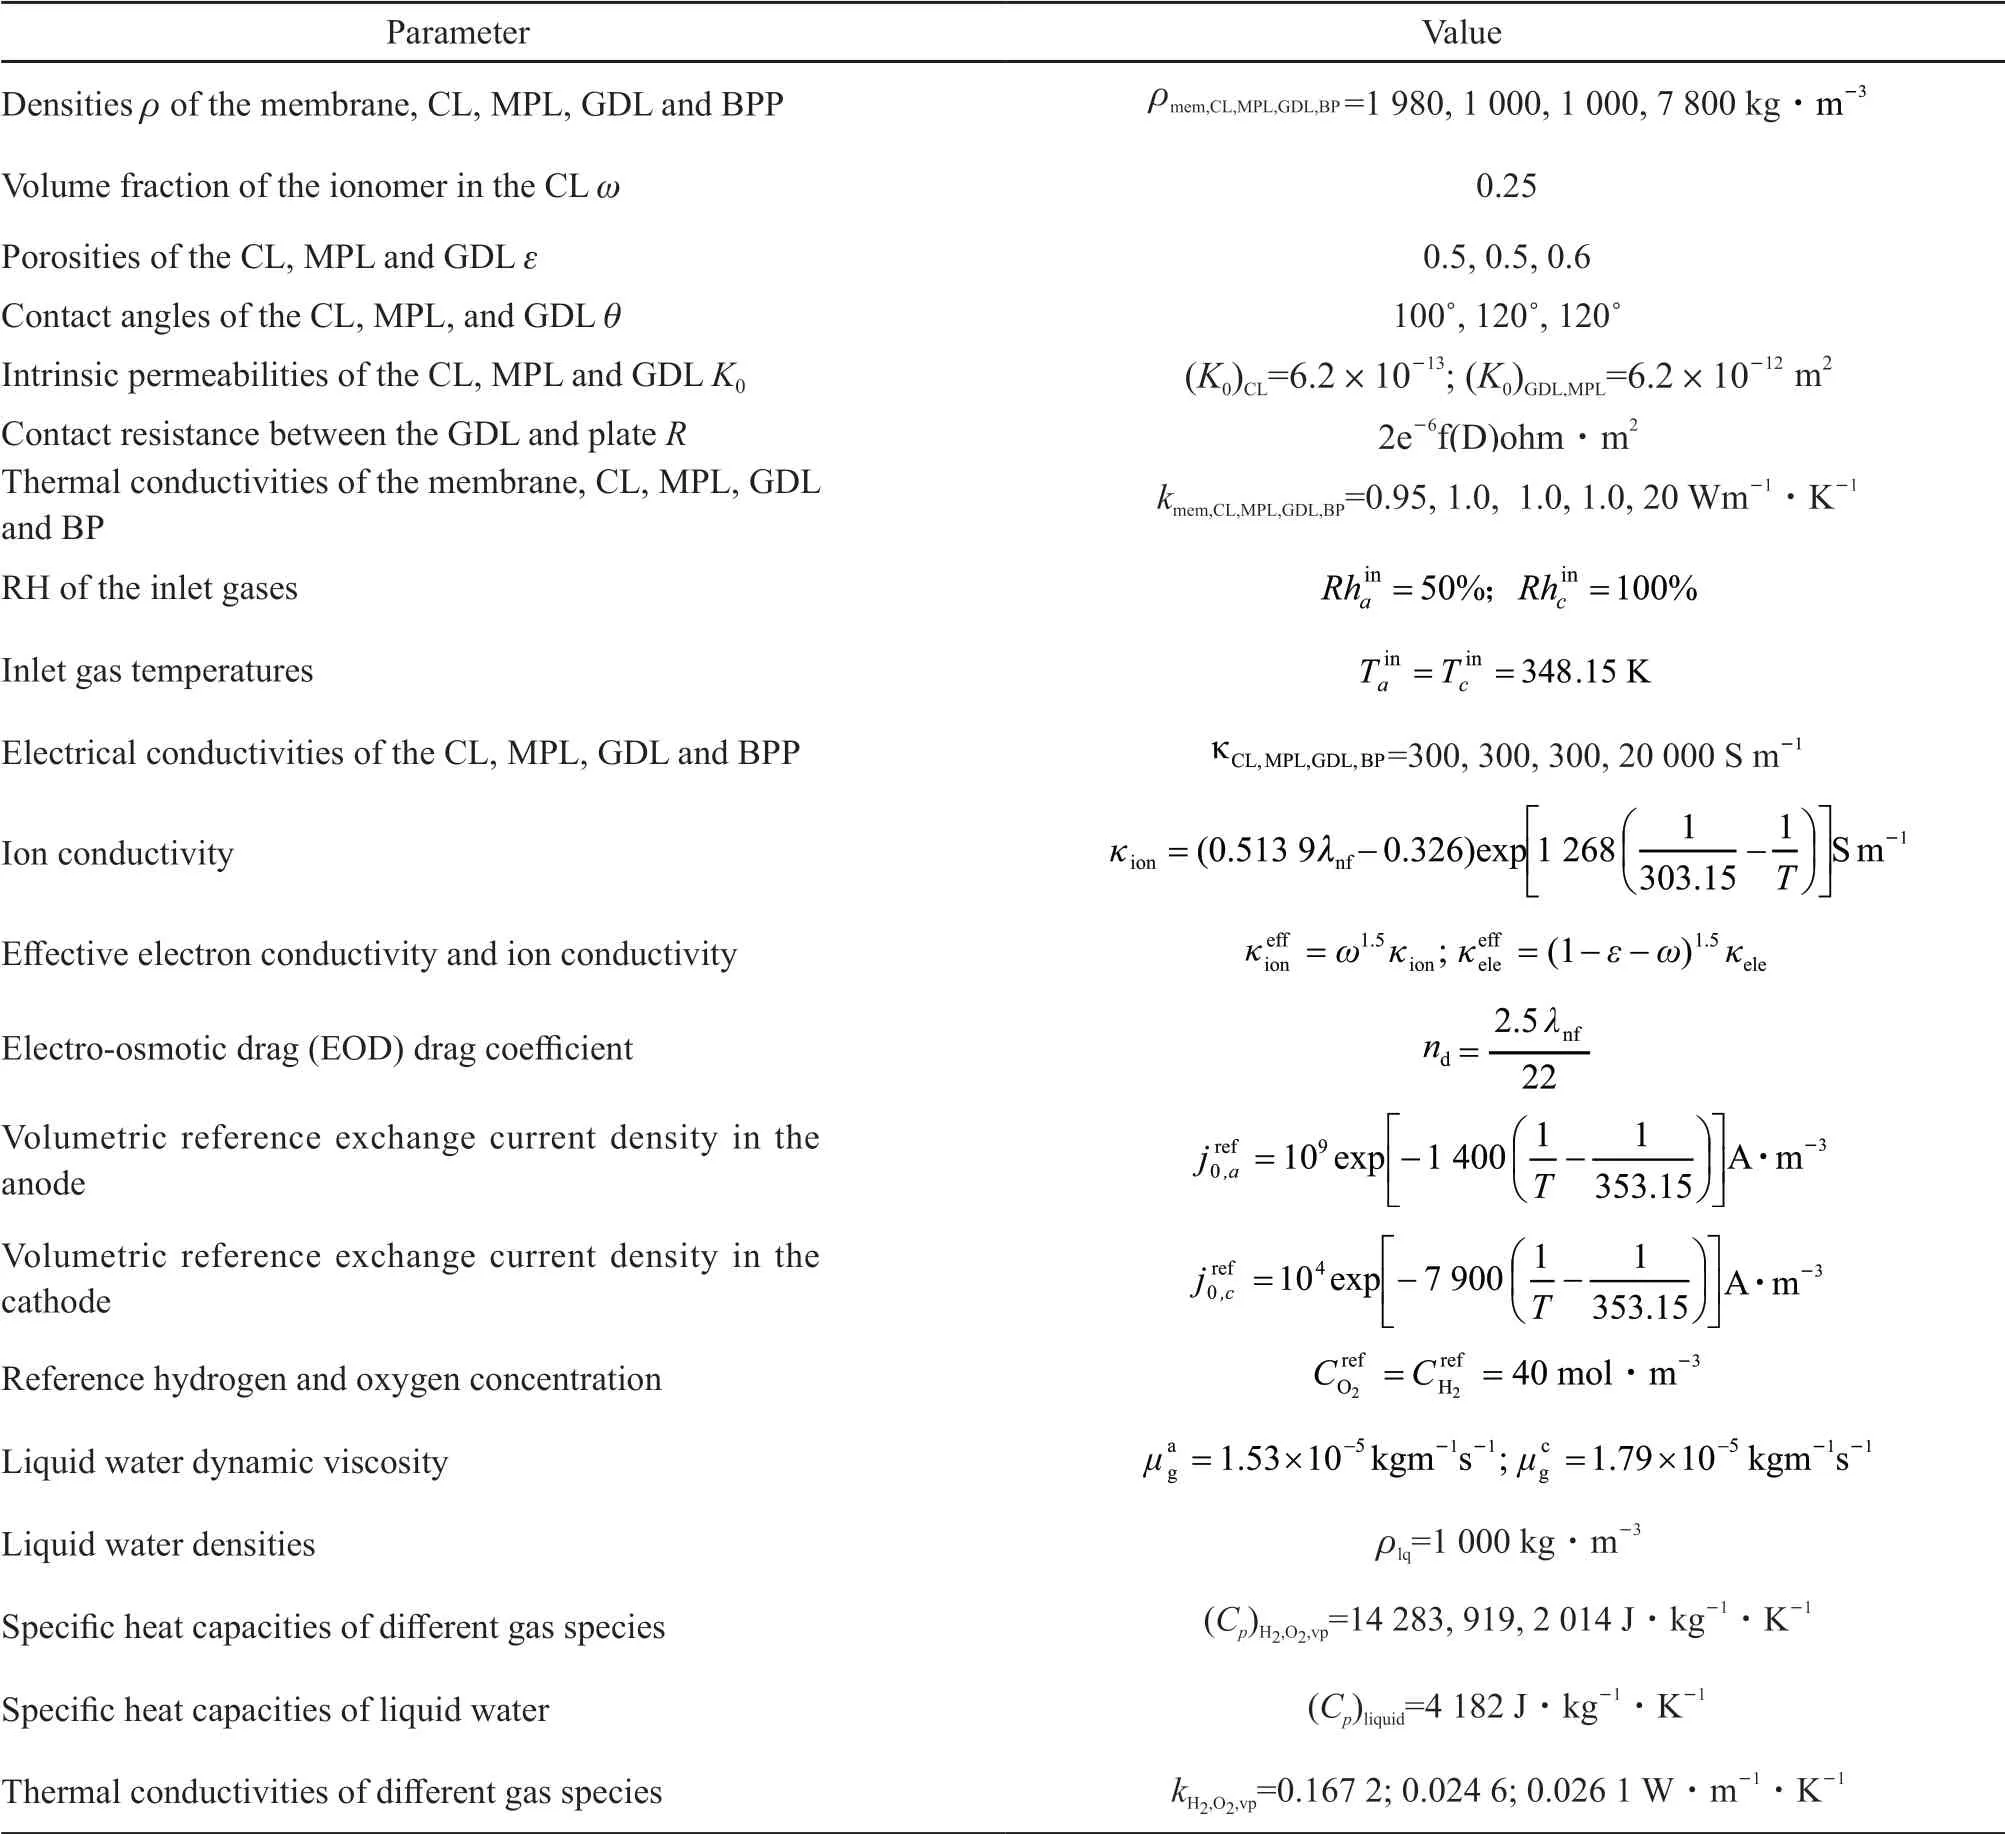
Table 2 Material properties[4,5,8,9]
The model was solved using the commercial software Comsol Multiphysics 5.2. The transient solver was adopted with an adaptive time step; minimum and maximum time step sizes of 10-4and 0.1 s were used. The MUMPS algorithm was used to improve the convergence of the solution, and the convergence accuracy of all variables was set with a tolerance of 10-5.
3 Results and discussion
3.1 Influence of operating voltage
Fig.2 compares the different physical variable distribution in the MEAs with cracks of 30 μm diameter and without cracks. The cathode inlet oxygen concentration was 15.6% with 100% humidity, the cell temperature was 75 ℃, and the voltage was 0.4 V. Figs.2(a) and 2(b) compare the liquid saturation distribution; Figs.2(c) and 2(d) compare the oxygen concentration distribution; Figs.2(e) and 2(f) compare the water vapor concentration; Figs.2(g) and 2(h)compare the membrane state water distribution.Liquid water was generated in the catalytic layer of the cathode, and then gradually diffused to the MPL and GDL. When a crack was present, liquid water transported through the crack more easily under the action of capillary pressure, which reduced the liquid saturation in the adjacent regions of the MPL and GDL.The aggregation of liquid water in the catalytic layer beneath the crack was reduced, and the average liquid water saturation of the two CLs were 0.101 and 0.087(Figs.2(a) and 2(b)), indicating that the cracks alleviated the liquid water in the CL, to an extent. In Figs.2(c)and 2(d), the isoline of the oxygen concentration distribution protrudes towards the diffusion front when a crack is present, which is due to the good oxygen diffusion of the crack. The oxygen concentration in the catalytic layer was 1.18 mol·m-3, which was 3.37 times higher than the concentration of 0.27 mol·m-3achieved without cracks. Additionally, the amounts of vapor and membrane water in the membrane electrode with the cracks were slightly reduced. Finally the current densities at a voltage of 0.4 V were 2 300 and 2 127 mA· cm-2for fuel cells of MEAs with and without cracks respectively, increased about 8.1%
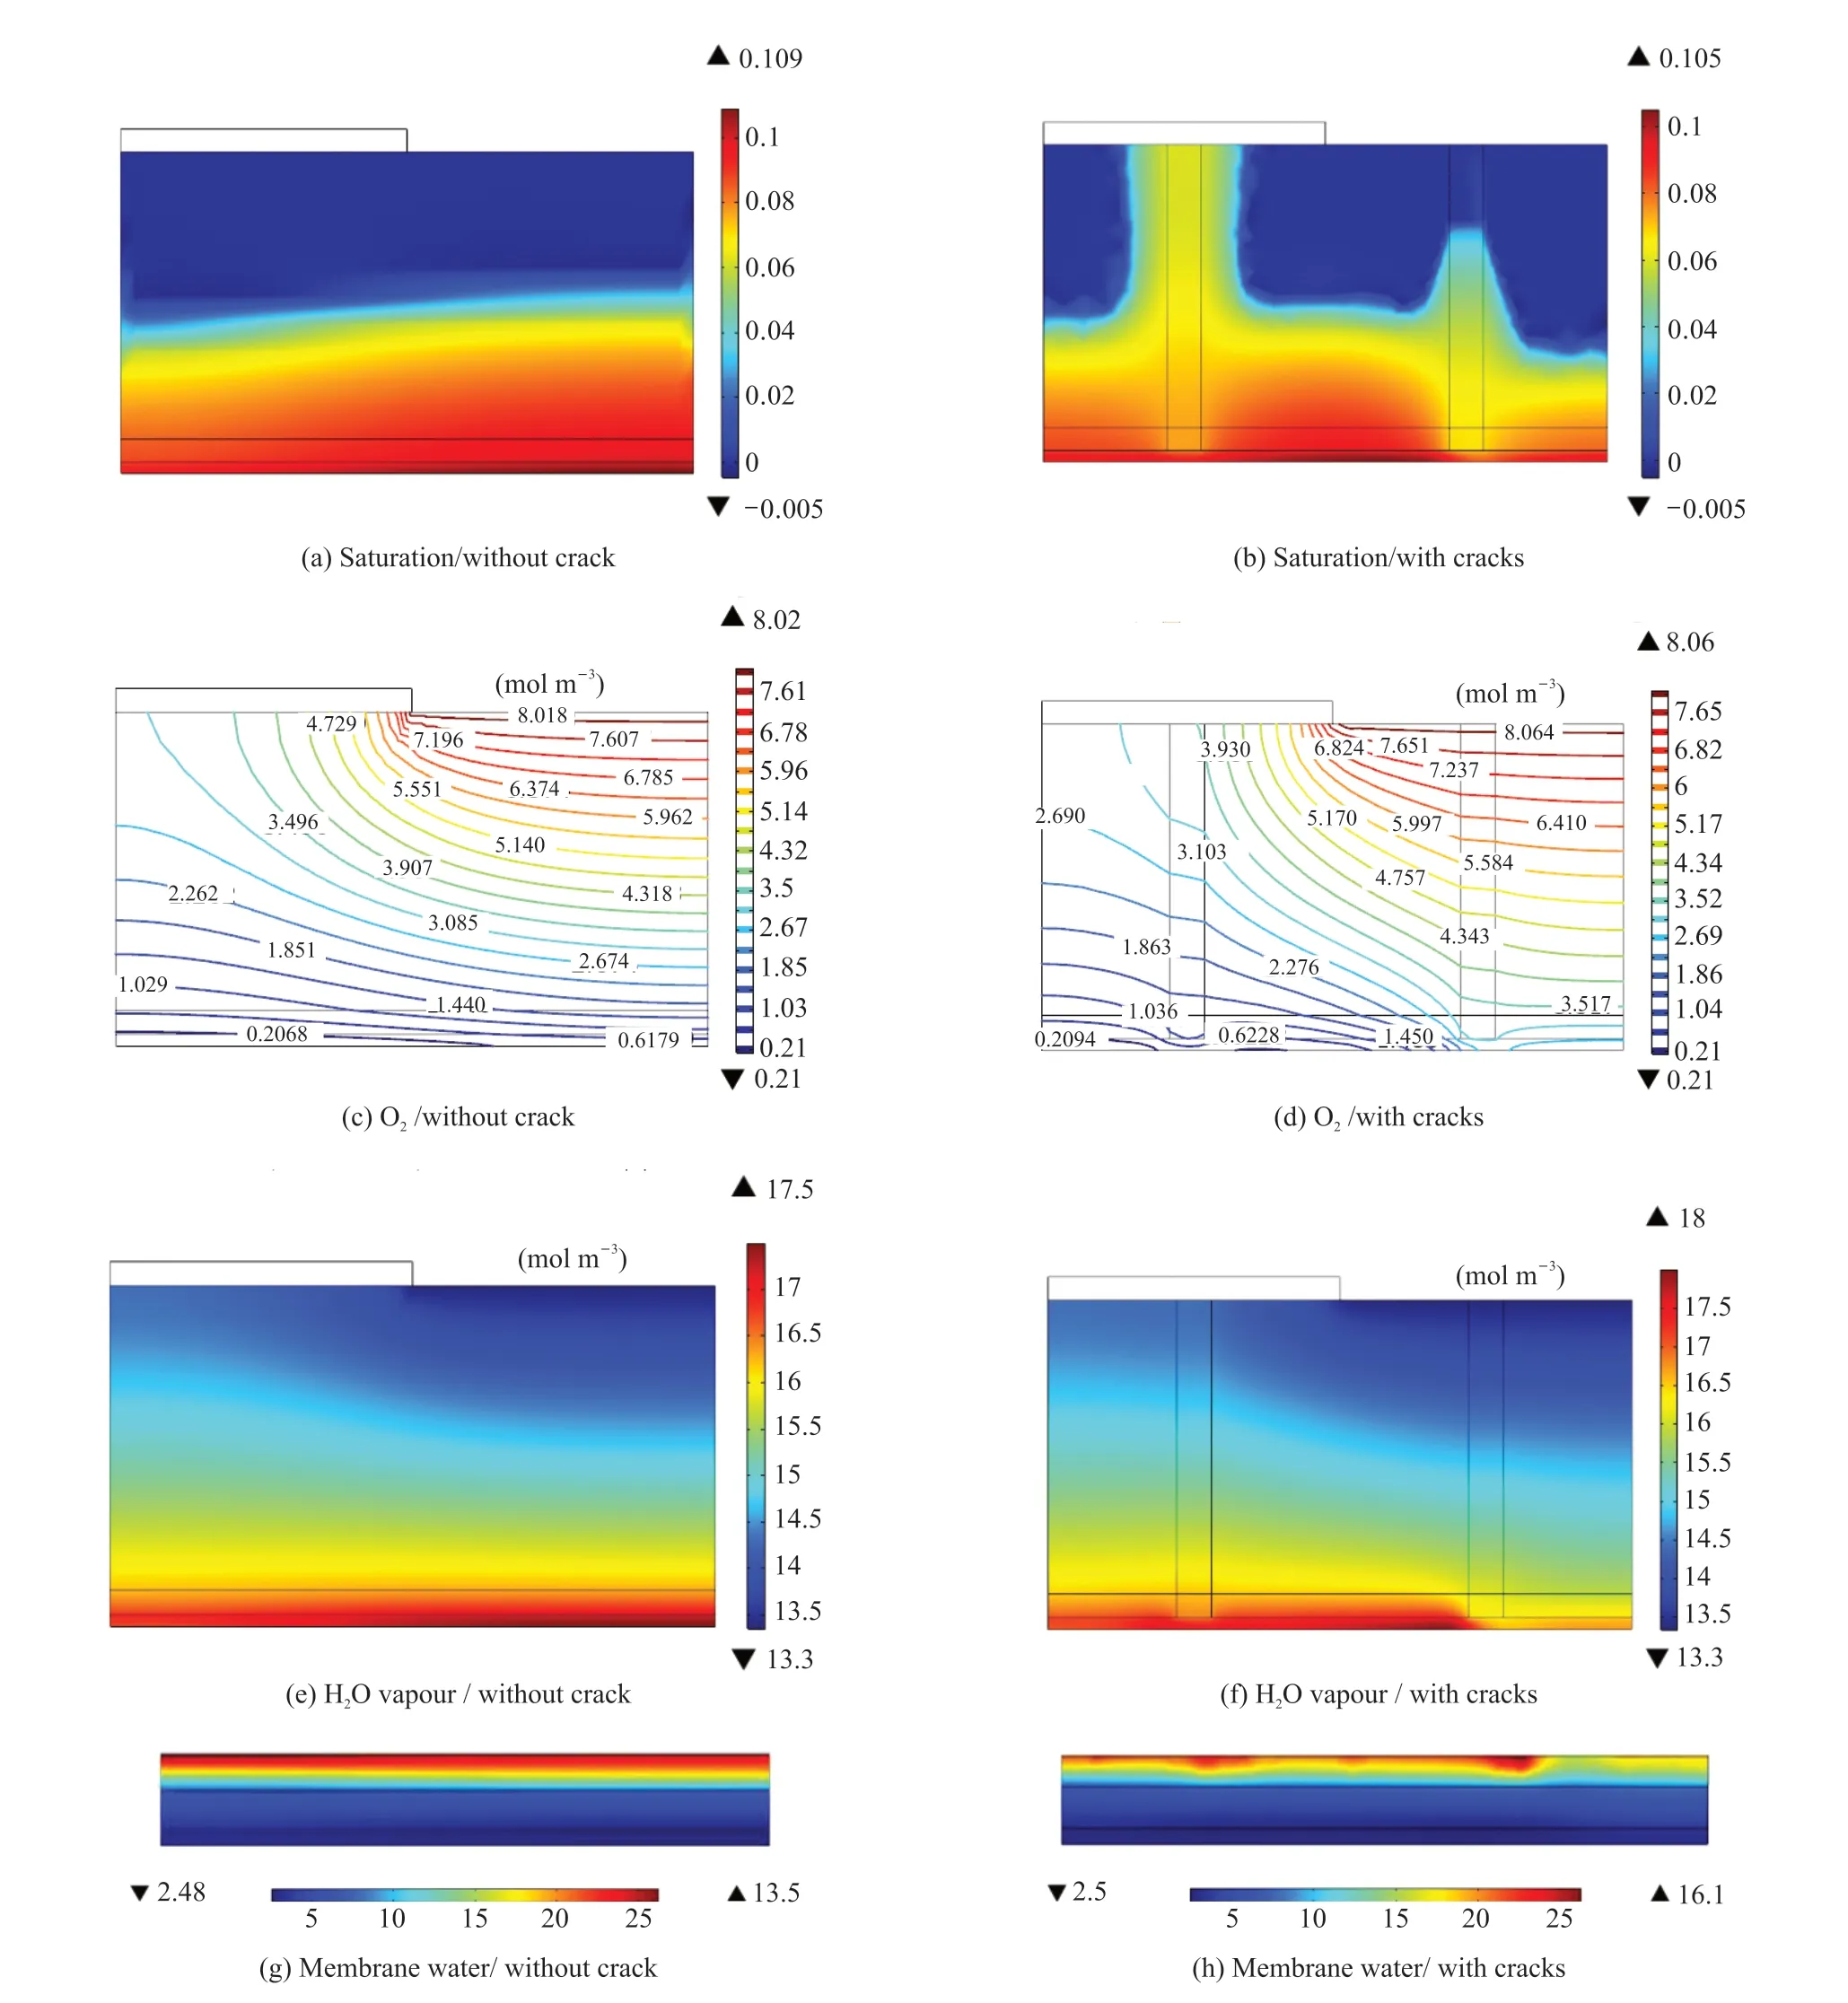
Fig.2 Distribution of physical properties in the MEAs with cracks of D=30 μm and without cracks at an inlet molar oxygen concentration of 15.6%, temperature of 75 ℃, and voltage of 0.4 V: liquid saturation (a), oxygen concentration (c), water vapor concentration (e),membrane water (g) in the MEA without crack respectively, while (b), (d), (f) and (h) show the corresponding physical parameter distributions in the MEA with cracks respectively
Figs.3(a-d) and 3(e-h) show the distribution of the liquid water saturation and oxygen concentration with and without cracks at the cell voltage of 0.85 and 0.7 V, respectively. Similar to the above analysis,the presence of cracks could strengthen the diffusion of oxygen by improving the removal of liquid water.However, the distribution of the oxygen concentration from the channel inlet to the CL was relatively even,as shown in Fig.3. The effect of the cracks on the oxygen concentration distribution was not clear at higher voltages ( lower current densities), as the electrochemical reaction and oxygen consumption rate were low. Therefore, the speed of oxygen diffusion in the MEA is sufficient for the reaction. The oxygen concentration decreased gradually as the speed of the reaction was faster, which contributed to an oxygen concentration gradient in the cathode CL as the current density increased. Therefore, the effect of the cracks on improving the transportation of oxygen increased at lower voltages (higher current densities).At cell voltages of 0.85, 0.7 and 0.4 V, the oxygen concentration distribution in MEAs without and with cracks were shown in Figs.3(b, d), Figs.3(f, h) and Fig.2(c, d), and the average oxygen concentrations in CLs were 6.29, 3.47, and 0.27 mol/m3without cracks,and 6.71, 4.45, and 1.18 mol m-3with cracks. The oxygen concentrations increased by 7%, 22% and 33.7% respectively. At voltages of 0.85, 0.7 and 0.4 V,the current densities for the fuel cells of MEAs without cracks produced were 510, 1 244 and 2 127 mA·cm-2,and compared with 530, 1 297 and 2 300 mA·cm-2for the fuel cells of MEAs with cracks, they increased by 4.0%, 4.2% and 8.1% respectively. Therefore, the effect of the cracks on improving the transport of oxygen is clearer at a lower voltage or a higher current density.
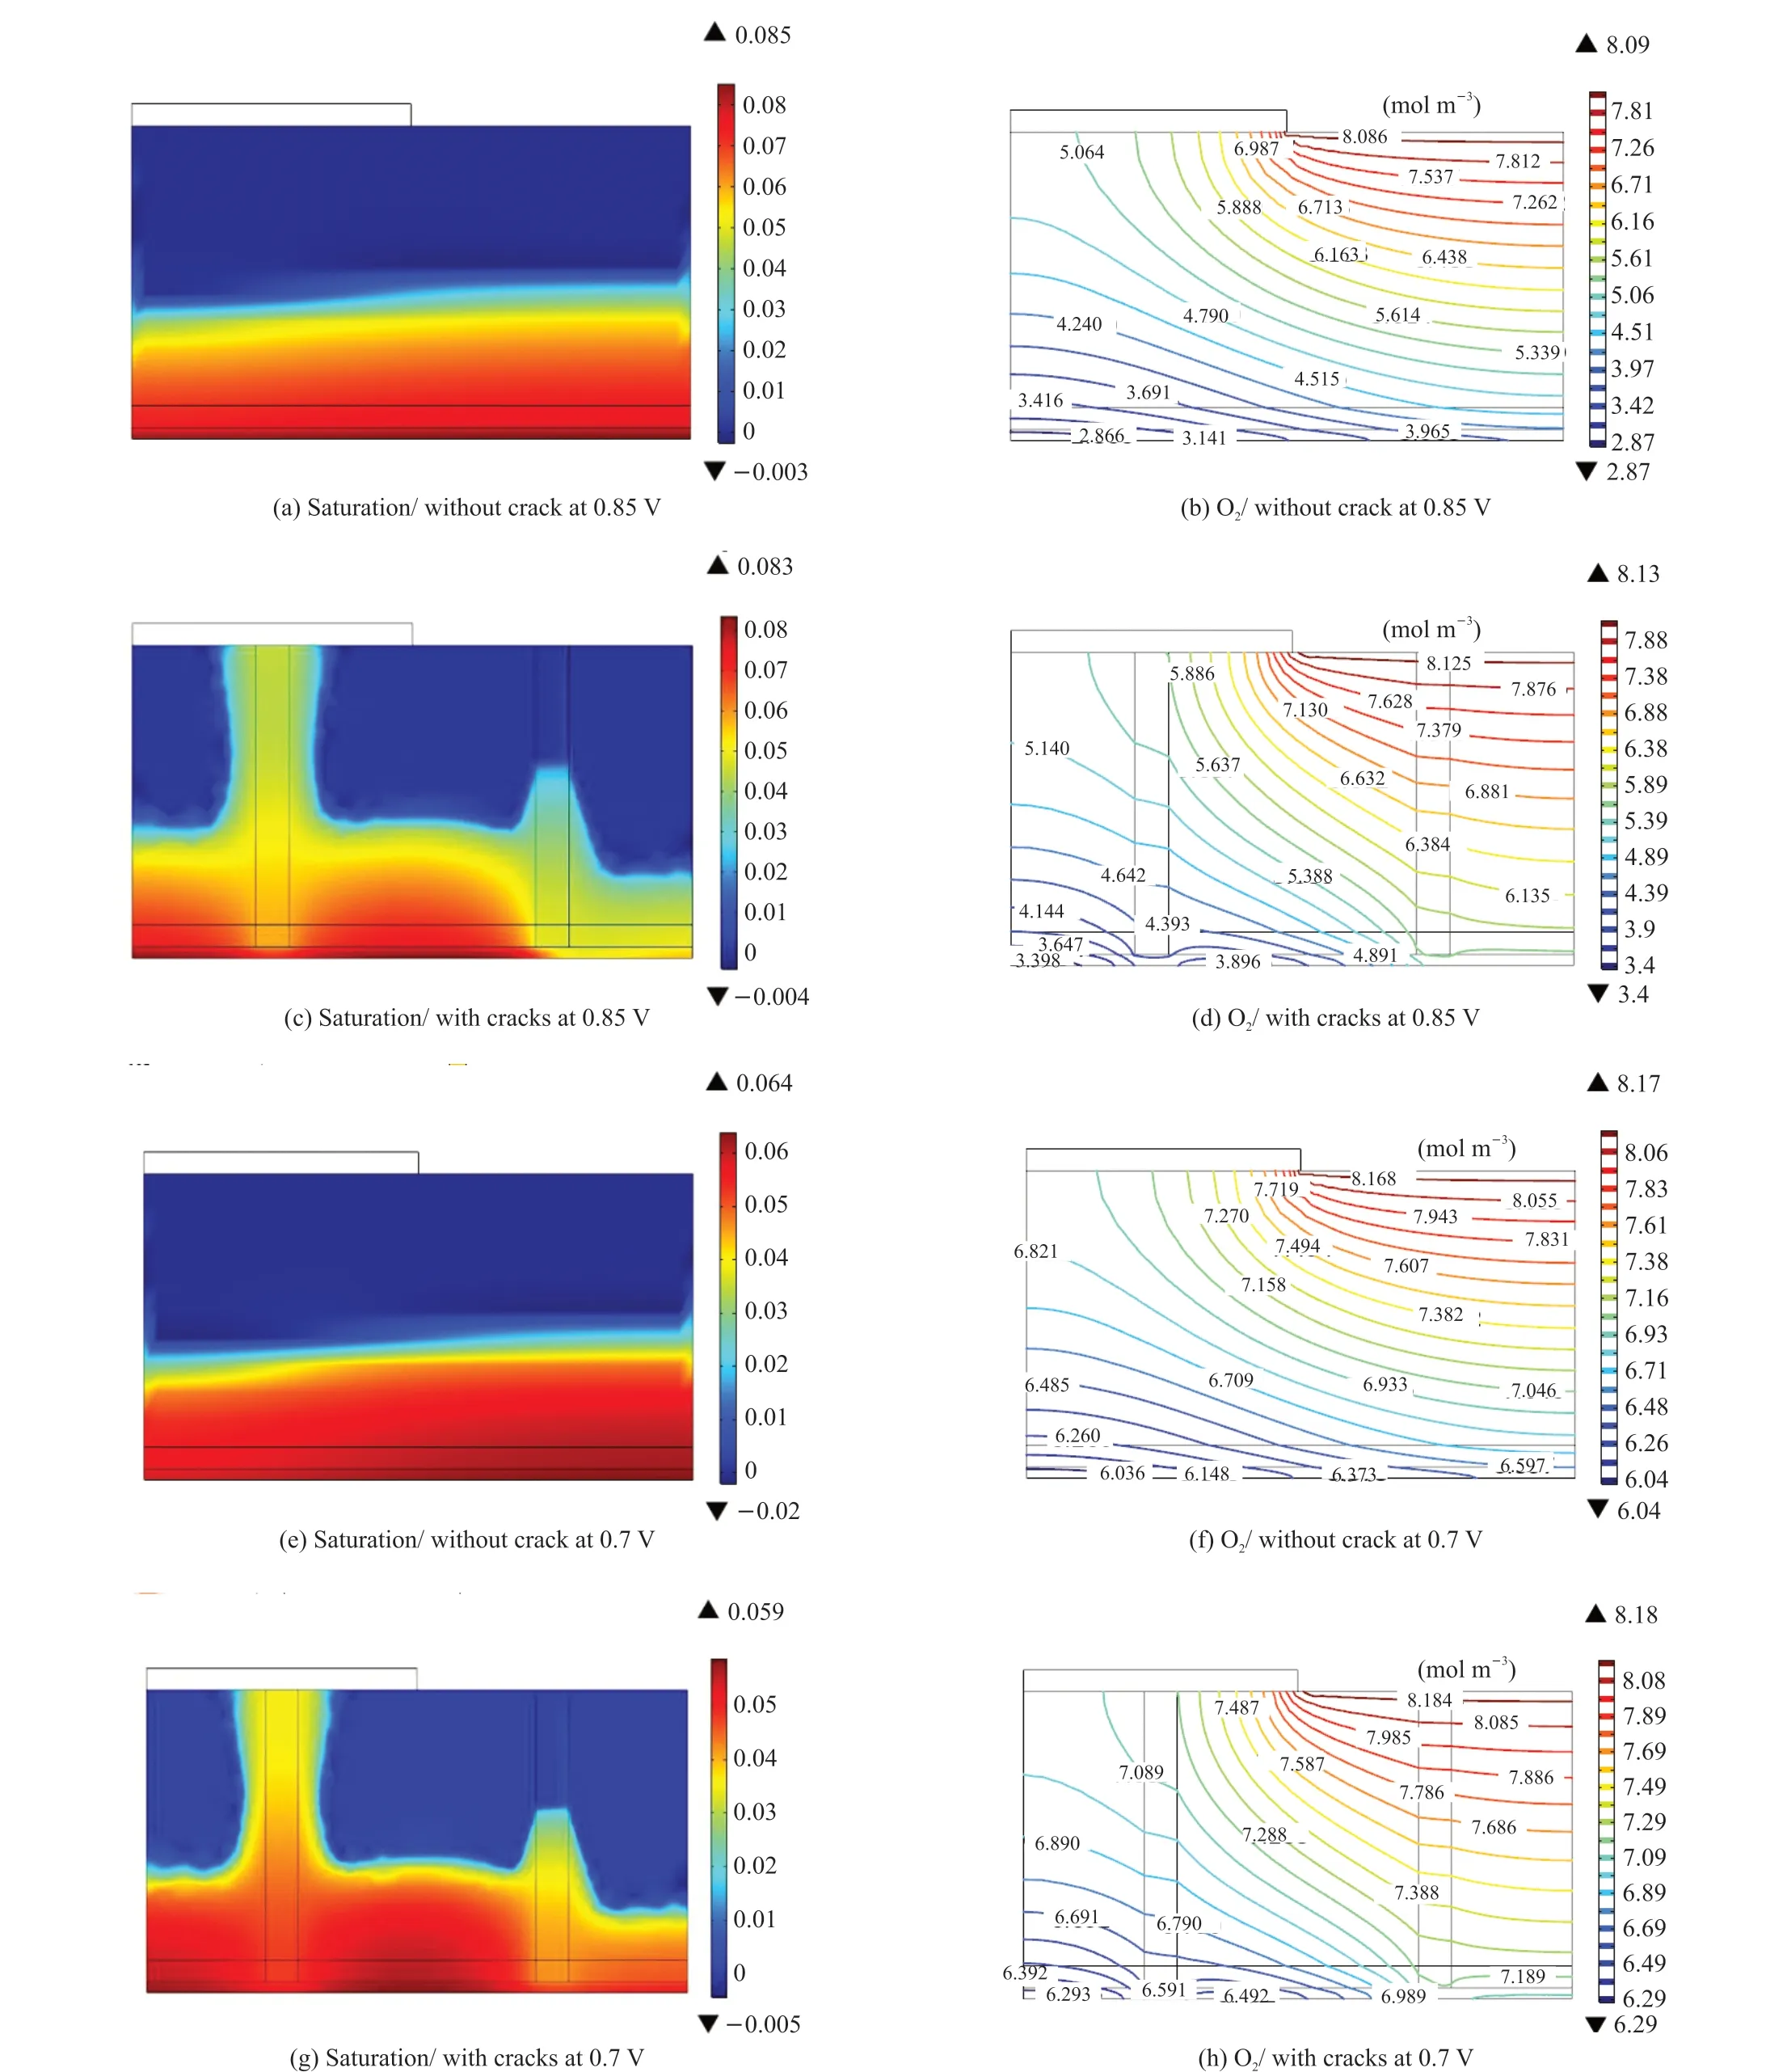
Fig.3 Distribution of the liquid saturation and oxygen concentration of the MEA at (a-d) 0.85 V and (e-h) 0.7 V with and without cracks at an inlet molar oxygen concentration of 15.6%, temperature of 75 ℃
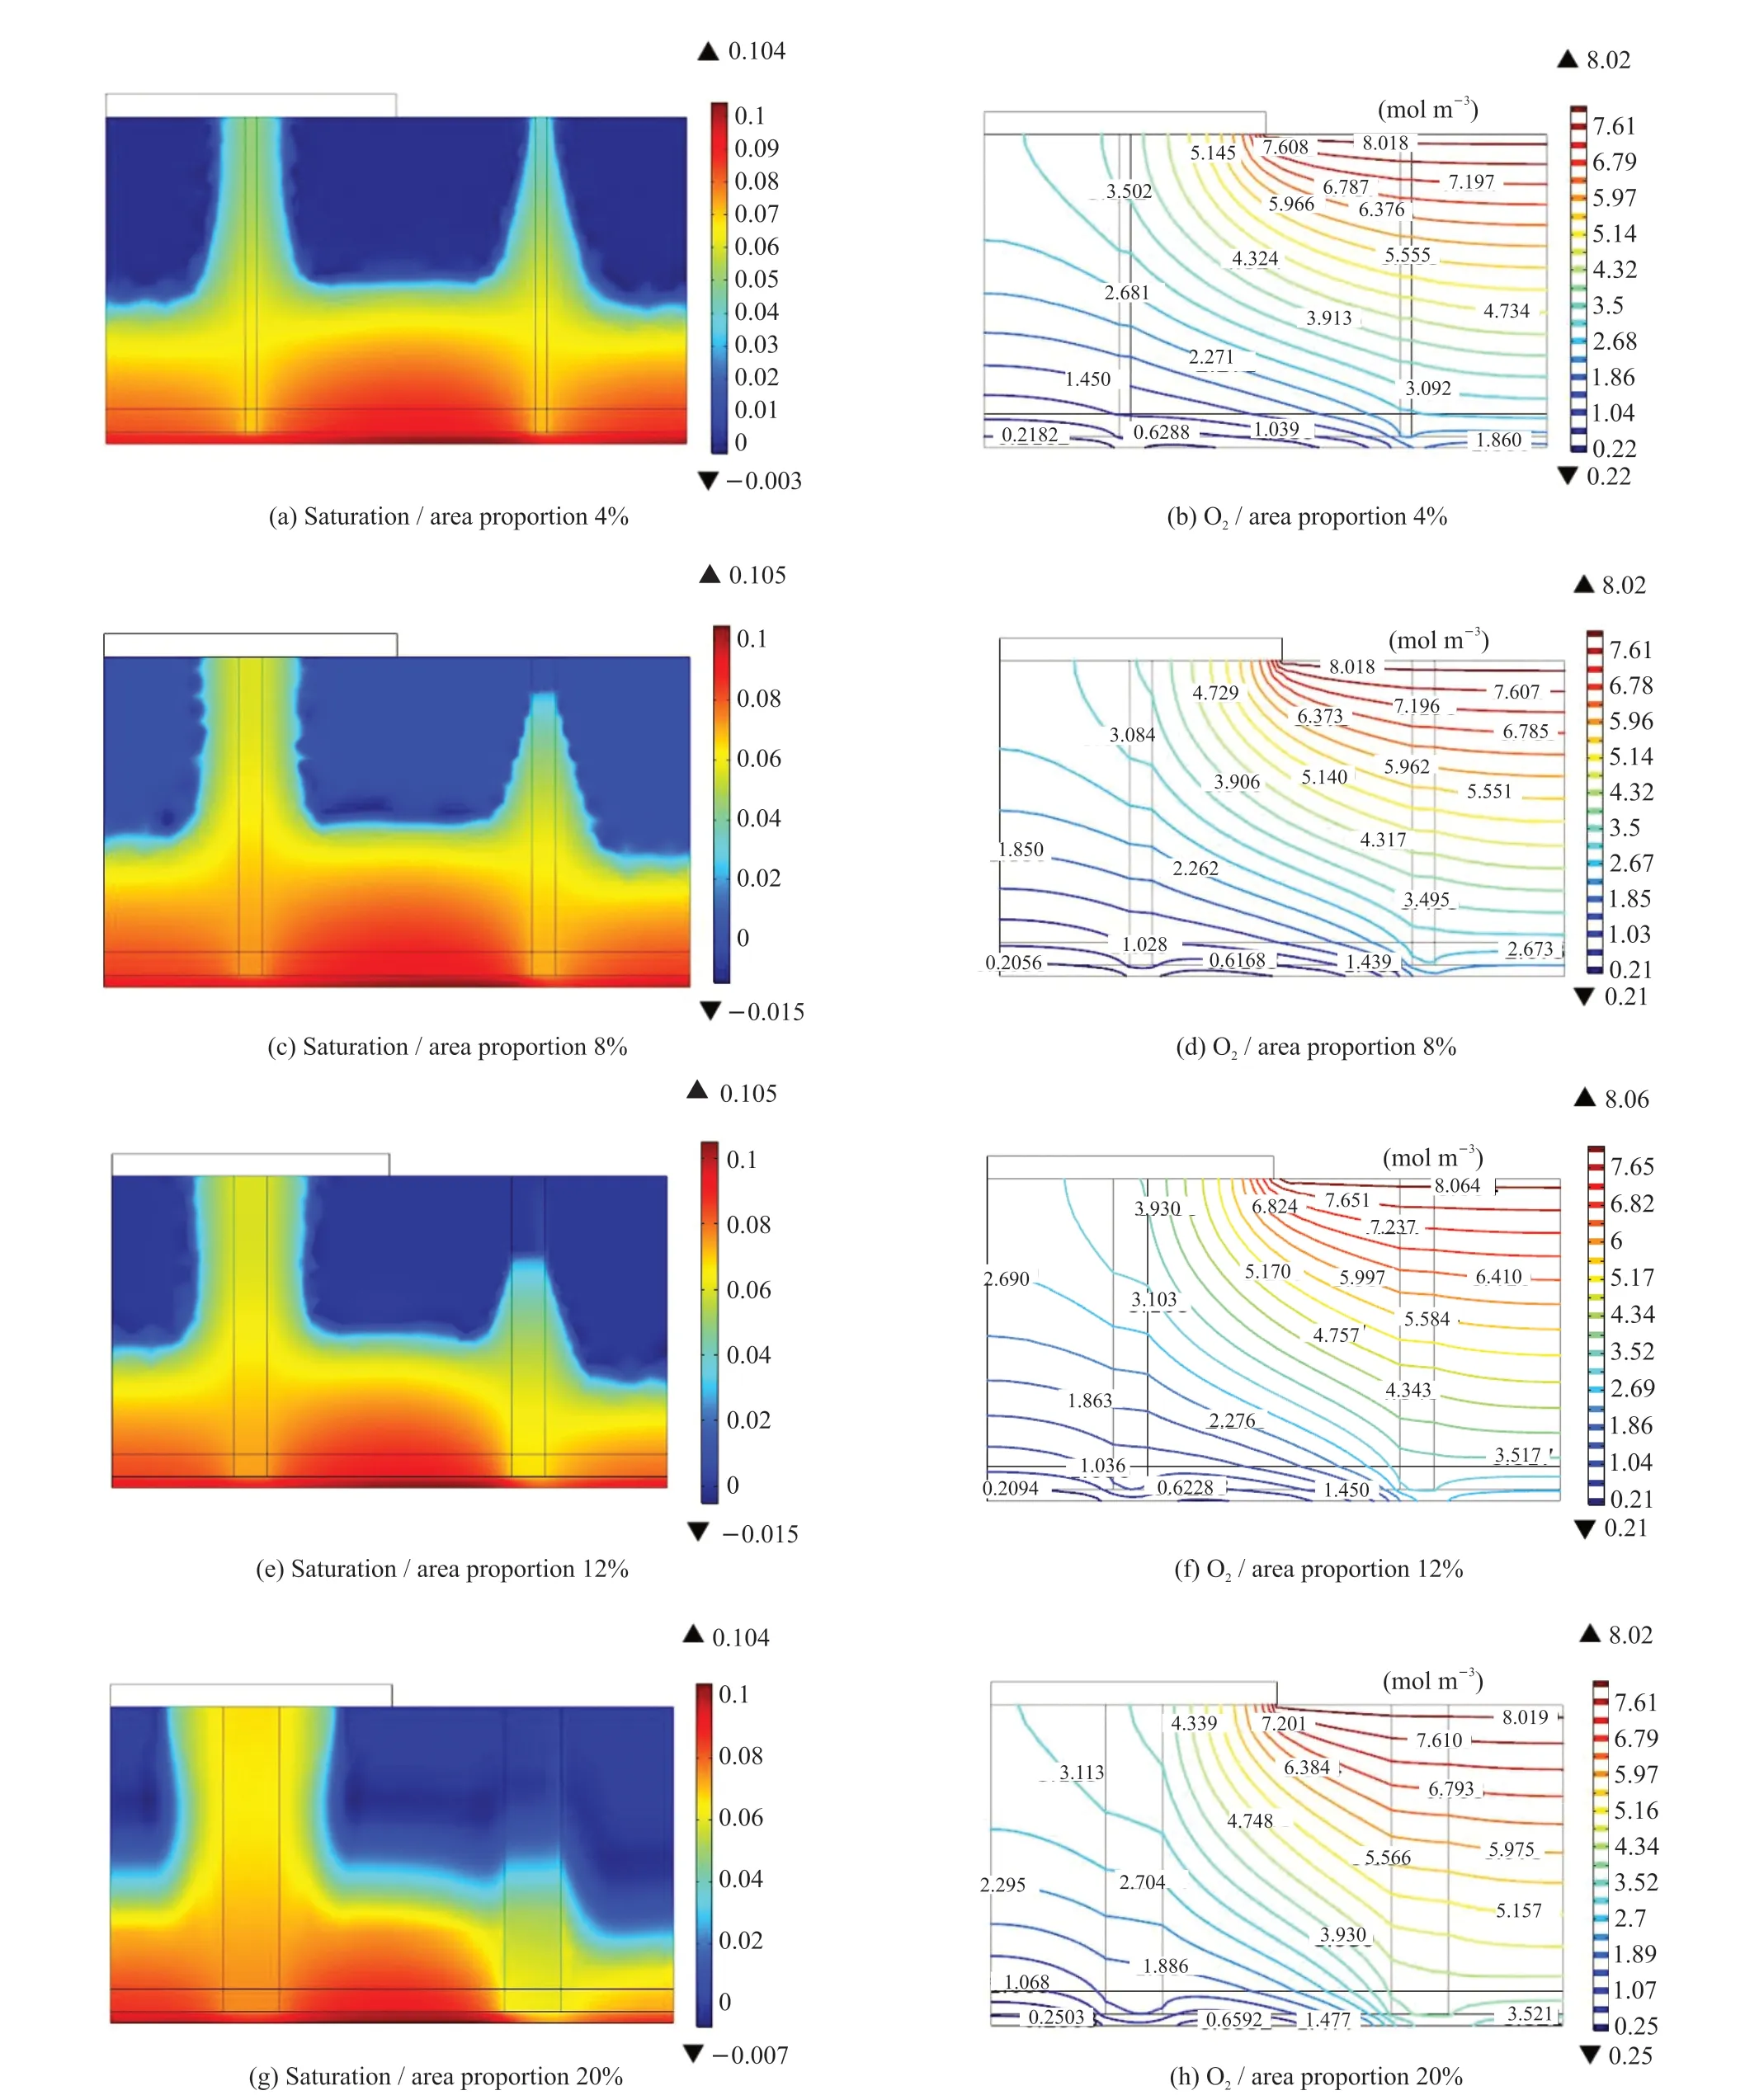
Fig. 4 Distribution of liquid saturation and oxygen concentration of the MEA with different crack area proportions at an inlet molar oxygen concentration of 15.6%, temperature of 75 ℃, and voltage of 0.4 V
3.2 Influence of crack area proportion
The above analysis indicates that the presence of cracks mitigated the accumulation of liquid water in the CL and increased the oxygen concentration of the CL.In the above example, the crack area accounted for 12%of the active area of the MEA. However, cracks caused the conductive area to decrease, thereby increasing the contact resistance between the GDL and bipolar plate.Therefore, a larger crack diameter does not result in better cell performance. To determine the optimal crack area proportion and crack diameter, the following crack diameters and proportions were simulated: 10, 20, 30,and 50 μm, and 4%, 8%, 12%, and 20%, respectively.
Figs.4(a-c-e-g) and 4(b-d-f-h) show the distribution of the liquid saturation and oxygen concentration in the cathode MEAs under different crack area proportions, respectively. Eq.(6) and (8)suggest that the smaller the capillary radius, the higher the diffusion rate of liquid water in the capillary, and the higher the height of liquid water in the capillary.The distribution of liquid water beneath the flow channel in Figs.4 (a-c-e-g) follows this pattern;however, beneath the bank, the effect of crack capillary drainage was limited by the bank. Furthermore, the drainage effect of cracks is more significantly affected by the crack diameter. As the crack area increased,the saturation of liquid water in the adjacent areas in the MEA significantly decreased, the oxygen concentration in the adjacent areas of the crack beneath the flow channel inlet significantly increased, and that beneath the bank increased slightly. Therefore, the average oxygen concentrations in the CL were 0.638,0.921, 1.691, and 1.78 mol·m-3. The average oxygen concentration of the CL was 0.269 mol/m3without cracks (Fig.2(c)), indicating that the effect of the presence of cracks was significant, as shown in Fig.4(bd-f-h).
Fig.5 shows the cell performance with different crack area proportions. There was almost no difference in the cell performance between MEAs with and without cracks at a lower current density. The effect of the cracks on improving the diffusion of oxygen was clearer at a higher current density. However,when the crack proportion is higher, the conductive area is smaller and the contact resistance is higher;meanwhile, the cracks will remove more water, causing the membrane to become less hydrated, and the cell performance maybe decrease. For the cases studied, the cell with MEA with crack proportion 12% and 30 μm diameter had the best performance.
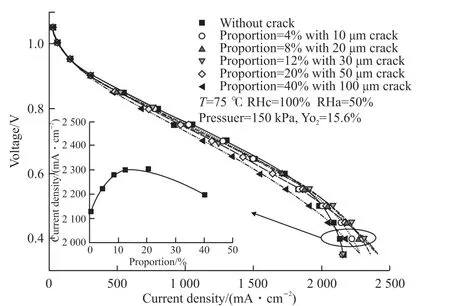
Fig.5 Performance of MEAs with different crack proportions
3.3 Influence of crack diameter
Fig.6 ( a-b-c-d) show the liquid saturation and oxygen concentration distribution in the cathode MEAs of 2 cases, of which the crack area proportions are the same of 12%, but the crack diameters are 15 and 30 μm, and the crack number are 4 and 2 respectively. It is clear that the liquid saturation in the MEA with 4 cracks of 15 μm diameter was significantly lower than that in the MEA with 2 cracks of 30 μm diameter, while the oxygen concentration of the former was higher than that of the latter. Fig.6 (e-f-g-h) present the membrane water and the conductivity of the ionomer in the MEAs of the 2 cases, which show that the ionomer in the MEA with 4 cracks of 15 μm diameter was less hydrated and had lower conductivity than those in the MEA with 2 cracks of 30 μm. Fig.7 shows the performance of the 2 cases. It can be seen the fuel cell with MEA with 2 cracks of 30 μm diameter had better performance than that with 4 cracks of 15 μm diameter.
In summary, for the cases studied in this paper,the MEA had the best performance with cracks of 30 μm diameter and the crack area proportion of 12%.
3.4 Influence of inlet oxygen concentration
Fig.8 shows the distribution of the oxygen concentration at the cathode MEA with and without cracks at inlet oxygen concentrations of 10% and 5%,and a cell voltage of 0.4 V. This figure was compared with Figs.2 and 3, which show the oxygen distribution of the MEA at an inlet oxygen concentration of 15.6%.Regardless of the inlet oxygen concentration, the current density was relatively high at 0.4 V. The current densities at oxygen concentrations of 5%, 10%, and 15.6% without cracks were 840, 1 500, and 2 130mA·cm-2, respectively; while the corresponding current densities with cracks were 1 030, 1 760, and 2 300 mA·cm-2, and the operating current density for MEAs with cracks increased by 8.2%, 16.9% and 21.2%respectively compared with MEAs without cracks. The liquid water drainage effects and then enhancement of oxygen diffusion of cracks were clear.
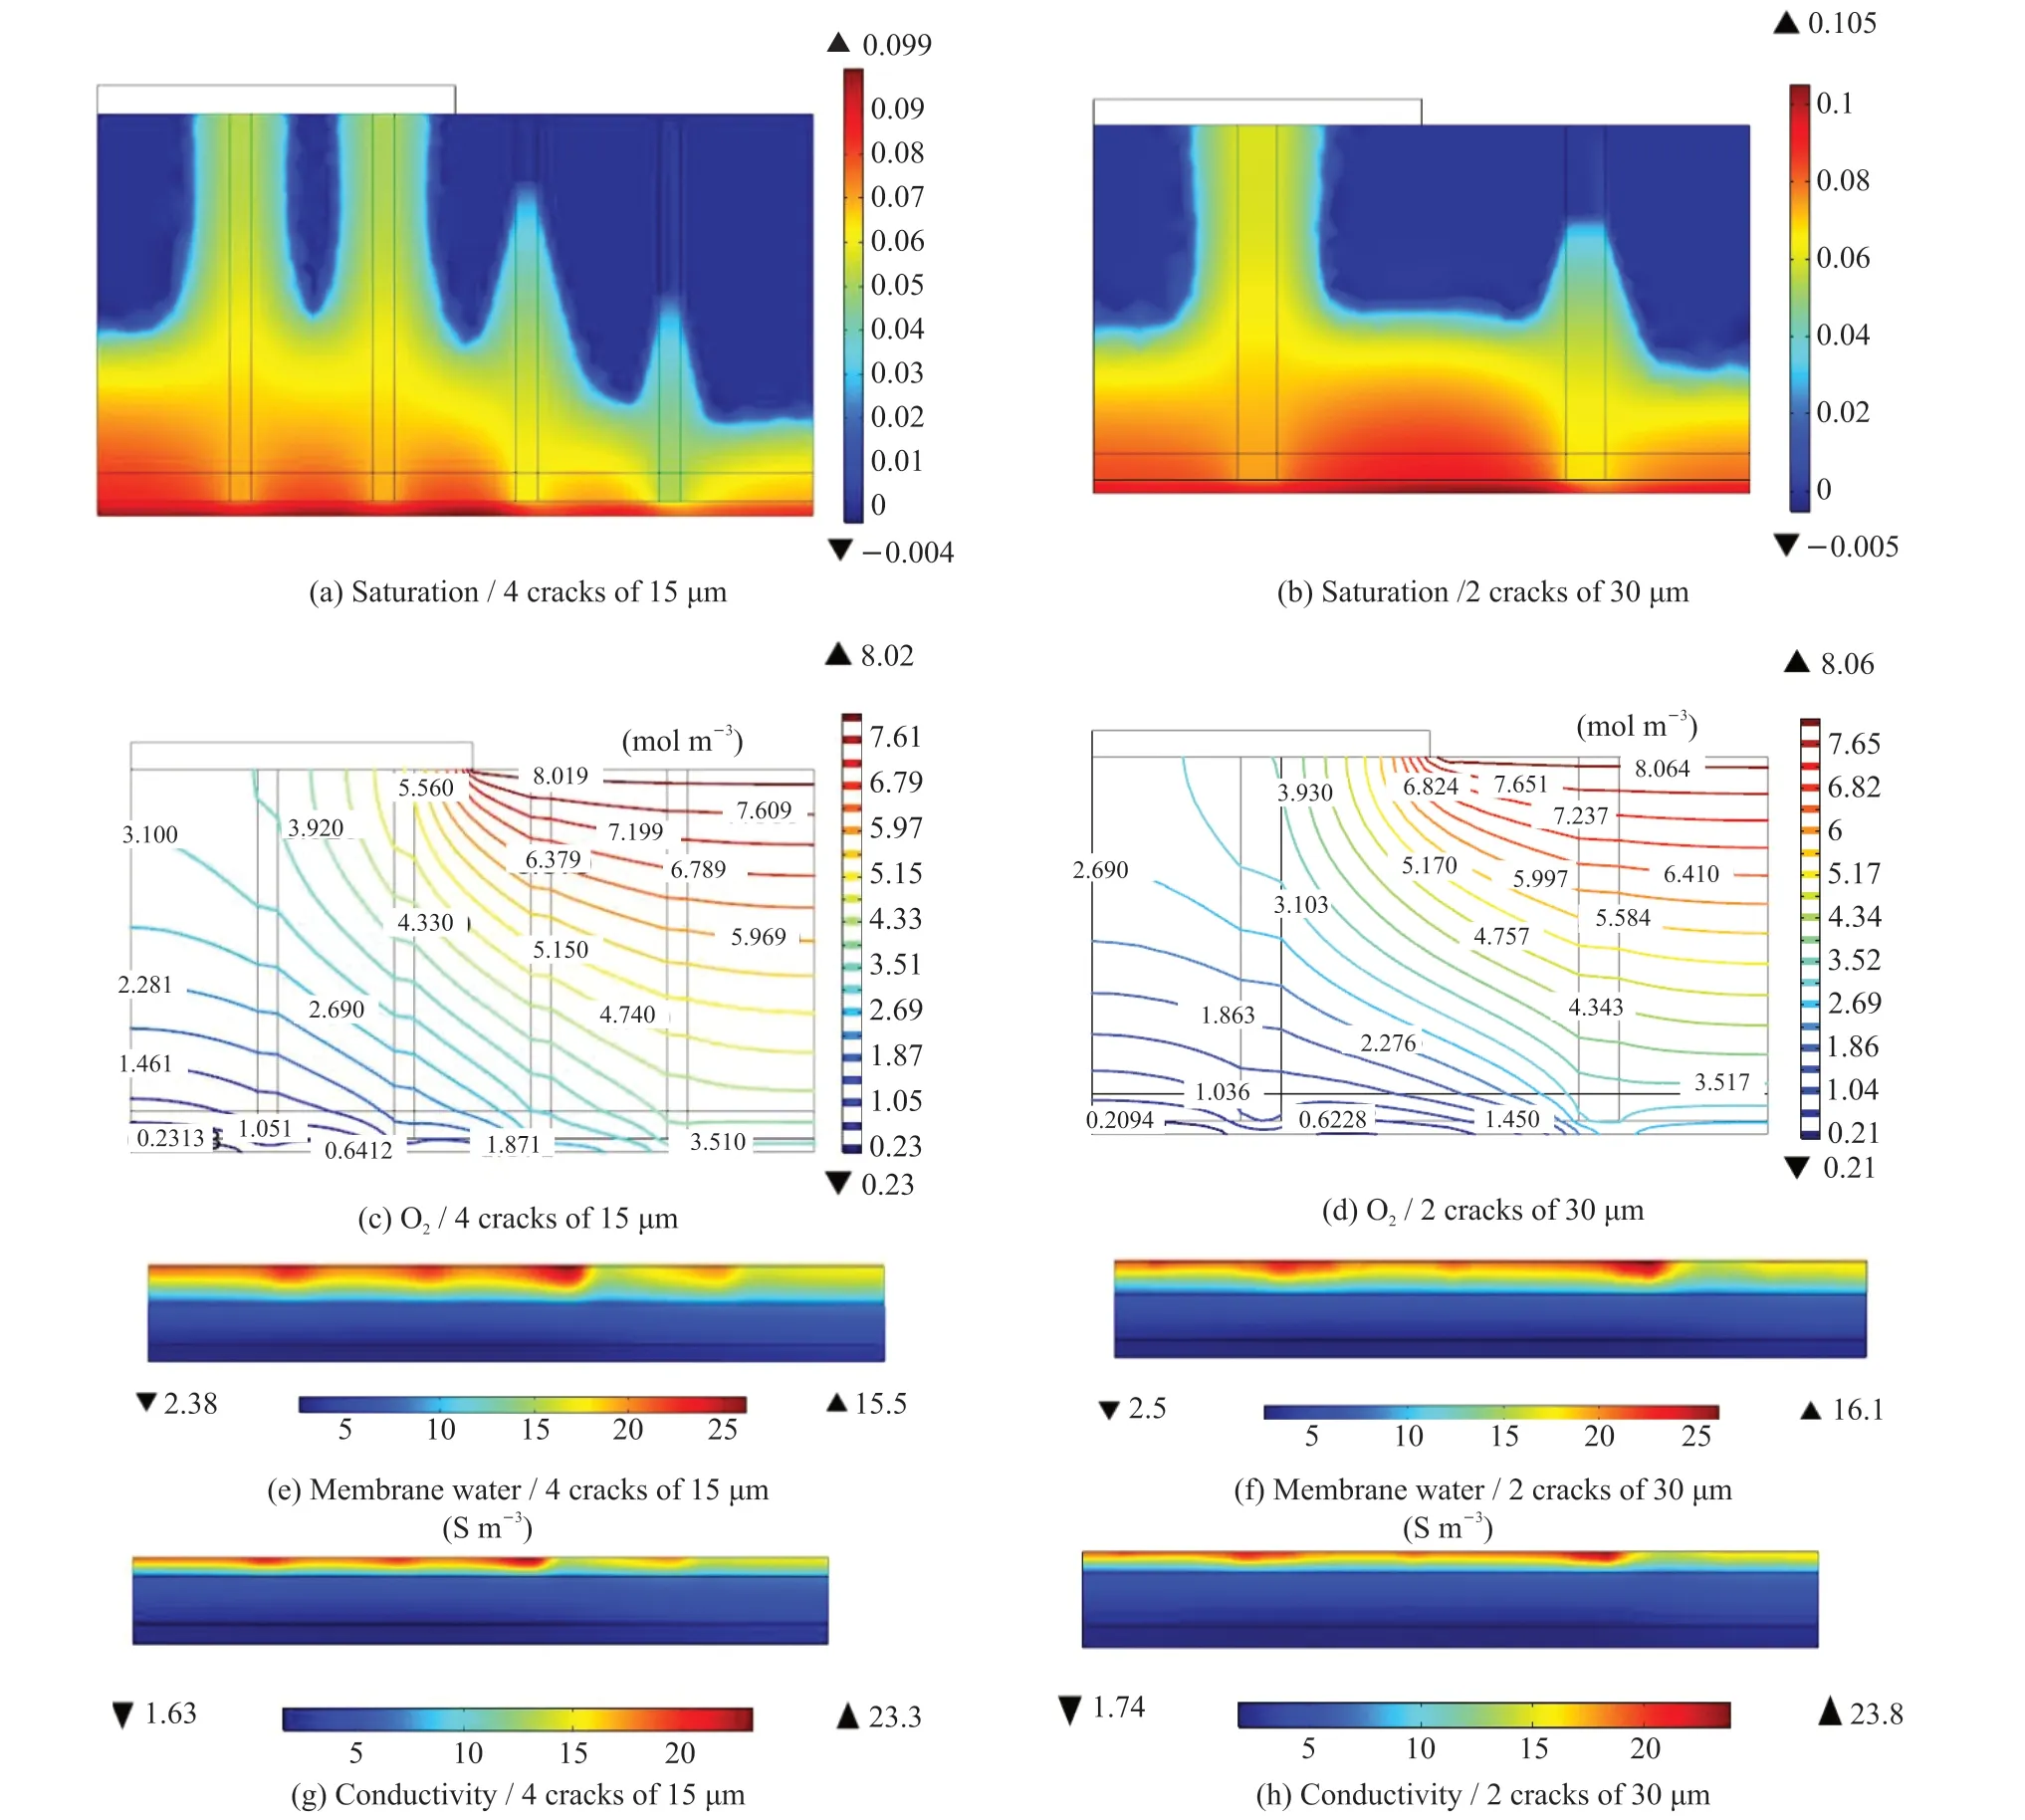
Fig.6 Distribution of liquid saturation (a, b), oxygen concentration (c, d), membrane water (e, f), and electrolyte conductivity (g, h) in the MEAs with different crack diameters at an inlet molar oxygen concentration of 15.6%, temperature of 75 ℃, current density of 2 170 and 2 300 mA·cm-2
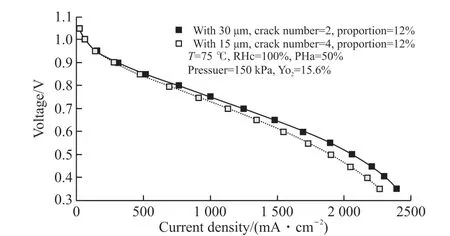
Fig.7 Performance of MEAs with cracks of different diameters
Fig.9 shows the performance of fuel cells of MEAs with and without cracks under different inlet oxygen concentrations. Regardless of the presence or absence of cracks, the performance improved significantly as the oxygen concentration increased.Under the same oxygen concentration, the effect of cracks was not significant at low current densities.However, as the current density increased, the mass transfer effect of the cracks gradually increased.Additionally, as the oxygen concentration increased,the point at which the cracks played a significant role also moved towards a high current density, as shown by the performance curve in Fig.9.
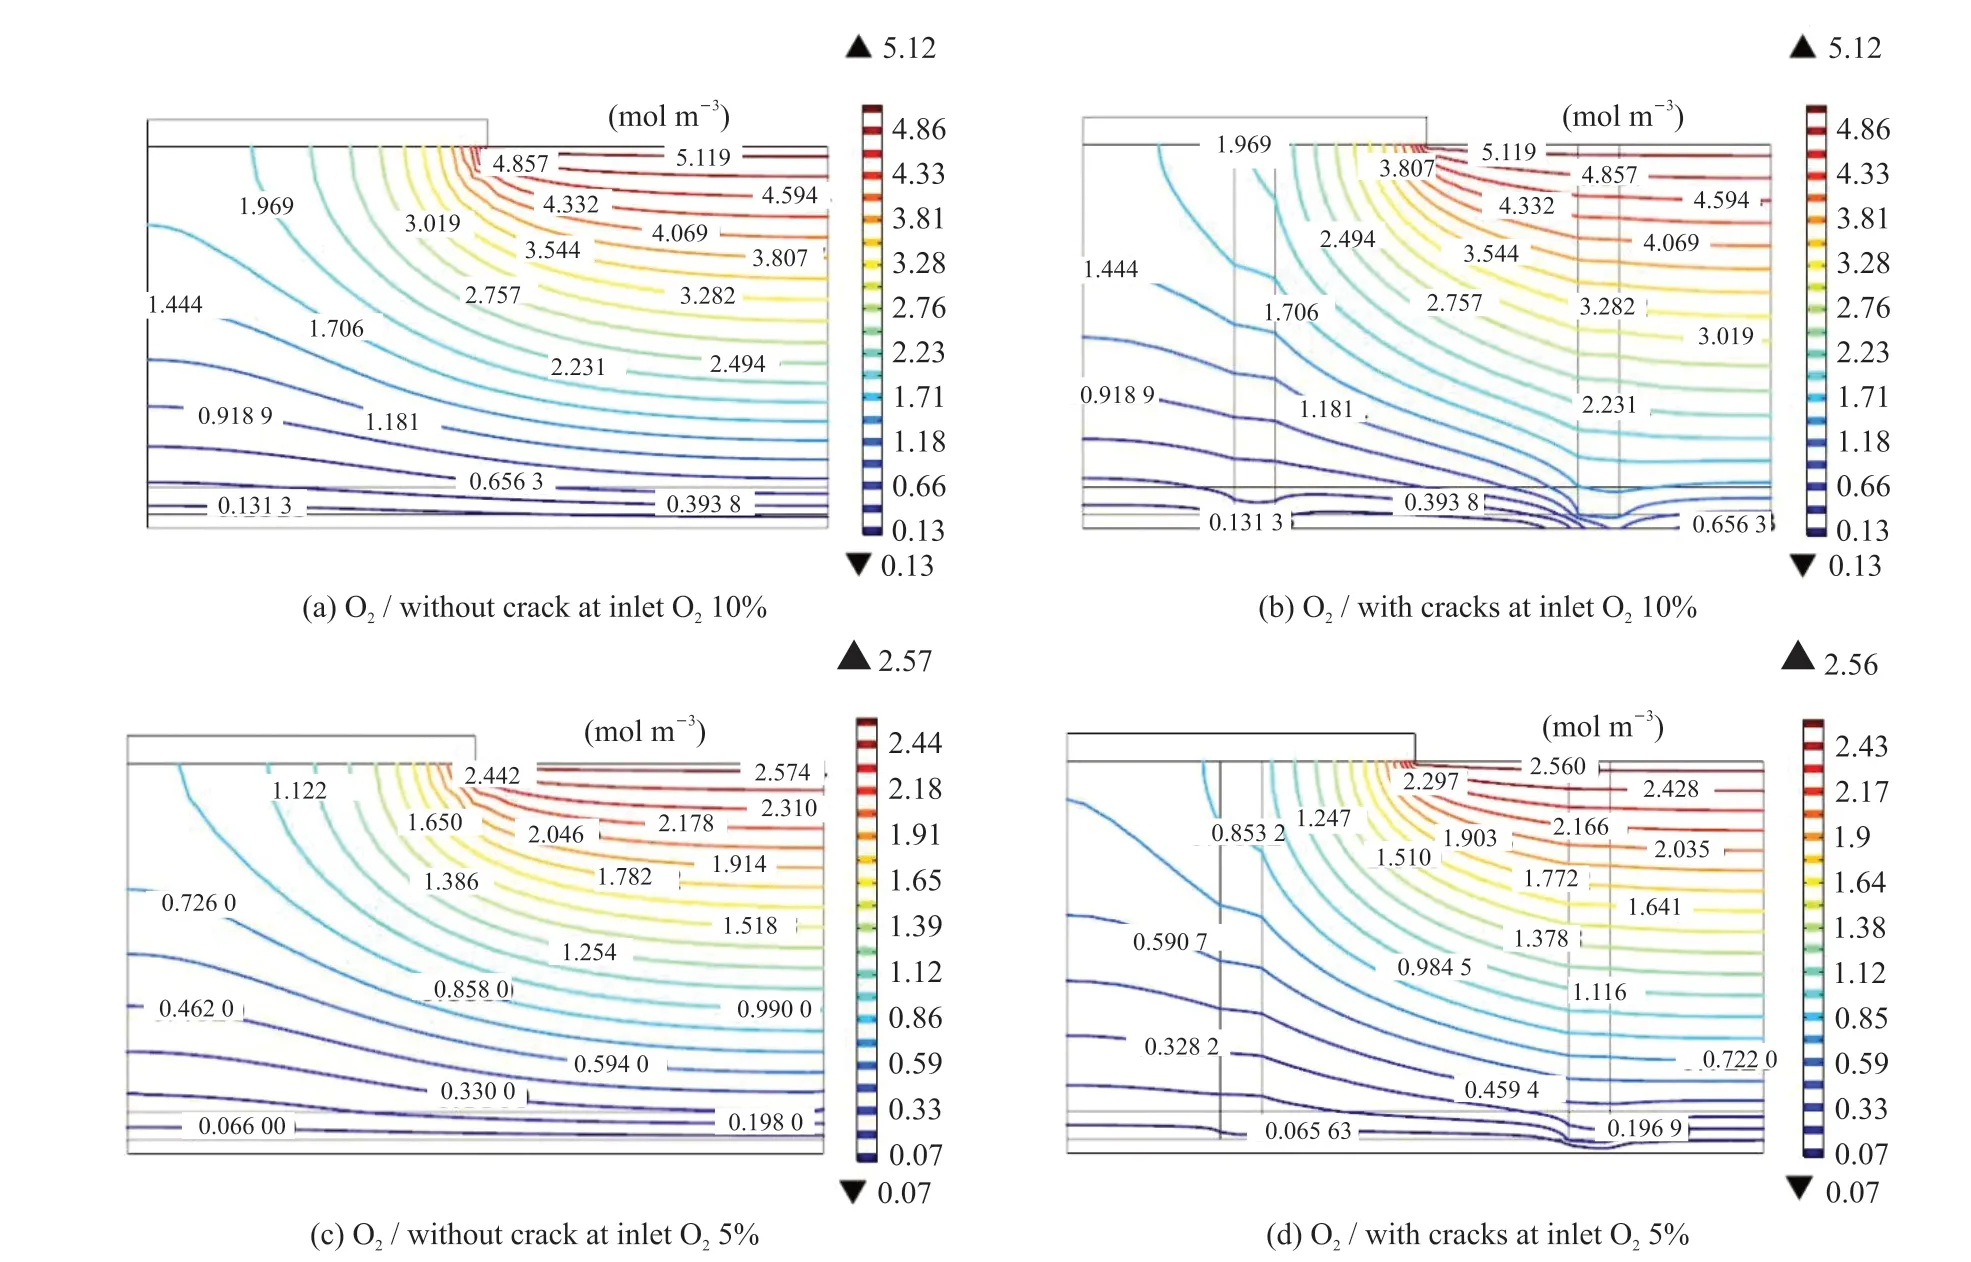
Fig.8 Distribution of oxygen concentrations in the MEAs with crack diameter of 30 μm and without cracks at different inlet oxygen concentrations (temperature 75 ℃, voltage 0.4 V)
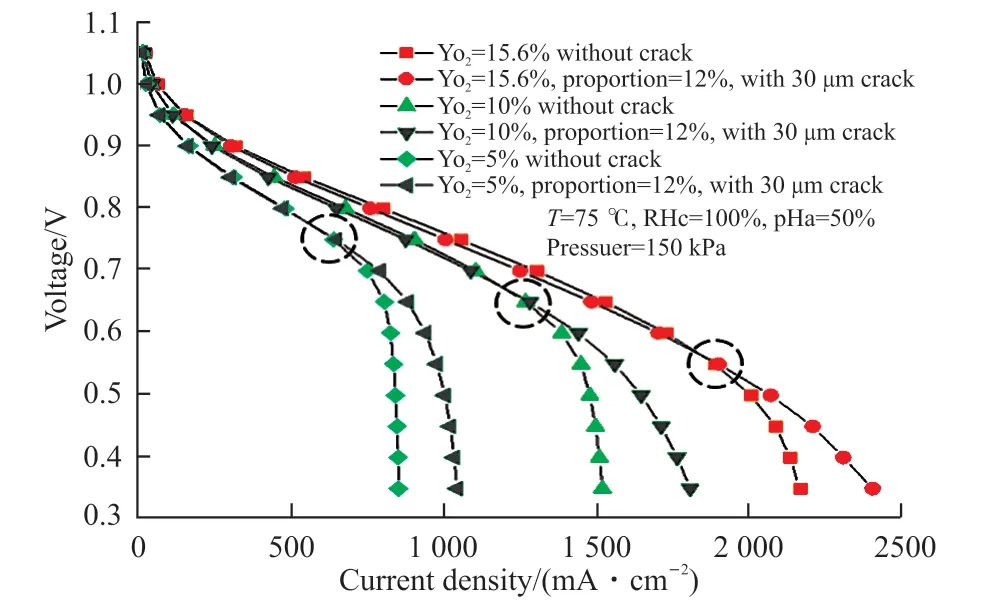
Fig. 9 Performance of MEAs with and without cracks for different inlet oxygen concentrations
3.5 Experimental verification
The MEAs used in the experiment to verify the model results consisted of CCM (GORE.INC.PRIMEA Series 5510 CCM, catalyst loading of 0.15 mg·cm-2),GDL (prepared with TPG-H-060 carbon paper Toray)and MPL with or without cracks (prepared by WHUT New Energy Company). A Greenlight G50 fuel cell test system was used to test the unit cell performance.Fig.10 shows an SEM micrograph of the surfaces of the MPLs with and without cracks. Fig.10(a) indicated that the surface of the MPL without cracks exhibited intersecting gullies, but no clear cracks, while Fig.10(b)shows that numerous clear cracks were present on the surface of the MPL with cracks.
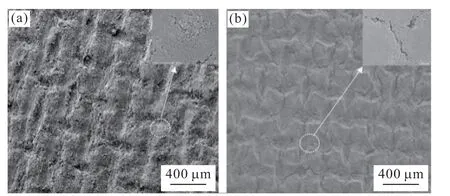
Fig.10 SEM images of the surfaces of the MPLs without (a) and with (b) cracks
The experimental test conditions were as follows:in one case the cathode inlet gas was air, while in the other case the inlet gas was the mixture of air and nitrogen, which made the oxygen mole fraction to be 15.6% and 10% respectively. A serpentine flow field was used. The polarization curves obtained from the experiment are compared in Fig.11. The performance of the MEA with cracks was better than that of the MEA without cracks at different inlet oxygen concentration;and the performance of MEA with cracks improved more for the case of 10% than that for the case of 15.6% . Up to now we can not prepare MEAs with cracks, of which the crack number, the diameter and the area proportion can be made as we desired. Therefore the experimental test only verified the modeling results qualitatively.
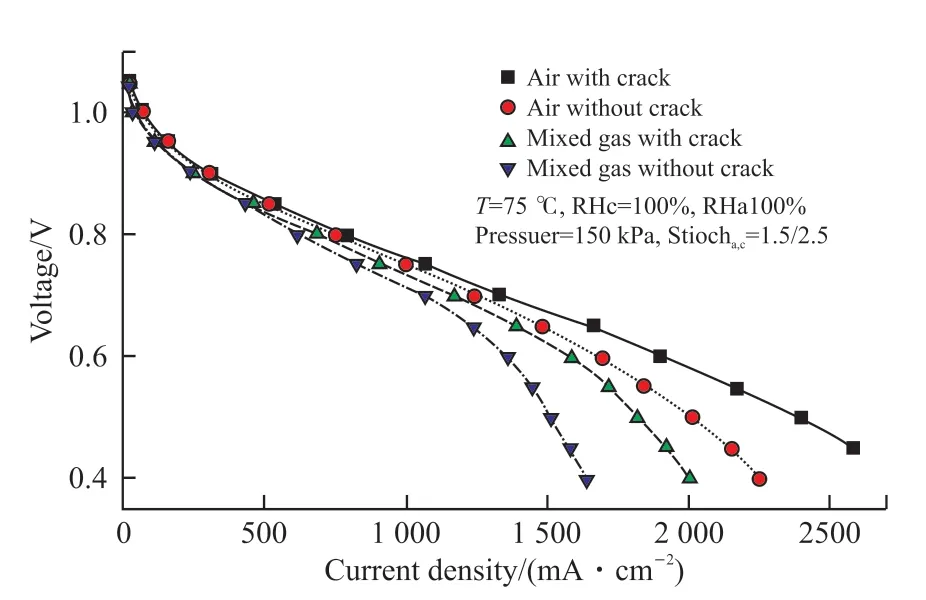
Fig.11 Performances of the single cell with and without cracks in the MPL
4 Conclusions
Reducing the Pt load of MEAs and operating them at high current densities are effective measures to decrease the cost and increase the power density of PEMFCs to achieve commercialization. However,the mass transfer must first be improved. In this study,a 2D geometric model for a PEMFC was developed.The mathematical model was based on the liquid water penetrating mechanism in the MEA under the action of capillary pressure, and the effects of the crack diameter, number, and distribution on the performance of a PEMFC, together with the oxygen concentration in the inlet of gas channel, are simulated to investigate the influence of mass transfer. The following conclusions can be drawn:
The liquid water in the CL can be effectively discharged to gas channels through the cracks in MEA under the action of capillary pressure, thereby alleviating flooding and enhancing oxygen diffusion to the CL. When the inlet oxygen concentration is 15.6%, 10% and 5% respectively, at 0.4 V voltage,the fuel cells operating current density for MEAs with cracks (30 μm,) increased by 8.2%, 16.9% and 21.2% respectively compared with MEAs without cracks. When the inlet oxygen concentration is 15.6%,at voltages of 0.85, 0.7 and 0.4 V, the fuel cells operating current density for MEAs with cracks (30 μm,) increased by 4.0%, 4.2% and 8.1% respectively compared with MEAs without cracks. In other words,when a fuel cell is operated under a higher current density and lower oxygen concentration, the influence of cracks on mass transfer will be more significant.
The ratio of the total area of cracks to the active area of the MEA has an optimal value. A proportion that is too large may cause high contact resistance in the fuel cell and less hydration of the membrane,and the effect of cracks on mass transfer maybe be insignificant if the proportion is too low. For the cases studied here, the effect was best at a proportion of 8%-12%, crack diameter of 20-30 μm, and uniform crack distribution.
We also prepared MEAs with and without cracks and used them in fuel cells to measure their performance. The effects of cracks on mass transfer were verified qualitatively.
The conclusions of this study are beneficial for the preparation of MEAs with controllable cracks,but it’s only the first step. To make the MEAs with really controllable cracks, we need to know firstly what sizes and structures of cracks are the best for the corresponding operating conditions. These issues will be studied continuously.
List of symbols
DieffEffective diffusion coefficient of gas componenti, m2·s-1
YiConcentration of componenti, %
SiSource term of componenti, mol m-3·s-1
SlqSource term of liquid water, mol m-3·s-1
ρgGas density, kg·m-3
DiDiffusion coefficient of componenti, m2·s-1
ε Porosity
SlqLiquid water saturation
DlqLiquid water diffusion coefficient, m2·s-1
pcCapillary pressure, Pa
plqLiquid water density, kg·m-3
μlqDynamic viscosity of liquid water, kg·m-1·s-1
KlqPermeability of the liquid water, m2
K0Intrinsic permeability of the porous media, m2
θ Contact angle, (°)
σ Surface tension, J·cm-2
γcondCondensation rates of liquid water, atm-1·s-1
γevapEvaporation rates of liquid water, s-1
XvpVolume fraction of water vapor, 1
pgGas pressure, Pa
TTemperature, K
MH2OMolecular weight of water, g·mol-1
psatSaturated vapor pressure of water, Pa
DCrack diameter, μm
杂志排行
Journal of Wuhan University of Technology(Materials Science Edition)的其它文章
- Effect of Nano Silver Modification on the Dielectric Properties of Ag@TiO2/PVDF Composites
- Preparation and Photocatalytic Performance of Double-Shelled Hollow W18O49@C3N4@Ti3C2 Microspheres
- Refinement of TiB2 Powders with High-speed Planetary Mill and Its Effect on TiB2 Sinterability
- Fabrication of Ordered Meso-macroporous HPW/TiO2 Catalyst for Efficient Heterogeneous Oxidative Desulfurization
- The Preparation of Porous Activated Slag Granules/TiO2 Photocatalyst and Its De-NOx Performance
- Effects of Magnetization on Thermoelectric Transport Properties of CoSb3 Material
