Study on the Flow Field around Two Parallel Moving Bubbles andInteraction Between Bubbles Rising in CMC Solutions by PIV*
2009-05-15FANWenyuan范文元MAYouguang马友光LIXiaolei李小磊andLIHuaizhi李怀志
FAN Wenyuan (范文元), MA Youguang (马友光),**, LI Xiaolei (李小磊) and LI Huaizhi (李怀志)
Study on the Flow Field around Two Parallel Moving Bubbles andInteraction Between Bubbles Rising in CMC Solutions by PIV*
FAN Wenyuan (范文元)1, MA Youguang (马友光)1,**, LI Xiaolei (李小磊)1and LI Huaizhi (李怀志)2
1State Key Laboratory of Chemical Engineering, School of Chemical Engineering and Technoloy, Tianjin University, Tianjin 300072, China2Laboratoire des Sciences du Génie Chimique, CNRS- ENSIC-INPL, 1 rue Grandville, BP 451, 54001 Nancy Cedex, France
The flow fields surrounding two parallel moving bubbles rising from two identical orifices submerged in non-Newtonian fluid of carboxymethylcellulose (CMC) solution of three different mass concentration were measured experimentally by the use of particle image velocimetry (PIV). The influences of gas flowrate, solution mass concentration, orifice interval and the angle between two bubble centers line and vertical direction on the flow field surrounding bubbles were discussed respectively by analyzing the velocity vector, velocity contours as well as individual velocity components. The results show that the liquid velocity both in front of two bubbles and behind increases with gas flowrate duo to shear-thinning effect of previous bubbles, whereas decreases with the increase of CMC concentration due to the increase of drag force acting on bubbles. The effect of the orifice interval on the flow field around two moving bubbles becomes gradually obvious as the interval becomes closer. Moreover, two adjacent side-by-side bubbles repulse each other during rising, leading to the practical interval between them increased somewhat above the orifice interval. When the distance between bubbles is less than the orifice interval l0 mm, the interaction between two neighboring bubbles changed from mutual repellence to attraction with the decrease of the angle of the line of linking two bubble centers to the vertical direction.
parallel bubbles, particle image velocimetry, non-Newtonian fluid, flow field distribution
1 INTRODUCTION
The rising of bubbles in non-Newtonian fluids is frequently encountered in a wide variety of industrial fields, such as chemical, biochemical, environmental and food processes. Duo to the inherent complex nature of bubble phenomena arising from interactions and coalescence between bubbles, these in non-Newtonian fluids demonstrate different rising velocity, shape and track under the joint action of the different forces, leading to marked influence on the contact time and contact area between gas and liquid phases so as to affect consequently mass, heat transfer and chemical reactions between them. Adequate understanding of the flow structure surrounding two bubbles rising parallelly in a non-Newtonian fluid is a key to studying other phenomena like interactions and coalescence between bubbles under industrial conditions, since ensembles of bubbles rather than individual ones are often encountered. It is also the essential base for better understanding gas-liquid absorption processes with or without reactions as well as taking overall insight into the bubbles swarm behavior in non-Newtonian fluid.
Considering the importance of two-phase bubbly flow, as a prerequisite and necessary basis, a single bubble rising in Newtonian fluids has been extensively reported in the literature since Crabtree and Bridgwater [1] and Bessler and Littman [2]. By means of visualization, the averaged data or the qualitative description of wake properties, including shedding frequency, primary wake size, and bubble inclined angle, were determined [3]. Three kinds of bubble wakes in Newtonian fluids have been further identified, namely, the laminar wake, the transitional wake and the turbulent wake by Komasawa and Otake [4]. The shedding mechanism of the near wake behind a single gas bubble rising in water was quantitatively investigated using particle image analyzer [5, 6]. Unlike the wake in Newtonian fluids dragging the liquid with bubble moving upward, a negative wake in non-Newtonian fluids was firstly observed to push the liquid away from the bubble by Hassager [7]. By laser-doppler anemometry (LDA), Bisgaard and Hassager [8] concluded that a negative wake was induced by elasticity, which usually has the opposite-direction effect to the inertial force. This peculiar phenomenon has also been observed for spheres falling in viscoelastic liquids [9].
As a full field non-intrusive measuring method, particle image velocimetry (PIV) can record the snap shot of flow field at a given time instant within the measurement zone and accordingly has been widely applied to investigate the bubble hydrodynamics in two-phase bubbly flows instead of such one-point measurement methods as Pitot tube, hot wire anemometry and LDA. By means of PIV technique, Herrera-Velarde. [10] studied the flow of non-Newtonian fluids around bubbles before and after the critical volume and found that the appearance of the velocity discontinuity is associated with the presence of negative wake: for small bubbles (volume smaller than the critical volume) the flow is similar to that in a Newtonian liquid; for large bubbles, the flow is strongly different and a negative wake could be found. Funfschilling and Li [11, 12] investigated the influence of the injection period on the bubble rise velocity and their corresponding shape and found a disconnection between the bubble shape and surrounding flow field around a rising bubble using PIV and a classical birefringence visualization. Furthermore, Kemiha. [13] and Frank and Li [14, 15]found the coexistence of three distinct zones around bubbles rising in polyacrylamide (PAM) solutions: a central downward flow behind the bubble (negative wake), a conical upward flow surrounding the negative wake zone, and an upward flow zone in front of the bubble. By use of the particle image analyzer (PIA) and rheological data, the instantaneous flow structure and other hydrodynamic information of single bubbles rising in a non-Newtonian fluid have been quantitatively studied [16]. Moreover the interaction between consecutive Taylor bubbles rising in stagnant non-Newtonian solutions was also studied by analyzing the liquid velocity profile in the wake of a single rising bubble [17-20].
The rise of two parallel bubbles in Newtonian fluid becomes complex due to dynamic interaction between bubbles. van Wijnggaarden and Jeffrey [21] and Kok [22] developed respectively the lift coefficient and drag coefficient of bubbles under the approximation of potential flow. Legendre. [23] found that bubbles separated each other at lowdue to the dominant effect of vorticity and approach each other at highdue to the dominant effect of pressure, caused by thin boundary layer around bubble. Whenis above the critical region, bubbles approached each other and collided, resulting in two kinds of motion: coalescence or bouncing [24]. However, few reports on experimental measurements of flow fields around two parallel bubbles rising in Newtonian fluid exist.
Although considerable progress of study on flow around a single rising bubble has been achieved, the quantitative investigation of instantaneous flow field of a pair of bubbles side by side rising in non-Newtonian fluids remains still unreported in the literature. In this work, the rise and interaction between two parallelly rising bubbles were experimentally investigated by analyzing the velocity field around bubbles using PIV. The influence factors on flow field surrounding bubbles were also discussed. According to the qualitative flow visualization of Chen. [25], the flow structures in 2-dimensional and 3-dimensional bubble columns are similar, hence, only 2-D flow structures were analyzed.
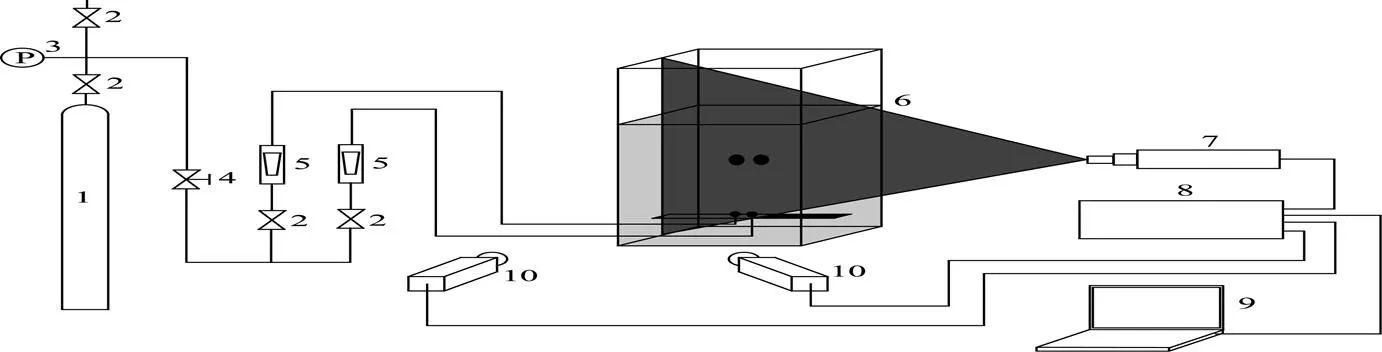
Figure 1 Schematic diagram of the experimental apparatus and PIV system
1—compressed nitrogen cylinder; 2—valves; 3—manometer; 4—pressure maintaining valve; 5—rotameter; 6—plexiglass square tank; 7—Nd-YAG lasers; 8—PIV processor; 9—computer; 10—CCD camera
2 EXPERIMENTAL
2.1 PIV and experimental setup
Two cameras with Scheimplug configuration are used in angular stereoscopic PIV to view the flow field from two perspectives so that the out-of-plane velocity component could be measured. The two components of velocity nominally perpendicular to the camera optical axis are measured from each camera view point. The pair of two-dimensional velocity vectors for a point in the flow field is then combined to yield a three-dimensional velocity vector as described previously [26]. For the experiments performed in this work, the basic optical arrangement allows a laser plane passing through twin parallel bubbles to measure the instantaneous velocity field around two parallel bubbles by PIV (3D FlowMater, LaVision GmbH, Germany).
The experimental facility consists of two parts: bubble generation system and PIV system as shown in Fig. 1. Bubble generation system mainly includes a plexiglas square tank with dimension 15 cm×15 cm×50 cm, which was considered to be large enough and allow neglecting the effect of the wall on the shape and size of bubbles. A plexiglas plate (15 cm× 5 cm cross-section and 1 cm thick) has two identical polished orifices (inside diameter 1 mm) was placed inside the tank 10 cm above the bottom for generating bubbles. Two stainless tubings with inside diameter 2 mm linked the nitrogen cylinder, rotameters and orifices. Relative to the fixed right orifice, the left orifice is movable horizontally to adjust facilely the orificeble,nitrogen pressure was maintained at little more than 0.1 MPa through adjusting a regulation valve, thus gas flowrate could be showed accurately by the rotameter calibrated. Nitrogen bubbles were always generated synchronously at stable frequency from the twin submerged orifices by adjusting the gas flowrate properly.
The PIV system used for the determination of the velocity fields is essentially composed of a pair of high-resolution CCD cameras (LaVision FlowMaster3 system, image size 1376×1040) with a Nikon lens, a double pulsed Nd:YAG laser (532 nm wavelength) and a LaVision’s “FlowMaster3” correlator for data processing of PIV images. The laser beam was transformed into a sheet using a cylindrical lens and was focused through an optical lens to create a vertical light sheet approximately 1 mm thick at the center plane of the test section. The flow field around two bubbles (.. the vertical wall through the centers of two orifices) was illuminated by this light sheet as shown in Fig. 1. A humidifier adapter and the calibration plate supplied by the manufacturer were used to minimize the focusing aberration and image distortion. The whole system was driven by a commercial analysis package of Davis 7.2 provided by LaVision.
In order to achieve preferable measurement of the liquid motion around bubbles, adequate frame size, frame rate and light intensity, as well as appropriate number density of seeding particles corresponding to a target flow are required. Red fluorescent polymer microspheres with a density of 1050 kg·m-3and a mean diameter of 7 µm, as tracer particles, were seeded and homogeneously distributed over the whole fluid. The observing field with dimension 120 mm×90 mm was located at height of 400 mm above the orifices since bubble terminal velocity is reached within the viewing field. 5% light intensity of the full capacity (18 mJ ) was adopted to eliminate the reflection of bubbles under the experimental conditions. Since the particle image displacements are typically less than 1/4 of the interrogation widow during the exposure time interval, the time interval between the successive exposures was set 3-6 ms according to the velocity of fluids around bubbles, size of view and the resolution of CCD camera (87 µm per pixel).
Furthermore, an original image was processed by median filter to remove noises, and then the recursive cross-correlation method was adopted as the PIV algorithm in the present PIV analysis. This method is especially effective for the flow field with a wide velocity range such as the surrounding liquids motion of a bubble. Moreover, two iterations with 50% overlap were applied for the initial an interrogation area of 64×64 pixels, and the final size of 32×32 pixels. Finally the group with less than 5 vectors and the vectors with value more than 20 m·s-1was removed and satisfied results of the velocity field around bubbles were obtained.
2.2 Experimental condition
As well known, bubble begins to accelerate after detaching from the orifice and then reaches a steady rising process gradually. In this paper, experiment was carried out above about 400 mm high from orifices.
The system described above was employed to study the velocity fields around a pair of bubbles rising in carboxymethylcellulose (CMC) aqueous solution under various conditions: mass concentrations of CMC aqueous solution: 0.35%, 0.50% and 0.80%; orifice interval: 10 mm, 20 mm and 30 mm; gas flowrate: 0.2, 0.5 and 0.8 ml·s-1. In addition, the physical properties of rheological characteristics, surface tension and density of CMC aqueous solutions were measured respectively by Rheometer of StressTech (REOLOGICA Instruments AB, Sweden), dynamic surface tension apparatus (DCAT21, Dataphysics, Germany) and pycnometer, and the result was shown in Table 1. From Table 1, it is known that the CMC solutions were shear-thinning fluids with apparent viscosity higher than water.

Table 1 Physical properties of the solution used
3 RESULTS AND DISCUSSION
As two bubbles rise through stagnant liquid, the shape evolutions and motion trajectories of bubbles, and the flow field around bubbles could be captured by the digital cameras of PIV. Fig. 2 displays the typical original images of two bubbles rising in 0.5% CMC solution, where the tracer particles are dispersed homogeneously in liquid surrounding two bubbles. The final results of flow field can be calculated by a proper algorithm as well as pre- and postprocess mentioned above.
3.1 Effect of gas flowrate on flow field
Figure 3 presents respectively vector, contours in-direction and-direction of fluids around a pair of bubbles generated from two orifices of 10 mm interval under air flowrate: (a) 0.2 ml·s-1, (b) 0.5 ml·s-1and (c) 0.8 ml·s-1. It should be noted that the-coordinate and-coordinate in Fig. 3 (also in Figs. 6, 9, 12 ) refers to the distance from the middle point of two orifices and from the bottom of the observing field respectively. It can be seen from vector maps that the flow field around two bubbles rising side by side in the shear-thinning fluid is quite similar: due to inertial effect, the liquid flows upwards both in front and in back of the bubble. The flow induced by bubbles mainly lies in vertical channel with width of about six times bubble horizontal diameter as shown in Fig. 4, whereas only weak flow of liquid found in the zone near walls. However, it is noteworthy that the flow field around bubbles varied regularly with the increase of gas flowrate in several different features: firstly, the liquid velocity behinds bubbles increases due inertial effect, and apparent characteristics of single velocity contour behind bubble dies away and then merged slowly as a whole, consequently, resulting in the rise of velocity gradient in the wake zone and the decline of the width of the induced flow field; secondly, liquid velocity before the bubble increases with gas flowrate due to temporary decline of local viscosity caused by the shear-thinning effect of CMC solutions, at the same time, the flow of the liquid before bubbles weakens with the increase of the distance along horizontal direction from the vertical symmetrical axis of bubble, higher flow velocity in the zone near the symmetrical axis leads to the larger decline of liquid viscosity. Both inertial effect and shear-thinning effect cause the increase of bubbles rising velocity with gas flowrate as shown in Fig. 5. Thirdly, due to powerful pull-up of bubble in high gas flowrate, the velocity of liquid in the middle zone between the two bubbles and behind this zone accordingly increase, and consequently resulting in the little difference of liquid velocity in the tail zone of bubble from that in the middle zone of two tails. In this work, often-quoted negative wake has not been observed, the flow field is very similar to that small bubbles in a Newtonian liquid as reported by Funfschilling and Li [11].
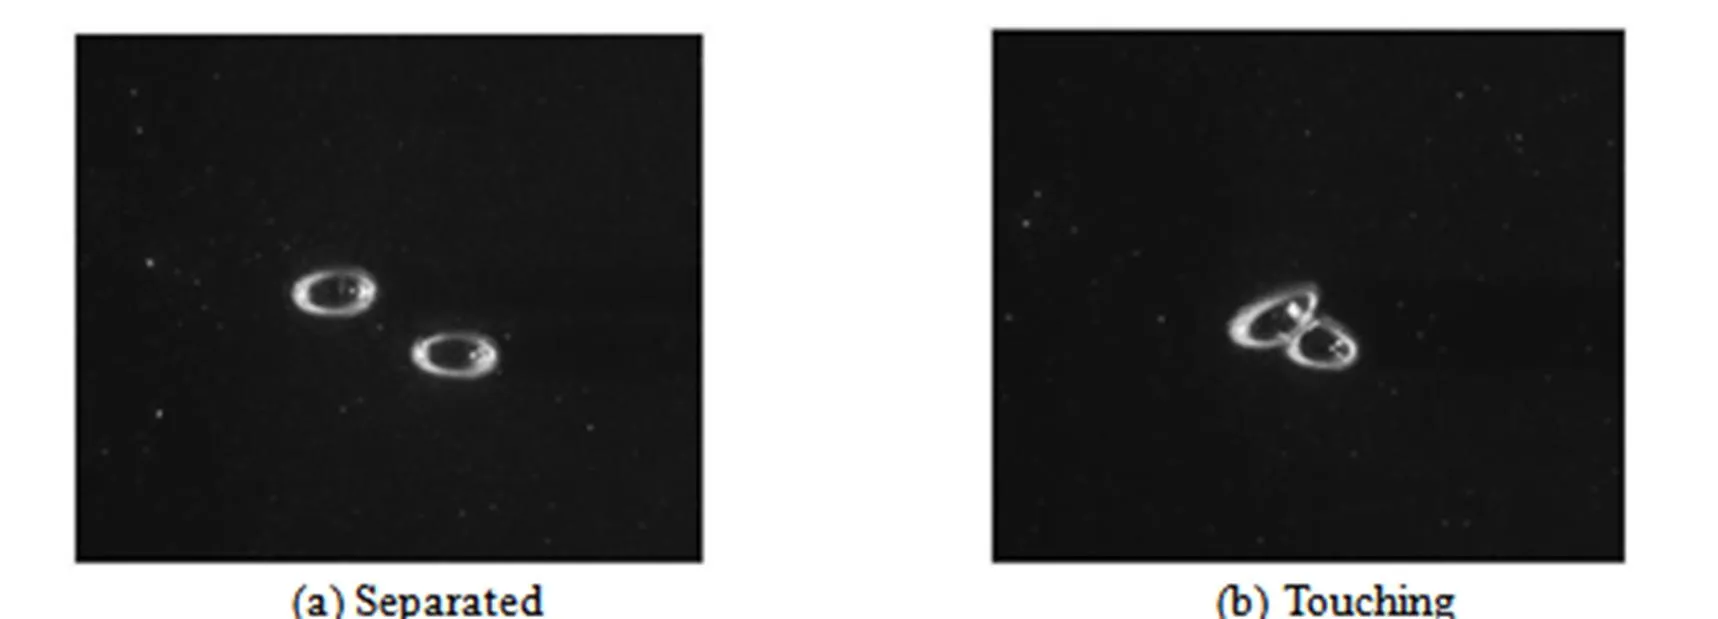
Figure 2 Typical images of two bubbles captured by PIV in 0.5% (by mass) CMC solution
Figure 3 Vectors, contours in-direction and-direction of a pair of bubbles rising in a 0.5% (by mass) CMC solution with orifice interval 10 mm and different gas flowrates
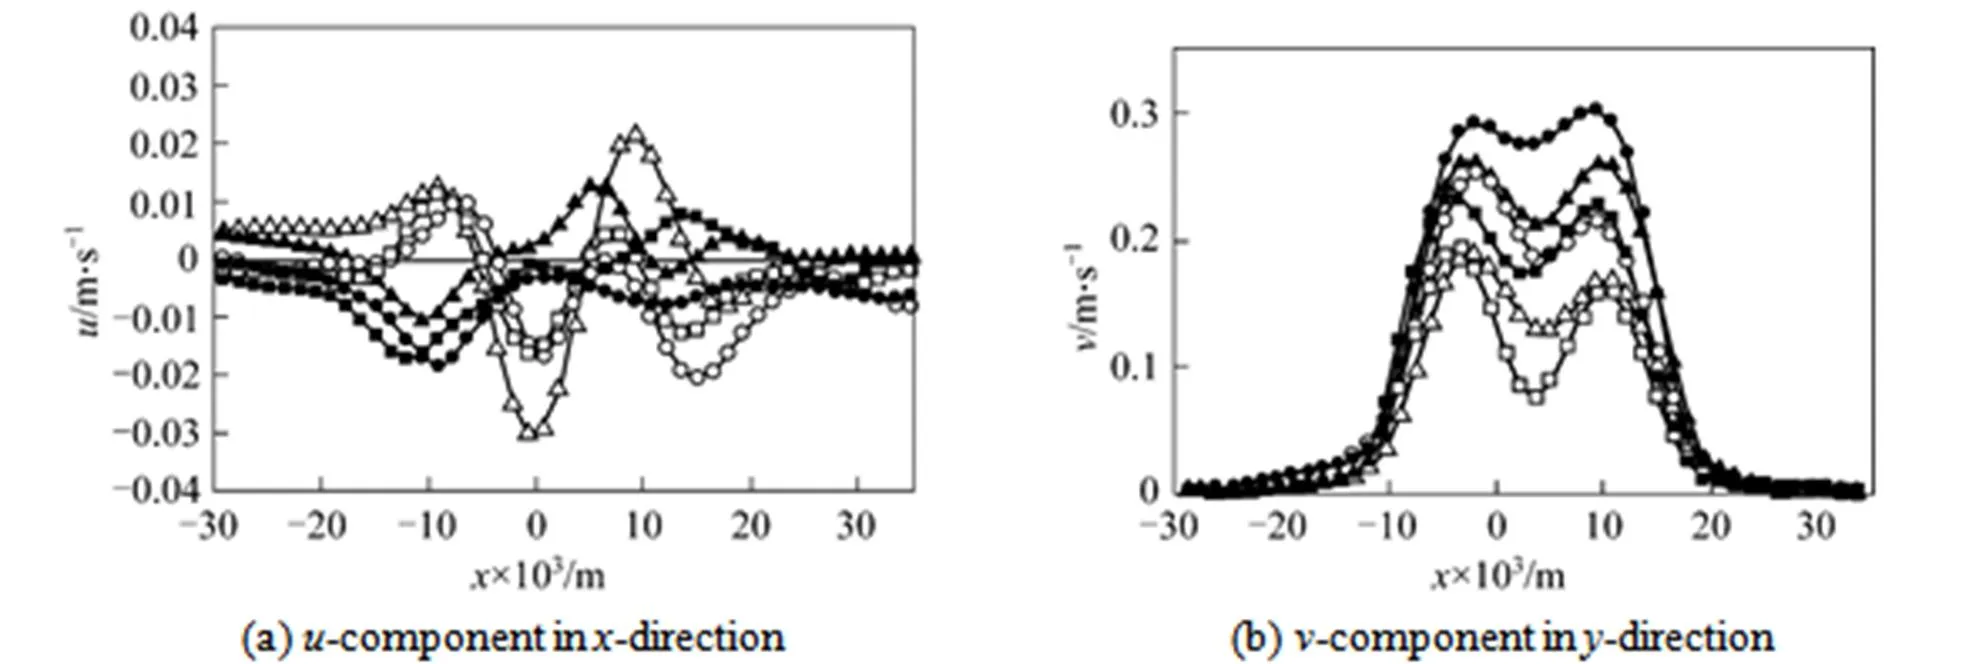
Figure 4 Velocity components for three different gas flowrates (open: at height of 2edownward from bubble center; closed: at height of bubble center)
open:□ 0.2×10⁻⁶m3·s-1; △ 0.5×10⁻⁶m3·s-1;○ 0.8×10⁻⁶m3·s-1
closed: ■ 0.2×10⁻⁶m3·s-1;▲ 0.5×10⁻⁶m3·s-1;● 0.8×10⁻⁶m3·s-1
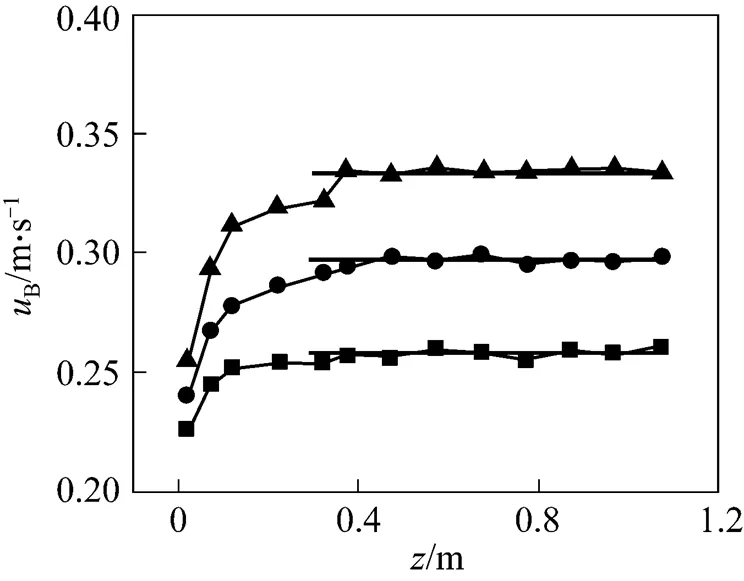
Figure 5 Effect of gas flowrate on bubble terminal velocity
■ 0.2×10⁻⁶m3·s-1;● 0.5×10⁻⁶m3·s-1;▲ 0.8×10⁻⁶m3·s-1
3.2 Effect of solution concentration
Figure 6 shows the instantaneous flow structure for a pair of bubbles rising in 0.35%, 0.50% and 0.80% (by mass) CMC solutions under flowrate of 0.2 ml·s-1, including velocity vector and contours in the- and-directions. As bubbles rises upwards side by side, the liquid in front of the bubble is pushed away in both the vertical and lateral directions by the rising bubbles, which induce the liquid in the region between two bubbles is also drawn up at lower velocity than that in front of bubbles. As a result, a classic saddle shape of velocity field in the front of two bubbles is clearly displayed as shown in the vector map of Fig. 6. In view of the two bubbles as a whole, bubbles flow upwards and the liquid in the front of bubbles towards the wall, contrarily, the fluid on left and right sides behind the bubbles flows towards the center of the tank. When liquid concentration increases, the velocity of rising bubbles decreases due to the drag of liquid as shown in Fig. 7, accordingly, the velocity of liquids both before and behind bubbles reduces. It also demonstrates in Fig. 6 that two velocity contours behind bubble vanish gradually and the bubble shape becomes flat due to the movement of upside bubble interface induced by the decline of local viscosity and intensive shear-thinning effect. From calculating results in Fig. 8, it can be clearly found that the velocity gradient of liquid in-direction reduces gradually with the increase of solution concentration, which could be attributed to the fact that the stress need much time to relax in high concentration of CMC solutions.

Figure 6 Vectors, contours in-direction and-direction of a pair of bubbles rising in different CMC solutions with orifice interval 10 mm and gas flowrate 0.2 ml·s-1
Figure 7 Effect of solution concentration on bubble terminal velocity
■ 0.8% CMC;● 0.5% CMC;▲ 0.35% CMC
3.3 Effect of orifice interval
Three different intervals between two orifices with 10 mm, 20 mm and 30 mm were employed to investigate their influence on the flow fields surrounding two parallel bubbles. Typically instantaneous liquid velocities, contour in the three distances in 0.8% (by mass) CMC solution under flowrate of 0.5 ml·s-1were plotted in Fig. 9. It shows that the velocities of the suppressed liquid in front of bubble and the induced liquid behind bubbles decreased obviously with the increase of orifice interval due to the decline of interaction between two bubbles. At the same time, the interaction between two bubbles weakened when velocity contours surrounding bubbles separated from each other steadily. In the case of orifice interval of 30 mm, the liquid velocity between two velocity contours is the same as that in the zone near wall of the tank and very similar to the case of single bubble.
In fact, due to suppression and pushing-away by the rising bubble in vertical and lateral directions, the vector distribution of liquid velocity in front of the bubble appears a sharp fan shape: the maximum velocity in-direction is in front of bubble center, whereas vertical vectors turn towards left and right sides of bubble center. This means that flow of the liquid around a bubble is not affected by another and bubbles rise freely in fluid in larger orifice interval (for example 30 mm), the velocity in middle region of two bubbles is similar to that near the wall as shown in Fig. 10 (b). However, when the interval decreases to 20 mm for the given experimental condition, the upward flows of the liquid in the front of bubbles interact each other and pull up the liquids in the zone between two bubbles as well as liquid behind the zone quickly, and consequently results in the increase of bubble terminal velocity as illustrated in Fig. 11. Nevertheless, the interaction between two bubbles is not distinct since the velocities of the bubbles at different heights along vertical symmetrical axis are closely equal in all three orifice intervals.
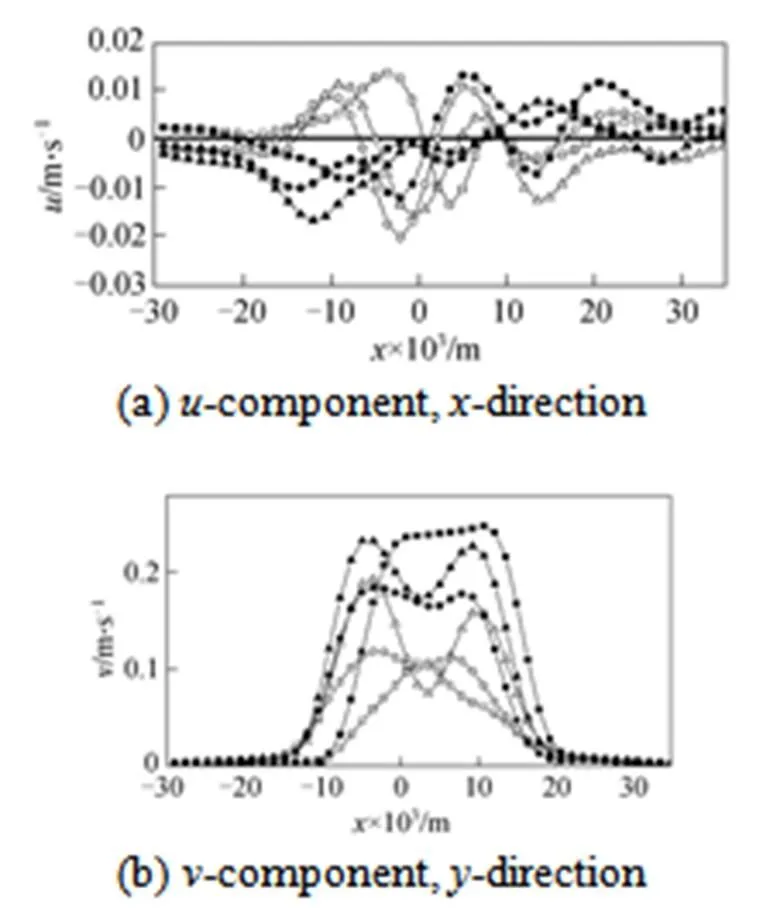
Figure 8 Individual components of the velocity vector for three different solution concentrations (open: at height of 2edownward from bubble center; closed: at height of bubble center)
open:□ 0.35% CMC; △ 0.50% CMC;○ 0.80% CMC
closed: ■ 0.35% CMC;▲ 0.50% CMC;● 0.80% CMC
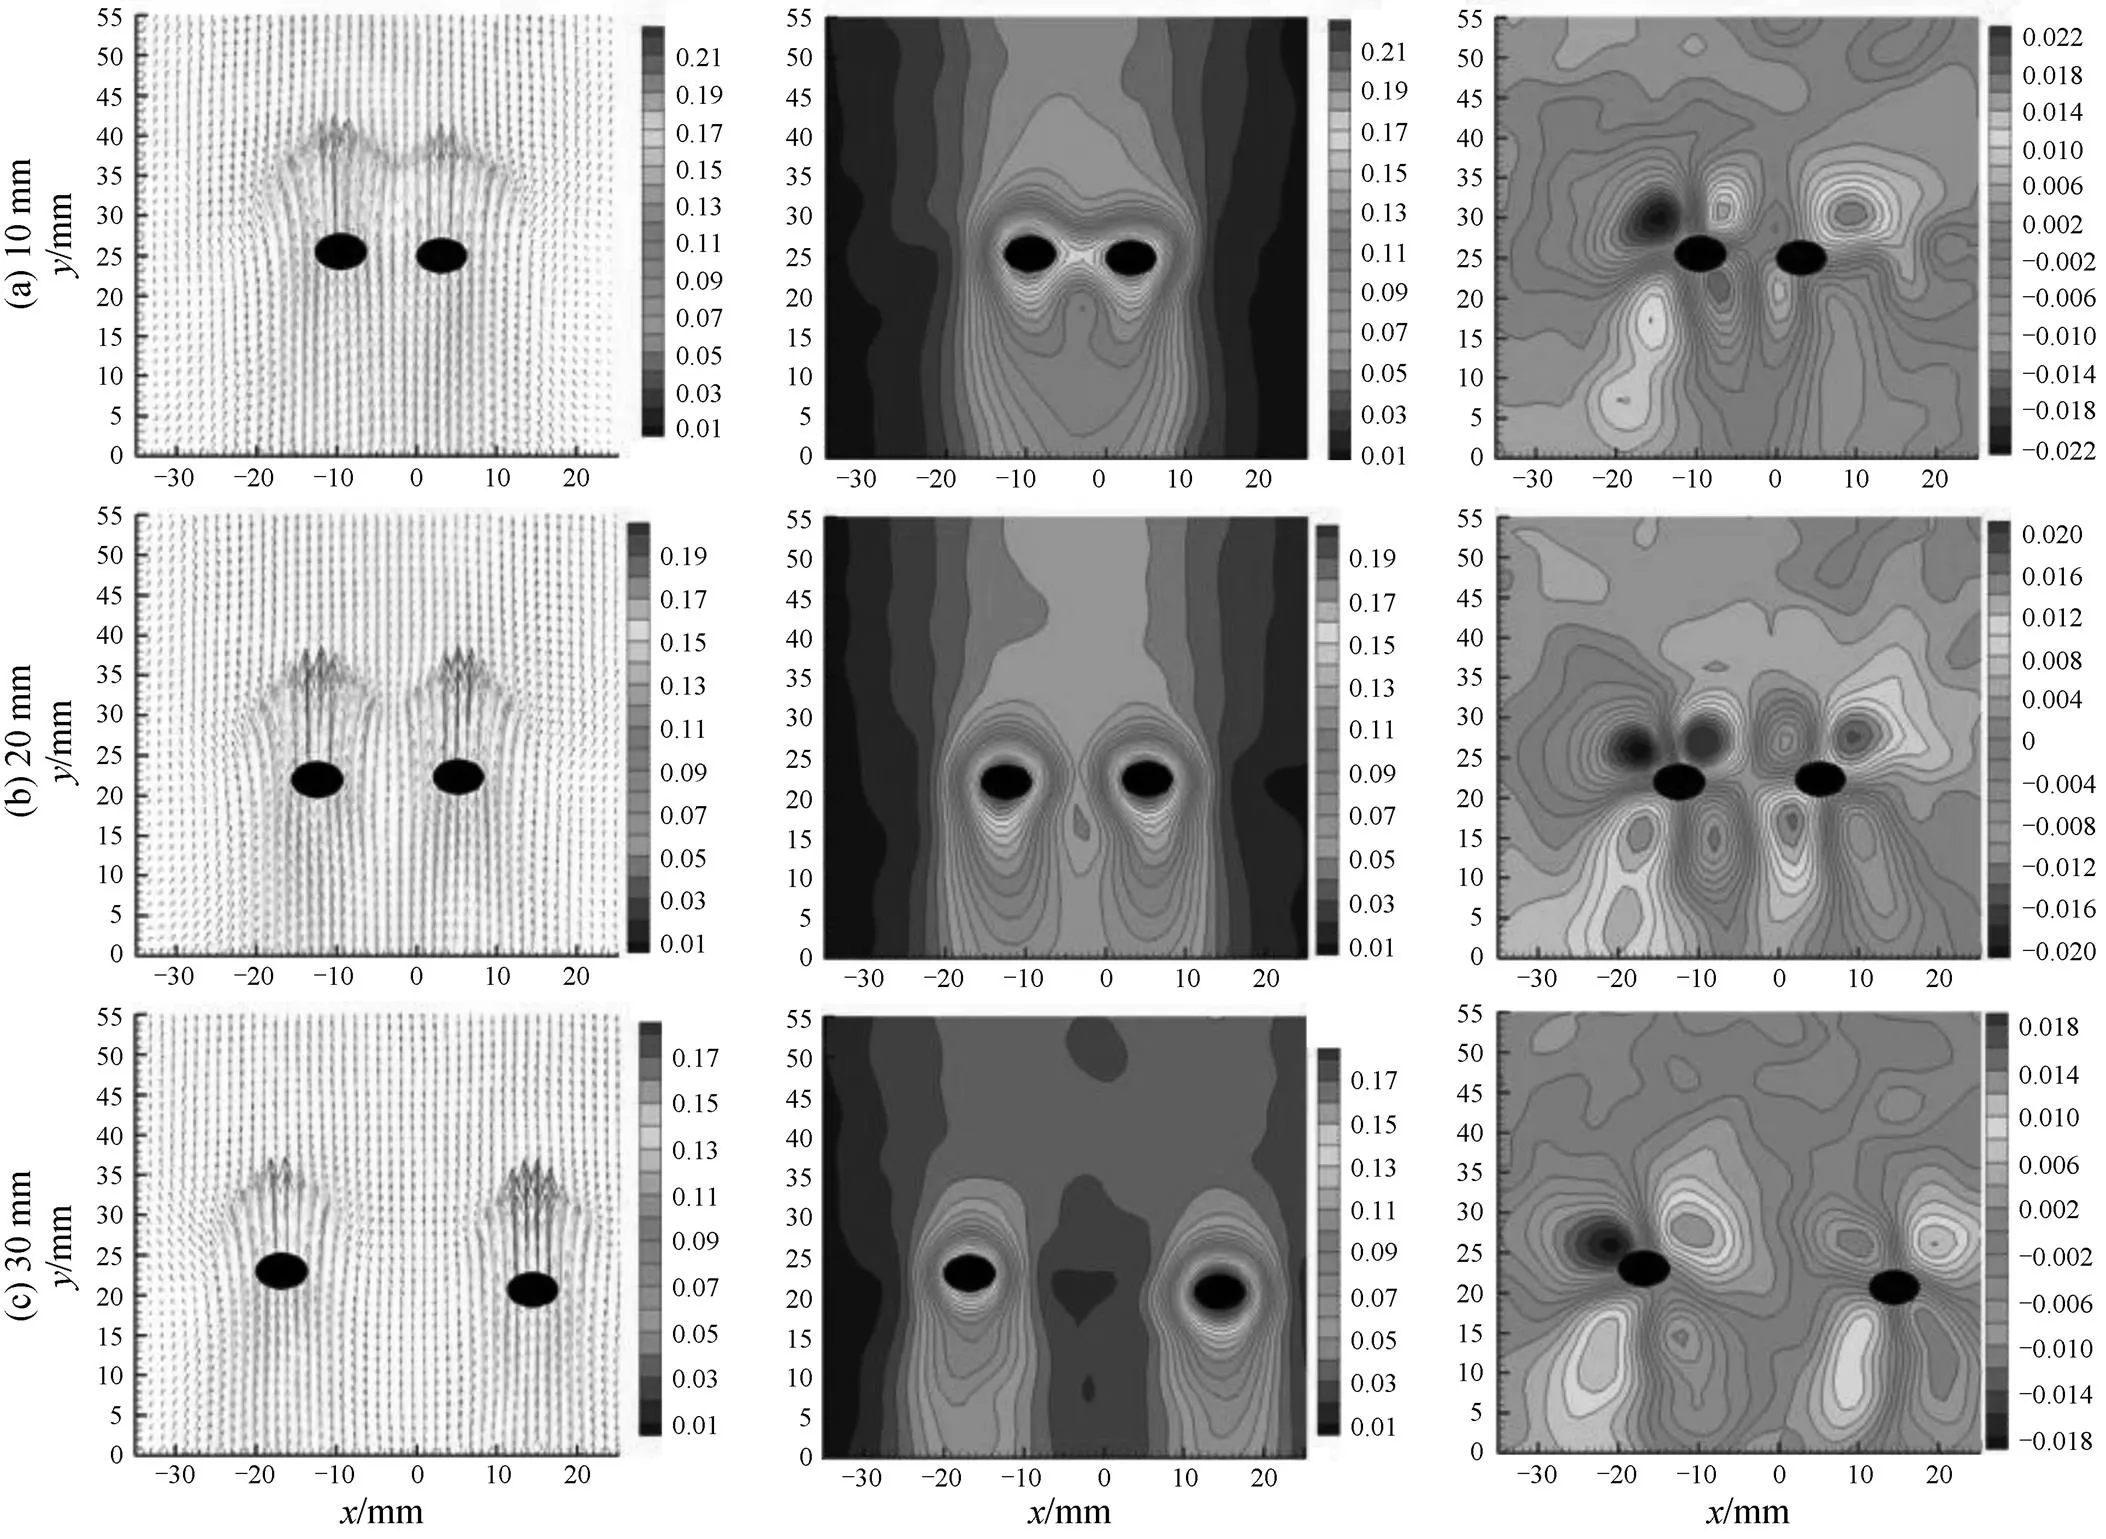
Figure 9 Vectors, contours in-direction and-direction of a pair of bubbles rising in a 0.8% (by mass) CMC solution with gas flowrate 0.5 ml·s-1and different orifice intervals
Figure 10 Individual components of the velocity vector for three different orifice intervals (open: at height of 2edownward from bubble center; closed: at height of bubble certer)
open:□ 1.0×10⁻²m; △ 2.0×10⁻²m;○ 3.0×10⁻²m closed: ■ 1.0×10⁻²m;▲ 2.0×10⁻²m;● 3.0×10⁻²m
3.4 Effect of angle between bubbles center line and vertical direction
As well-known, flow around two parallel bubbles in fluids is affected not only by fluids physical properties but also by bubbles characteristics and relative position. In this paper, the effect of angle between centerline of bubbles and vertical direction on flow field of liquid is investigated when the distance between bubbles is less than 20 mm and orifice interval l0 mm, the typical velocity vector and contour in-direction and-direction in 0.8% (by mass) CMC solution under gas flowrate 0.5 ml·s-1is displayed in Fig. 12. In case of angle 88° as shown in Fig. 12 (a), two bubbles rise side by side in almost same height and push away each other. Usually, a stable rising state for two parallel bubbles generated from orifices with small interval is in somewhat smaller angle than 90°, if orifice interval is small enough, later bubble is inclined to be captured by the wake of previous one in small angle, which results in the acceleration of later one toward previous one due to the shear-thinning effect of CMC solution, consequently later bubble is induced to move upon the previous one, and the distance between them decreases with the rising of bubbles as shown in Figs. 12 (b) and 12 (c). This will lead to an increase of rising velocity of previous bubble with decrease of the angle between centerline of bubble and vertical direction as shown in Fig. 13. Generally, the interaction between two bubbles changes from repellence (a) to attraction (c) in a transition of near neutrality (b) with the decrease of angle between centerline of two bubbles and vertical direction, this essentially is a competitive result of repellence in horizontal direction and attraction in vertical direction. Moreover, It is also worthwhile noted that due to the attraction of bubbles each other, the zone affected by bubble rising is getting narrow as shown in-components of the velocity vector in Fig. 14.
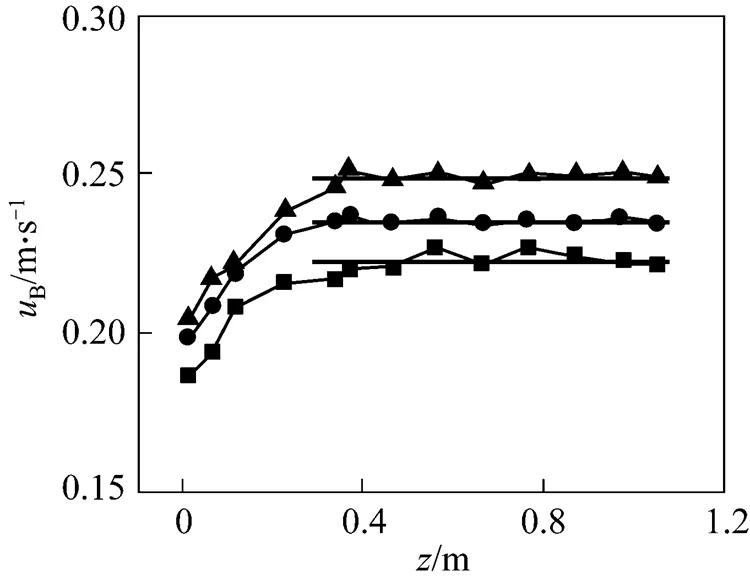
Figure 11 Effect of orifice interval on bubble terminal velocity
orifice interval:■ 30 mm; ● 20 mm; ▲ 10mm
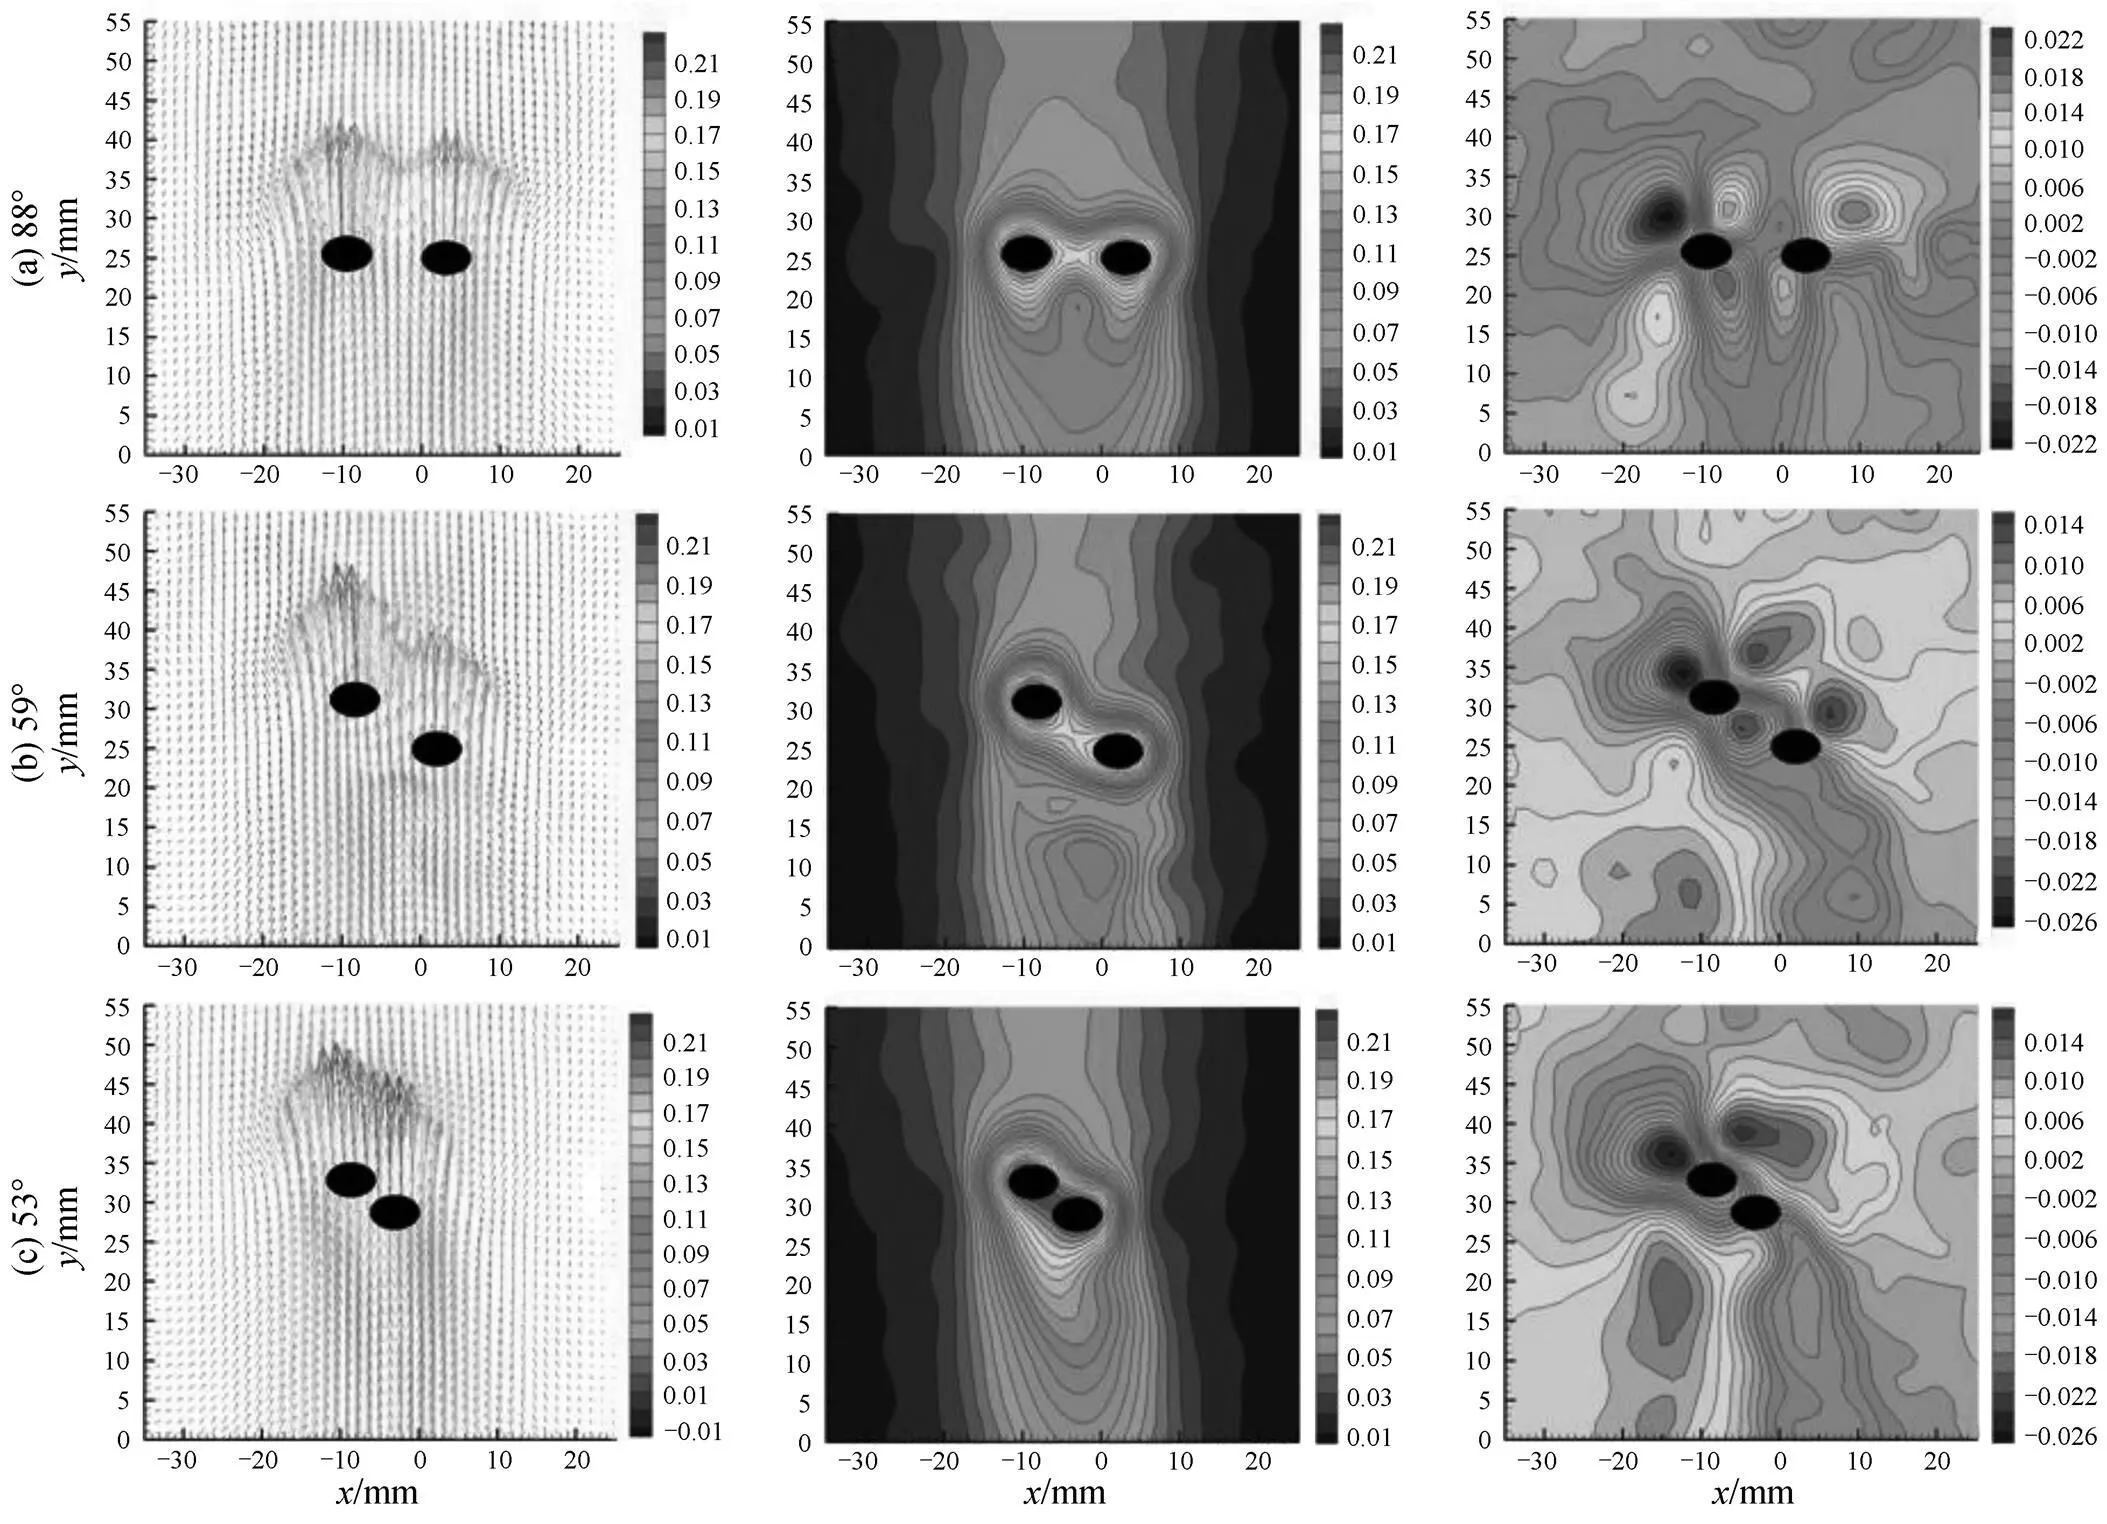
Figure 12 Vectors, contours in-direction and-direction of a pair of bubbles rising in a 0.8% (by mass) CMC solution with gas flowrate: 0.5 ml·s-1; orifice interval: 10 mm; different angles between bubbles center line and vertical direction
Figure 13 Effect of angle between bubbles center line and vertical direction on bubble terminal velocity
■ 88°; ● 59°; ▲ 53°
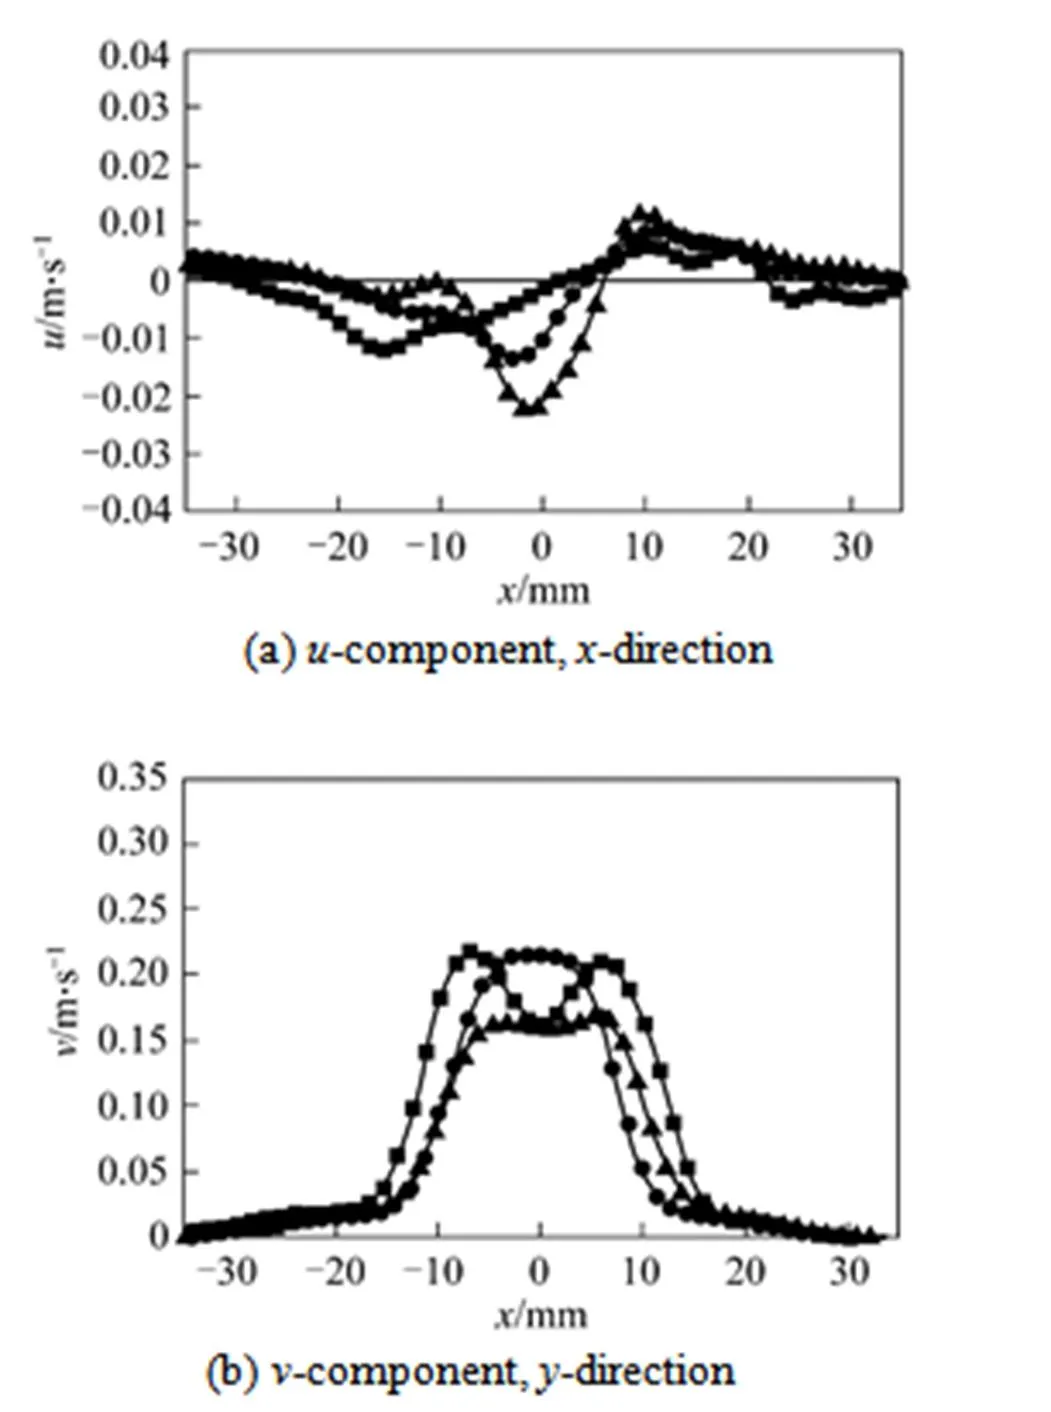
Figure 14 Individual components of the velocity vector for three different angle between bubbles center line and vertical direction
■ 88°; ● 59°; ▲ 53°
4 CONCLUSIONS
A parallel bubbles generation system was established to produce steadily two parallel bubbles under the different operation conditions. The flow field around two parallel bubbles rising from two uniform orifices submerged in non-Newtonian fluids of CMC solution was measured experimentally using PIV. The influences of gas flowrate, solution mass concentration, orifice interval and the angle of linking line of two bubble centers with vertical direction on the flow field surrounding bubbles were discussed respectively. The results show that duo to shear-thinning effect of CMC solution passed by previous bubbles, the liquid velocity both in front of two bubbles and behind increases with gas flowrate, however decreases with the increase of solution mass concentration duo to the increase of drag force acting on bubbles. The effect of the orifice interval on flow field surrounding two moving bubbles becomes obvious gradually with near to about 1 cm under present orifice condition, and two bubbles repulse each other in rising process, leading to the lager distance between bubbles than initial value. If orifice interval is small enough, two bubbles somewhat tends to rise side by side at different heights. So, later bubble is inclined to be captured by the wake of previous one in small angle of linking line of two bubble centers with vertical direction, which results in the acceleration of later one toward previous one and the consequent decrease of distance between bubbles with the rising of bubbles. Generally, the interaction between two bubbles changes from repellence to attraction with the decrease of angle, which essentially is a competitive result of repellence in horizontal direction and attraction in vertical direction.
1 Crabtree, J.R., Bridgwater, J., “The wakes behind two-dimensional air bubbles”,..., 22, 1517-1522 (1967).
2 Bessler, W.F., Littman, H., “Experimental studies of wake behind circularly capped bubbles”,.., 185, 137-151 (1987).
3 Tsuchiya, K., Fan, L.S., “Near-wake structure of a single gas bubble in a two-dimensional liquid-solid fluidized bed: Vortex shedding and wake size variation”,..., 43, 1167-1181 (1988).
4 Komasawa, I., Otake, I., “Wake behind and its effect on interaction between spherical-cap bubble”,..., 13, 103-109 (1980).
5 Chen, R.C., Chou, I.S., “Wake structure of a single bubble rising in a two-dimensional column”,..., 17, 165-178 (1998).
6 Chen, R.C., Wang, F.M., Lin, T.J., “Bubble wake dynamics of a single bubble rising in a two-dimensional liquid-solid fluidized bed”,..., 54, 4831-4838 (1999).
7 Hassagar, O., “Negative wake behind bubbles in non-Newtonian liquids”,, 279, 402-403 (1979).
8 Bisgaard, C., Hassager, O., “An experimental investigation of velocity fields around spheres and bubbles moving in non-Newtonian liquid”,., 21, 537-548 (1982).
9 Arigo, M.T., McKinley, G.H., “An experimental investigation of negative wakes behind spheres settling in a shear-thinning viscoelastic fluid”,., 37, 307-327 (1998).
10 Herrera-Velarde, J.R., Zenit, R., Chehata, D., Mena, B., “The flow of non-Newtonian fluids around bubbles and its connection to the jump discontinuity”,.-.., 111 (2/3), 199-209 (2003).
11 Funfschilling, D., Li, H.Z., “Effects of the injection period on the rise velocity and shape of a bubble in a non-Newtonian fluid”,...., 84 (10), 875-883 (2006).
12 Funfschilling, D., Li, H.Z., “Flow of non-Newtonian fluids around bubbles: PIV measurements and birefringence visualization”,..., 56, 1137-1141 (2001).
13 Kemiha, M., Frank, X., Poncin, S., Li, H.Z., “Origin of the negative wake behind a bubble rising in non-Newtonian fluids”,..., 61 (12), 4041-4047 (2006).
14 Frank, X., Li, H.Z., “Complex flow around a bubble rising in a non-Newtonian fluid”,.., 71, 036309 (2005).
15 Frank, X., Li, H.Z., “Negative wake behind a sphere rising in viscoelastic fluids: A lattice Boltzmann investigation”,.., 74, 056307 (2006).
16 Lin, T.J., Lin, G.M., “An experimental study on flow structures of a single bubble rising in a shear-thinning viscoelastic fluid with a new measurement technique”,.., 31 (2), 239-252 (2005).
17 Sousa, R.G., Riethmuller, M.L., Pinto, A.M.F.R., Campos, J.B.L.M., “Flow around individual Taylor bubbles rising in stagnant polyacrylamide (PAA) solutions”,.-.., 135, 16-31 (2006).
18 Sousa, R.G., Riethmuller, M.L., Pinto, A.M.F.R., Campos, J.B.L.M., “Flow around individual Taylor bubbles rising in stagnant CMC solutions: PIV measurements”,..., 60 (7), 1859-1873 (2005).
19 Sousa, R.G., Pinto, A.M.F.R., Campos, J.B.L.M., “Effect of gas expansion on the velocity of a Taylor bubble: PIV measurements”,.., 32 (10/11), 1182-1190 (2006).
20 Sousa, R.G., Pinto, A.M.F.R., Campos, J.B.L.M., “Interaction between Taylor bubbles rising in stagnant non-Newtonian fluids”,.., 33 (9), 970-986 (2007).
21 van Wijnggaarden, L., Jeffrey, D.J., “Hydrodynamic interaction between gas bubbles in liquids”,., 77, 27-44 (1976).
22 Kok, J.B.W., “Dynamics of a pair of gas bubbles moving through liquid (I) Theory”,..,/, 4, 515-540 (1993).
23 Legendre, D., Magnaudet, J., Mougin, G., “Hydrodynamic interactions between two spherical bubbles rising side by side in a viscous liquid”,., 497, 133-166 (2003).
24 Sanada, T., Sato, A., Shirota, M., Watanabe, M., “Motion and coalescence of a pair of bubbles rising side by side”,..., 64, 2659-2671(2009).
25 Chen, R.C., Reese, J., Fan, L.S., “Flow structures in a three-dimensional bubble column and three-phase fluidized bed”,., 40, 1093-1104 (1994).
26 Prasad, A.K., “Stereoscopic particle image velocimetry”,., 29, 103-116 (2000).
2009-02-11,
2009-10-12.
the National Natural Science Foundation of China (20476073), the State Key Laboratory of Chemical Engineering (SKL-ChE-08B03) and the Programs of Introducing Talents of Discipline to Universities (B06006).
** To whom correspondence should be addressed. E-mail: ygma@tju.edu.cn
猜你喜欢
杂志排行

Chinese Journal of Chemical Engineering的其它文章
- Kinetic Rate Constant of Liquid Drainage from Colloidal Gas Aphrons*
- β-Diketones at Water/Supercritical CO2 Interface: A MolecularDynamics Simulation*
- Analysis of Sucrose Esters with Long Acyl Chain by Coupling ofHPLC-ELSD with ESI-MS System*
- Adsorptive Removal of Copper Ions from Aqueous Solution UsingCross-linked Magnetic Chitosan Beads
- Gas Flow in Unilateral Opening Pulse Tubes Based on Real Gas Equation of State
- Solubility of Piperine in Supercritical and Near Critical Carbon Dioxide*