Laser-induced plasma formation in water with up to 400 mJ double-pulse LIBS
2024-03-18MarionHENKELMichelleSIEMENSRalfMETHLINGBenjaminEMDErgHERMSDORFSteffenFRANKEandDiegoGONZALEZ
Marion HENKEL ,Michelle SIEMENS ,Ralf METHLING ,Benjamin EMDE ,Jörg HERMSDORF ,Steffen FRANKE and Diego GONZALEZ
1 Leibniz Institute for Plasma Science and Technology (INP),Felix-Hausdorff-Straße 2,Greifswald 17489,Germany
2 Laser Zentrum Hannover e.V.(LZH),Hollerithallee 8,Hannover 30419,Germany
Abstract Double-pulse LIBS is a promising technique for deep-sea applications.LIBS measurements in shallow water with up to 400 mJ each pulse were done to select laser parameters which promote optimized spectral line emission from plasma even at elevated pressures,where line broadening until loss of most of the spectral information can occur.Optical emission spectroscopy,using a Czerny-Turner spectrometer,has been applied to investigate the dependence of the emitted radiation on laser parameters and hydrostatic pressure.It has been found,that higher laser pulse energies,especially with short pulse delay as required in high water pressure,can also have an adverse effect on the measured spectrum.
Keywords: double-pulse LIBS,underwater,plasma formation,emission spectrosocpy
1.Introduction
The demand for raw materials continues unabated and deepsee mining is a potential source of new raw materials.However,raw material exploration with minimum environmental hazard would require a non-invasive method for elemental composition analysis applicable in the deep-sea.
Laser-induced breakdown spectroscopy (LIBS) is an established method for analyzing material samples to examine their elemental composition.For this,a pulsed laser beam is focussed on the sample surface.Pulse energies of several tens of millijoules and pulse durations in the order of nanoseconds are sufficient to evaporate a small amount of the sample material and to excite it.Thereafter,the generated plasma emits specific line radiation during the cool down,depending on the elemental composition.Using LIBS underwater makes it particularly interesting for raw material exploration in the deep-sea.
Previous publications (e.g.[1-3]) have shown that double-pulse LIBS is a promising technique for underwater applications.There,the first laser pulse creates a cavity close to the sample surface.The second laser pulse excites this gaseous state and forms the plasma plume inside the cavity.It has been reported that long pulse excitation (~150 ns) is effective for an observation of well separated and narrow spectral lines according to the material composition [4].Further,different laser setups were investigated,e.g.longshort double-pulse LIBS [5] or coaxial-parallel multi-pulse LIBS [6].
However,in all these underwater applications the growth of the plasma plume is limited by the almost incompressible water,which leads to a shorter lifetime and smaller plume size [4] compared to LIBS measurements in atmosperic conditions.Previous studies have shown a strong increase of the continuum radiation and a significant broadening of the atomic emission lines at higher hydrostatic pressure [7].While this broadening mechanism in water is assumed to be dominated by Stark broadening [8],electron recombination or black-body radition of optically thick plasmas at high water pressures may occur as well.These effects introduce additional challenges in spectral analysis of line radiation due to time averaging,especially for short lifetimes of the plasma at high pressures.
In preparation for measurements at hydrostatic pressures of up to 60 MPa,as typical in the deep-sea,an optimal set of laser parameters has to be found,which promote optimized spectral line radiation from plasma even at elevated pressure,where line broadening until lost of most of the informations occurs.Hence,the focus of this work is to study the dependence of the generated plasma and its emitted radiation on the laser pulse energies and the laser pulse delay.In order to be able to observe the influence of the laser parameters without pressure effects,shallow water is used in this study.To get an indication for the behaviour in elevated hydrostatic pressure,these measurements were done with long as well as with short laser pulse delay,as reqiured in case of reduced cavity lifetime in high water pressures.
2.Experimental setup
The schematic experimental setup is shown in figure 1.The samples were located in a water-filled tank.Two 1064 nm Nd:YAG lasers with an energy of up to 400 mJ each pulse and a pulse duration of 5-7 ns were expanded with a 3x magnification beam expander to a diameter of 18 mm and focused with a 50 mm or 75 mm lens onto a surface to produce a cavity on the sample surface with the first pulse and generate a plasma inside the cavity with the second pulse.The resulting plasma was observed through a sapphire window.Because of their characteristic spectra,well suited for analysis of plasma temperature and density,copper samples have been used in this work.
These experiments were made to study the influence of the laser parameters on the plasma and the measured spectra.For this purpose,a trigger scheme,as shown in figure 2,is used and different parameters have been varied: the delay between the laser pulses (t1),the exposure time (t3,t5) of the detectors (high-speed camera and Czerny-Turner spectrometer) and their delays to start acquisition (t2,t4).
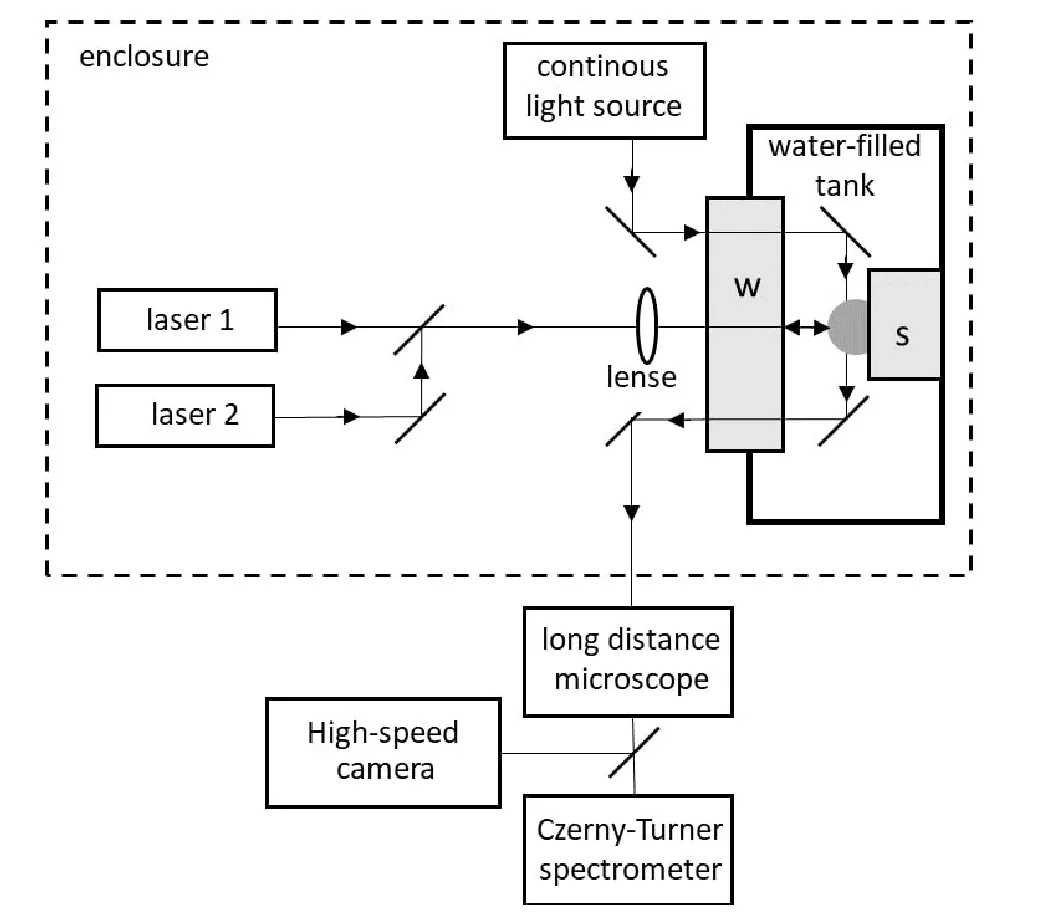
Figure 1.Sketch of the experimental setup for observation of underwater LIBS plasmas in top view.Two Nd:YAG lasers 1064 nm,each 400 mJ,5-7 ns,w: sapphire window,s: copper sample.Detection in side view and background illumination using two deflection mirrors in the water.

Figure 2.Sketch of trigger scheme -two laser pulses,each 5-7 ns duration and a delay between both (t1),t2 and t4 : delay between the second laser pulse and the respective diagnostics,t3,and t5 :exposure time of the respective diagnostics.Typical values: t3=1 μs and t5=100 ns or 10 μs.
The evolution of the cavity expansion/contraction was observed using a high-speed camera (IDT Y7) and a back illuminating continuous light source (Euromex Iluminator EK-1).All camera measurements were performed from side view parallel to the sample surface,using the deflection mirror inside the water (see figure 1).The signal was integrated over 1 s in a single frame with a repetition rate of 30 000 fps for the high-speed camera with delay t2(see figure 2).As shown in figure 3,cavities can be detected after the first laser pulse,exploiting the deflection of light at the border between cavity and water.Due to the different densities and thus the different refractive indices,a dark shadow is visible at the location of the cavity.
In contrast,the plasma radiation after the second laser pulse was measured directly without background illumination.For this,the temporal evolution of the plasma plume was investigated using a Czerny-Turner spectrometer (Roper Acton Spectra Pro 500i) with integrated ICCD camera(Princeton Instruments PI-MAX 2).The plasma was observed using the deflection mirror inside the water similar to the high-speed camera measurements.In this case,the image plane of the long distance microscope was splitted using a quartz beam splitter (Chroma 50R/50T Beamsplitter UV-VIS) and detected with the Czerny-Turner spectrometer or a camera.The exposure time for the Czerny-Turner spectrometer could be reduced to 100 ns due to the signal amplification by the ICCD modules.Hence,the time evolution of the emitted light could be measured much more precisely compared to a compact spectrometer,by shifting the trigger.
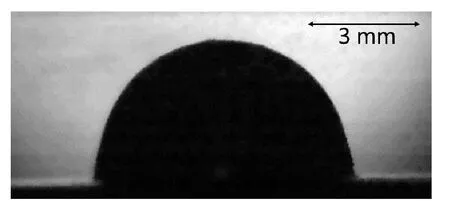
Figure 3.Shadowgraphy of a cavity at maximum extension in water at 1 bar hydrostatic pressure,t2=300 μs pulse.Focused onto a copper sample surface with a 75 mm lens.Laser setup: pulse energies E1=200 mJ and E2=70 mJ and t1=200 μs delay.
As shown in the following sections,well resolved lines can be observed from the plasma plume generated underwater.Following preferable lines are often used due to the narrow wavelength range,which have a comparable sensitivity of the sensor.Further,the associated transitions from different energy levels enable temperature calculations using the Boltzmann plot method.
3.Results
3.1.Influence of laser pulse delay on plasma radiation
During the different phases of cavity generation,expansion and contraction,a different behaviour of the plasma excitedby the second laser pulse is expected.Therefore spectra at different times of the cavity expansion were measured with the Czerny-Turner spectrometer in side view (see figure 1).The signal was integrated over the spatial dimension and over the whole plasma lifetime.The shown spectra are singleshot measurements,as well as in all following chapters.

Table 1.Atomic copper lines used for comparative studies of the spectra and determination of the plasma temperatures.
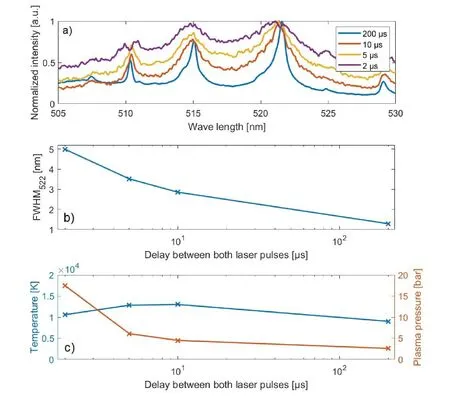
Figure 4.(a) Normalized spectra in dependence on the delay between both laser pulses t1,integrated over the spatial dimension and the whole plasma lifetime (t5=10 μs),observed from side view with the Czerny-Turner spectrometer.Laser setup: E1=200 mJ,E2=70 mJ.(b) Line width (full width half maximum) of the 521.8 nm peak and (c) estimated temperature and plasma pressure,each in dependence on the delay between the laser pulses.
Using the measured spectra of the generated plasma for the following parameter setup,three phases can be observed,which merge into each other.
Laser setup: E1=200 mJ,E2=70 mJ and t1=varied.
Diagnostics setup: t4=0 μs,t5=10 μs.
During the first phase,which occurs in the first microsecond after the first laser pulse,dominant continuous radiation and strong broadened lines occurs and can not be separated.In this phase,the cavity is still small,due to the short expansion time after the first laser pulse.Thereby,the internal pressure of the cavity is still high and dense plasma was generated,where negligible optical thickness can not be assumed.Due to absorptivities of spectral regions and complex,nonlinear dependencies on plasma properties,conventional spectral evaluation methods (e.g.Boltzmann plots) cannot be used in this phase.The transition between this phase and emerging line radiation can be seen in figure 4 for t1=2 s.
During the second phase the cavity expands and the density descends with increasing pulse delay.Thereby,the excited plasma becomes optically thinner and atomic copper lines can be observed.Nevertheless,a significant broadening of the atomic lines can be seen.A full-width-half-maximum line width (FWHM) of the peak at 521.8 nm of up to 5 nm can be found,which is significantly increased compared to the apparatus profile of 0.5 nm.
The corresponding plasma pressures can be estimated,using the following dependencies:
(1) The plasma temperature can be determined,using the peak integrated intensities of different atomic lines.Boltzmann plot calculations with the intensity ratio can be done for spectra,classified in phase two or three.
(2) The electron density can be calculated,using the dependency of the line width on the electron density and the temperature of the plasma (λ~ ne· T-1/6).
(3) Afterwards,both values can be used,to estimate a plasma pressure,which is defined by a specific plasma composition.
The estimated temperatures and plasma pressures for different delays between the laser pulses can be seen in figure 4(c).The dominant Stark broadening at low delays between both laser pulses indicates plasma pressures in the order of megapascals [9],where relevant pressure effects still exists.Therefore,this phase is not preferable for underwater LIBS applications,but unavoidable due to the reduced cavity lifetime in elevated water pressures.Nevertheless,a trend towards decreasing plasma pressure is recognizable(see figure 4(b)) and a change into the third,stable phase at around t1=50 μs focusing.
In the second and third phase,well resolved lines can be observed,the continuous radiation has mostly disappeared and the averaged plasma temperature stays almost the same,as shown in figure 4(c),estimated using Boltzmann plot calculations.As shown in previous publications of Cui et al(e.g.[5]),this phase of stable conditions is advantageous for LIBS applications.However,in case of high hydrostatic pressures,the cavity lifetime is strongly reduced [7].Because of this,a maximum delay of a few microseconds is feasible,and continuous radiation and line broadening are always existent.
Summarized,a delay between both laser pulses of more than 50 μs no longer be achieved.Therefore,two different delays between the laser pulses were investigated in the followings,one above this limit and one below it.This will then be used to increase the line-to-continuous ratio and to reduce the line width and thereby to improve the spectral analysis.
3.2.Influence of laser pulse energy on the cavity and plasma generation
To ensure underwater LIBS measurements even at high hydrostatic pressures of hundreds of bars as typical for deepsea application,high laser pulse energies are applied.However,with laser pulse energies up to several hundred millijoules,various effects such as multiple breakdowns in water,plasma heating and cavity formation superpose.Therefore,the efficiency of an increase of laser pulse energy was tested,comparing the size of the generated cavities and the resulting plasma emission for different laser pulse energies.
In order to make a comparison between conditions that occur in shallow water and those at higher hydrostatic pressures,two different exemplary laser pulse delays are examined in the following.Since it could be observed that the spectra remained the same in shallow water from a certain cavity size and thus from a certain pulse delay,the pulse delay was set to t1=200 μs between both pulses for this measurements.Additionally,the experiments were repeated with a pulse delay of 10 μs,to indicate effects in case of reduced cavity lifetime.However,for measurements with elevated water pressure,where optically thin plasmas could no longer be assumed,the delay should be adapted to the maximum expansion depending on the laser pulse energies and the water pressure.
Variation of the first laser pulse
Laser setup: E1=varied,E2=70 mJ and t1=200 μs or 10 μs.
Diagnostics setup: t2=0 μs,t3=1 μs and t4=0 μs,t5=10 μs.
To study the influence of the first laser pulse energy on the cavity generation,a high-speed camera was used in side view (see figure 1) with back illumination and a repetition rate of 30,000 fps.Whereas the related cavity is mostly spherical in atmospheric conditions [4],a disc-shaped cavity with a diameter of the laser focus was observed in shallow water [4],since the quasi non-compressible water reduces the growth.However,due to the significantly increased laser pulse energy of up to 400 mJ for the first laser pulse,a mostly spherical cavity arises at shallow water (see figure 3).In order to calculate a cavity volume from the shadowgraphy,the cavity shape is approximated as a half-ellipsoid,using the size parallel and perpendicular to the sample surface at the maximum expansion.These measurements were performed five times for each laser pulse energy and compared with the measured spectra.A more detailed study of the cavity size and expansion rate will be published in [10].
It has been found,that no cavities arise at laser pulse energies below 15 mJ.Including the focusing of the laser(e.g.focal length),this indicates a breakdown threshold of the laser fluence in the order of 103J mm-2,which is significantly higher than those published by Tian et al [11].Additionally,the size and the lifetime of the cavity are smaller as expected using the formulas of Lazic et al [12].Consequently,the fraction of the laser pulse energy used for cavity generation and material erosion and evaporation could be estimated as approximately 6% (formula in [12]).A large part of the energy was lost through absorption of the laser pulse in water with a path length of 30 mm.This value should be enhanced by reducing the distance inside the waterfilled tank,to minimize absorption of the laser pulse.
Further,the plasma emission was recorded after the second laser pulse for several energies of the first pulse.For figure 5,the signal was measured with the Czerny-Turner spectrometer in side view (see figure 1) and was integrated over the spatial dimension and the whole plasma lifetime.The shown spectra are single-shot measurements.It can be seen in figure 5(a),that the line ratios kept constant and the continuous radiation slightly decreased in case of 200 μs between the pulses.A comparable behavior can also be found for a delay of 10 μs between the pulses (see figure 5(b)),whereby the line width is larger,due to the smaller cavity size and thereby higher averaged pressure.
The laser pulse energy has an influence not only on the maximum cavity size,but also on the expansion rate and thus the cavity size during the second laser pulse.However,no significant influence of the first laser pulse energy on the plasma temperature or pressure,indicated by the line width,can be found.This indicates that the internal pressure of the cavity at a fixed time does not change significantly with the energy of the first laser pulse.This leads to the assumption that increasing the laser pulse energy has no advantage for the measured spectra.However,increasing the energy leads to a longer lifetime of the cavity.This means that larger pulse delays can be used even in elevated water pressure,which leads to an improvement in line width (see figure 4).Despite these advantages,it must be kept in mind that the probability of multiple breakdowns (see [13]) increases with increasing laser pulse energy.However,due to the longer lifetime of the cavity,energies of up to 400 mJ for the first pulse are advantageous,even if an increase in laser pulse energy does not lead to an decrease in line width.
Variation of the second laser pulse
Laser setup: E1=200 mJ,E2=varied and t1=200 μs or 10 μs.
Diagnostics setup: t4=0 μs,t5=10 μs.
In the next step,the influence of the second laser pulse energy on generated plasma was studied,using the Czerny-Turner spectrometer in side view,in which the signal was integrated over the spatial dimension and the whole plasma lifetime.In this parameter range,no influence on the cavity could be determined.This can be explained by the fact that the cavity is already large enough to be nearly optically thin and therefore absorbs only a neglectible amount of the laser pulse energy.
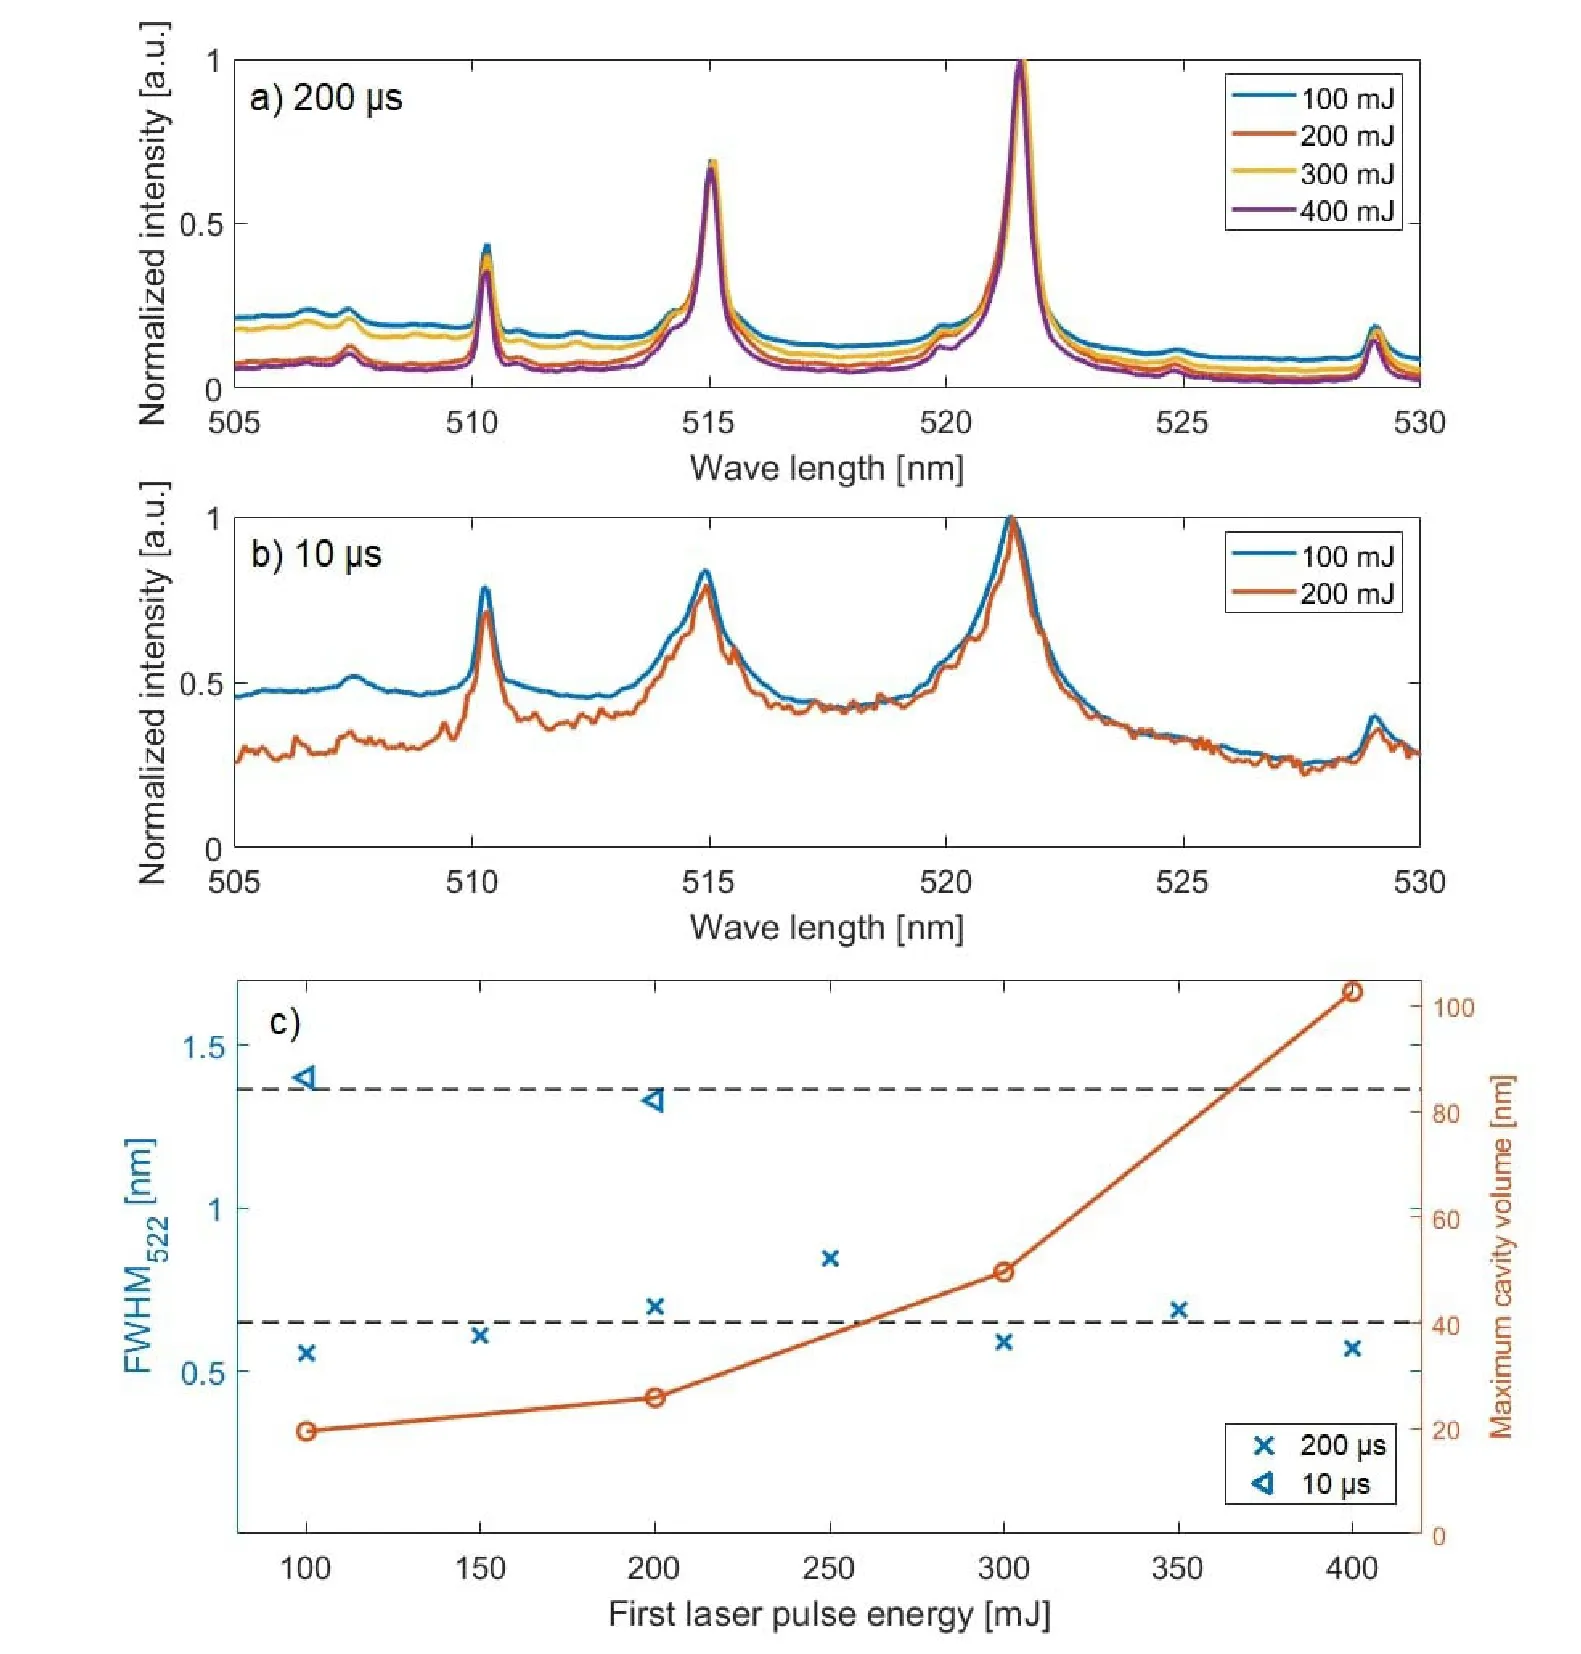
Figure 5.Normalized spectra integrated over the spatial dimension and the whole plasma lifetime (t5=10 μs) in dependence on the first laser pulse energy,observed from side view with the Czerny-Turner spectrometer.Laser setup: E2=70 mJ,t4=0 μs,(a) t1=200 μs or (b)t1=10 μs.(c) Line width (full width half maximum) of the 521.8 nm peak und the maximum volume of the generated cavity,both in dependence on the energy of the first laser pulse.
As previously shown by Adamson et al [14],the line ratios and therefore the plasma temperature is relatively insensitive to the increases in laser pulse energies as well,most likely due to the self-shielding of the plasma.Similar characteristics can be found in figures 6(a) and (b),where the ratios of the peak integrated copper lines were mostly insensitive to the second laser pulse energy.Only the continuous radiation increases slightly with increasing second laser pulse energy.
On the other side,the line width in figures 6(b) and (c)(t1=10 μs) increases with the increasing energy of the second laser pulse.This is caused by an increasing plasma pressure,as shown in figure 6(d).Since the temperature determined from Boltzmann plot calculations does not change appreciably,this means an increasing copper particle density.For a pulse delay of 200 μs (figure 6(a)) this effect is not visible,probably due to the apparatus profile of 0.5 nm.
Hence,a higher laser pulse energy leads to higher copper evaporation,which seems to be dominated by the second pulse,and thus to a higher plasma pressure and higher line width.Since an increase in the line width superposes for short delays between the laser pulses and high energies of the second laser pulse,this is disadvantageous for elevated water pressures.That is why the energy should be set as low as possible,depending on energy losses in water and breakdown threshold limit.
Summarized,scaling up the laser pulse energy of the first laser pulse could be advantageous for underwater doublepulse LIBS.The lifetime of the cavity increases and higher pulse delays can be used,which decreases the line width.On the other hand,an increase of the second laser pulse energy is disadvantageous,since the plasma pressure and thereby the line width increases.
3.3.Time evolution of the plasma radiation
To explore the temporal evolution of both,continuous radiation and atomic line radiation,a double-pulse with reference setup was used.Since the field of view of the observed region of the plasma in side view depend on the propagation behavior of the plasma,the signal was integrated over the spatial dimension.The spectra were measured using a Czerny-Turner spectrometer with an exposure time of t5=100 ns.This enables investigations of the time evolution of the emitted radiation by shifting the trigger of the data aquasition of the spectrometer.
Laser setup: E1=200 mJ,E2=70 mJ and t1=10 μs.
Diagnostics setup: t4=varied,t5=100 ns.
As shown in figure 7(a),the resulting spectra consist of two contributions;a continuum,which is emitted by a high temperature and high density plasma which is dominant in the first 100 ns,and spectral lines,which are emitted by state transitions of the electrons in the plasma.It can be seen,that the continuous radition occurs during the first few nanoseconds,whereas it is dominant only in the first 100 ns.After 100 ns the line radiation is dominant and well separated atomic lines can be observed.
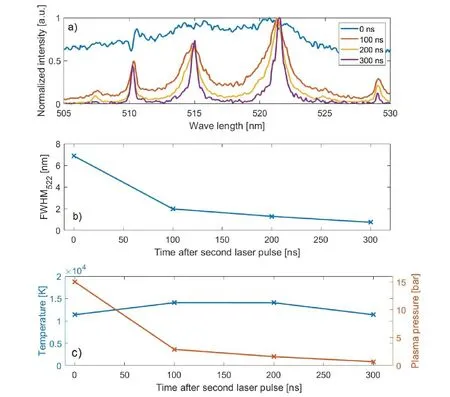
Figure 7.(a) Normalized spectra in dependence on the detection time after the second laser pulse t4,with an exposure time of t5=100 ns and integrated over the spatial dimension,observed from side view with the Czerny-Turner spectrometer.Laser setup: E1=200 mJ,E2=70 mJ and t1=10 μs,(b) Line width (full width half maximum) of the 521.8 nm peak and (c) estimated temperature and plasma pressure,each in dependence on the time after the second laser pulse.
In order to be able to calculate plasma temperatures from the measured line spectra,Boltzmann plots calculations were done.Whereas the line width is reduced by almost an order of magnitude in the first 300 ns (see figure 7),the variation of the plasma temperature is less than 20%.From this,it can be deduced that the line width is mainly determined by the copper density,which decreases by a factor of about three.Since a smaller line width and thus a lower copper density are beneficial,as previously decribed in section 3.2,starting the exposure of the detectors a few hundred nanoseconds after the second laser pulse are advantageous.
However,such plasma lifetimes can not longer be guaranteed due to the reduced cavity lifetime at desired hydrostatic pressures.In addition,usually compact spectrometers are used in underwater LIBS applications,so that a selection of individual time periods is only possible to a limited extent due to the higher exposure time.That is why,both skipping the time range dominated by continuous radiation in the first few tens or hundreds of nanoseconds and integrating over the stable phase with the compact spectrometer should be prefered.
4.Conclusions
Both,the influence of laser pulse energies and the delay between both pulses on the plasma and its emission were investigated.Therefore,underwater double-pulse LIBS measurements were done with up to 400 mJ for each laser pulse,focused on a copper sample.
First,the influence of the delay between both laser pulses(t1) was investigated.In shallow water,consistent plasma temperatures were detected for t1> 2 μs.However,in elevated hydrostatic pressures,delays of 1-10 μs are realistic due to a strongly reduced lifetime of the cavity.For these values in shallow water strong line broadening occurs,which makes line evaluations such as elemental analysis more difficult.
It could be observed that the energy of the first laser pulse has no significant influence on the measured spectra,particularly the line width.Consistent spectra with well separated atomic lines can be detected for both investigated cases of 200 μs and 10 μs laser pulse delay.However,a higher laser pulse energy of up to 400 mJ leads to a longer cavity lifetime and might be therefore beneficial for elevated water pressure,where the lifetime is significantly reduced.Therefore,the first laser pulse energy should be chosen as high as possible,taking into account the probability of multiple breakdowns as upper limit.
The energy of the second laser pulse has no or only weak influence on the plasma temperatures that was calculated from spectroscopy.However,a higher second laser pulse energy leads to higher copper evaporation and thereby to a higher plasma density and stronger broadened lines.This effect is boosted by the higher plasma densities for short delays between the pulses,which have to be used in elevated hydrostatic pressures.For this reason the second laser pulse energy should be as low as possible.
Moreover,the time evolution of the spectrum after the second laser pulse was investigated,to find the optimal time range for spectral analysis.While the disturbing continuous radiation decreased after 100 ns,the atomic line radiation is measurable up to several hundred nanoseconds.Furthermore,the evolution of plasma pressure and therefore the line width of the detected spectra decreases with time after the second laser pulse.Therefore,skipping the preceding signal for a few hundred microseconds and integrating over the remaining plasma lifetime could be advantageous for future LIBS experiments with high hydrostatic pressures,where usually strong line broadening exists.
These first experiments have shown that a double-pulse LIBS with up to 400 mJ each laser pulse is a promising technique for underwater material analysis.Even if an elevated hydrostatic pressure will lead to reduced lifetimes and strongly broadened lines,these measurements showed some possibilities for optimizing the spectrum even at high water pressures.
Acknowledgments
This project was funded by the Deutsche Forschungsgemeinschaft (DFG,German Research Foundation) -Project No.454848899.
Data availability
The shown spectral data is openly available at DOI: 10.34711/inptdat.728.Futher spectral data,that supports the findings of this study can be found at DOI: 10.17632/prbyc6kypk.1,whereas the camera data is openly available at DOI: 10.17632/pfntdc9ndy.1.
杂志排行
Plasma Science and Technology的其它文章
- Preliminary electromagnetic analysis of the COOL blanket for CFETR
- Plasma nitrogen fixation system with dual-loop enhancement for improved energy efficiency and its efficacy for lettuce cultivation
- Influence of the position relationship between the cathode and magnetic separatrix on the discharge process of a Hall thruster
- A spatiotemporal evolution model of a short-circuit arc to a secondary arc based on the improved charge simulation method
- Different bactericidal abilities of plasmaactivated saline with various reactive species prepared by surface plasmaactivated air and plasma jet combinations
- Modification of streamer-to-leader transition model based on radial thermal expansion in the sphere-plane gap discharge at high altitude
