Modification of streamer-to-leader transition model based on radial thermal expansion in the sphere-plane gap discharge at high altitude
2024-03-18JianghaiGENG耿江海GuoLIN林果PingWANG王平YujianDING丁玉剑YangDING丁杨andHuaYU俞华
Jianghai GENG (耿江海) ,Guo LIN (林果) ,Ping WANG (王平),* ,Yujian DING (丁玉剑) ,Yang DING (丁杨) and Hua YU (俞华)
1 Department of Electric Power Engineering,North China Electric Power University,Baoding 071003,People’s Republic of China
2 China Electric Power Research Institute,Beijing 100192,People’s Republic of China
3 Xinjiang Electric Power Company Research Institute,Urumchi 830000,People’s Republic of China
4 Shanxi Electric Power Company Research Institute,Taiyuan 030001,People’s Republic of China
Abstract Historically,streamer-to-leader transition studies mainly focused on the rod-plane gap and low altitude analysis,with limited attention paid to the sphere-plane gap at high altitude analysis.In this work,sphere-plane gap discharge tests were carried out under the gap distance of 5 m at the Qinghai Ultra High Voltage (UHV) test base at an altitude of 2200 m.The experiments measured the physical parameters such as the discharge current,electric field intensity and instantaneous optical power.The duration of the dark period and the critical charge of streamer-toleader transition were obtained at high altitude.Based on radial thermal expansion of the streamer stem,we established a modified streamer-to-leader transition model of the sphere-plane gap discharge at high altitude,and calculated the stem temperature,stem radii and the duration of streamer-to-leader transition.Compared with the measured duration of sphere-plane electrode discharge at an altitude of 2200 m,the error rate of the modified model was 0.94%,while the classical model was 6.97%,demonstrating the effectiveness of the modified model.From the comparisons and analysis,several suggestions are proposed to improve the numerical model for further quantitative investigations of the leader inception.
Keywords: streamer-to-leader transition model,high altitude,streamer stem,convective diffusion,radial thermal expansion
1.Introduction
Under the strategic planning for carbon peaking and carbon neutrality,the State Grid Corporation of China develops wind and solar energy in high altitude areas of western China [1,2].However,the external insulating performance of electrical equipment decreases as the altitude rises,owing to the variable physical parameters during the process of the discharge,especially the transition from streamer to leader [3].Therefore,studying the transition from streamer to leader at high altitudes has important implications for the design of external insulation in power transmission systems.
Historically,the model of streamer-to-leader transition in gap discharges had been defined by Gallimberti’s model [4-6].Gallimberti proposed a V-T relaxation process based on thermodynamic theory in which vibrational energy was converted to translational energy in the conversion process and built a leader-initiated thermal equilibrium model to investigate the thermal properties of the streamer-to-leader transition process [7,8].A modified model of streamer-toleader transition involving convective diffusion had been established in the literature [4],but the time-varying law of the temperature and radius of the streamer stem during the streamer-leader transition process at high altitude has not been studied.The experimental platform of the thermal characteristics observation system with a 1 m rod-plane gap was set up in the literature [5],and the influence of different initial radii of the streamer stem on the temperature change during the dark period was analyzed by Gallimberti’s model.In reference [9],a numerical model was established to study the expansion of the leader channel,and the results show that the simulation results of the leader channel’s diameter are in good agreement with the experimental results of the 1 m rodplane air gap.Although previous studies have been fruitful,the research on the discharge of full-scale sphere-plane still needs to be further studied.
Moreover,radial thermal expansion of streamer-to-leader transition during the dark period cannot be ignored.In references [10,11],the SIMD8 ICCD camera was used to record photos of the streamer’s progression with the frame rate of 10 ns and those photos showed that the streamer channels clearly expanded radially along with time.The discharge parameters of the positive discharge channel near the rod electrode were analyzed in the literature [12],and the discharge channel’s initial thermal diameter was obtained by analyzing the variations in the channel’s thermal diameter with time under switching impulse voltage.In reference[13],the established model was compared with Gallimberti’s model,and the current waveform was input.The calculation results of gas temperature showed that the time-varying law was different in the dark zone time.The gas temperature simulation results of the former gradually decreased in the dark zone time and were not affected by humidity,while the results of the latter gradually increased and were affected by humidity.The above thermodynamic model construction has important inspiration for this study,such as using the measured current as the model input and studying the discharge process based on the classical model.But the above studies do not consider the thermal expansion of the streamer stem,which will lead to a rapid increase in the temperature rise rate of the streamer stem,a decrease in the streamer-leader transition time,and a certain error in the temperature calculation.
For high-altitude conditions,most of the existing studies were conducted in air pressure chambers,rarely in actual high-altitude areas.Reference [14] measured the average propagation velocity of streamers between parallel plates under different pressures in a pressure chamber,it was found that the streamer stability propagation field increased with the rise of air pressure.In reference [15],the channel’s diameter and the pattern of discharge branching were measured at different pressures in a pressure chamber,and it was found that the streamer channel’s diameter increased with decreasing pressure.Reference [16] studied rod-plane gap discharges in a pressure chamber,and found that the critical streamer-to-leader conversion temperature was 1300-2000 K when the pressure was 30-100 kPa.The above-mentioned variation of streamer stem diameter with pressure and the range of critical temperature of streamer-leader transition have important inspiration for this work.But,the law of lowpressure rod-plane gap discharge cannot be directly applied to evaluate the insulating property of sphere-plane air gaps at high altitudes,which directly affects the technical requirements of high-altitude converter station valve hall insulation.
Given the foregoing challenges,the sphere-plane gap discharge tests were conducted under the 250/2500 μs positive switching impulse voltage in Qinghai,China to examine the streamer-to-leader transition at an altitude of 2200 m.Based on the above tests,we measured the physical parameters,such as discharge current,voltage,electric field intensity,and optical power,and then studied the rules of variation among the starting voltage of the initial streamer,injected charge,and dark period.Taking into account the convective diffusion effect and radial thermal expansion of streamer stems,a modified streamer-to-leader transition model was established.From the comparison between the simulation results and the experimental data,several suggestions are proposed to improve the numerical model for further quantitative investigations of the leader inception.
2.Experimental setup and streamer-to-leader transition mechanism
2.1.Experimental setup
As seen in figure 1,a test platform was installed at an altitude of 2200 m,and the spherical electrode used in the test had a diameter of 0.6 m.The positive 250/2500 μs impulse voltage generated by a 6000 kV/560 kJ Marx generator was applied to the gap.A combined photoelectric detection system consisting of an electric field sensor and a photomultiplier tube (PMT) was constructed,and the photoelectric integrated electric field sensor was used to measure the electric field through the Pockels effect of LiNbO3crystal,and the parameters of the PMT system were reasonably selected to enable it to measure the optical signal of the entire discharge channel.The optical signals were measured by a Hamamatsu H11461-09 solar blind PMT,which was placed at the position 50 mm away from the axis of the gap and,facing the gap.The spectral response of the PMT is 160-320 nm and the bandwidth of its amplifier unit is DC-1 MHz.The horizontal distance between the PMT and electric field sensor probes and the spherical electrode axis was 4.44 m,while the height from the ground was 3 m.The distance between the top spherical electrode and the bottom plane was 5 m.

Figure 1.Schematic diagram of the test platform.
During the test,the temperature was 16.2 °C,the absolute humidity was 9.51 g m-3,and the gas pressure was 75.4 kPa.In each test,the voltage signal output from the voltage divider was used as the trigger source.When the amplitude exceeded the trigger level,the oscilloscope simultaneously collected the electric field strength,instantaneous optical power,and voltage signals.The transmission delay of each channel’s signal was corrected during data processing.Meanwhile,in order to avoid the influence of transient interference of discharge and ground potential rise,the signal data was transmitted by optical fiber to strictly guarantee the synchronization of the data.In this work,40 discharge tests at the same voltage rise rate were carried out.
2.2.Experimental results
In order to facilitate the display,we selected typical discharge data from 40 sets of experimental data for analysis,the spatial field intensity and instantaneous optical power were shown in figure 2.
In the initial streamer stage (t1=54.4-66.4 μs),the PMT first detected a pulse with an optical power amplitude of 248.95 pW,and the electric field strength had increased significantly.After 66.4 μs,the first streamer was discontinued,and the optical power was almost 0 pW.The collision between free electrons and gas molecules made the temperature of the streamer channel increase continuously.
When the gas temperature reached 1500 K,the crucial thermal ionization temperature [16-18],negative ions were exceedingly unstable and were desorbed to create free electrons,increasing the net positive charge in the channel and causing the space electric field to jump,as shown in 104.4 μs of figure 2.
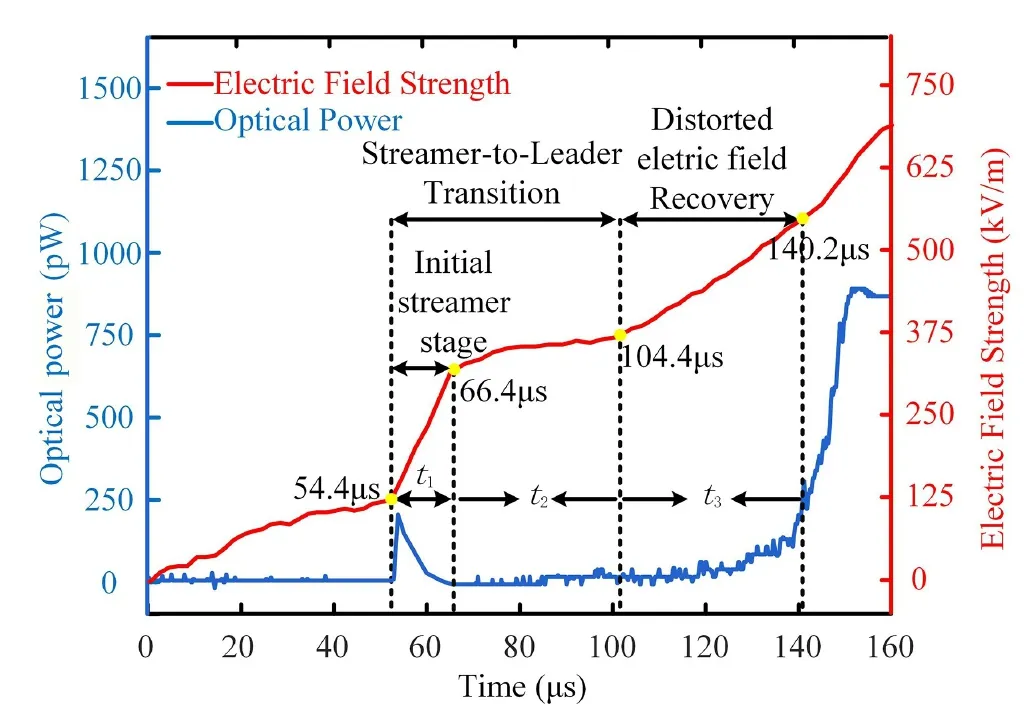
Figure 2.Electric field strength and optical power characteristic curve.
The initial leader was established at 104.4 μs,which was regarded as the point of transition from streamer to leader[19-23].We took the turning point when the field strength amplitude changes significantly in the period when the optical power was almost 0 pW as the completion time of the streamer-to-leader transition.The sum of t1and t2was the streamer-to-leader transition time [4].The distorted electric field was recovered in the t3stage (t3=104.4-140.2 μs).The sum of the streamer-to-leader transition time (t1+t2) and the recovery time of the distorted electric field (t3) was the dark period [24].With the supply of voltage to the electrode and the drift and diffusion of positive charges in space,the electric field strength gradually recovered and the streamerleader system began to develop forward at 140.2 μs,subsequently,the PMT was measured to indicate that the optical power surge.
3.Injected charge by initial streamer
The injected charge by the initial streamer and the duration of the dark period are two essential conditions for the transition from streamer to leader.The transition time from streamer to leader dropped as the increase of injected charge into the initial streamer in rod-plane gap discharge [6].The streamer channel was transformed into a leader channel in rod-plane gap with a curvature radius of 0.01 m when the injected charge surpassed 0.22 μC [23].This work investigated the injected charge by initial streamer as well as the duration of dark periods in sphere-plane gap discharges.
Waveforms of the switching impulse voltage and discharge current are shown in figure 3.t1represents the process of initial streamer discharge.When the time reaches 140.2 μs,the leader discharge starts.
The injected charge of the streamer channel during discharge can be obtained by integrating the discharge current waveform with time.The representative 24 groups of injected charge and starting voltage of initial streamer at the same voltage rise rate were chosen for analysis of discharge parameters,and the statistical results are shown in figure 4.Compared with the literature [23],the injected charge of sphere-plane gap during streamer-to-leader transition is in the range of 2.4-6.0 μC in this work,which is significantly greater than the charge of rod-plane gap.Accordingly,the difference indicates that the required inject charge goes up with the curvature radius.
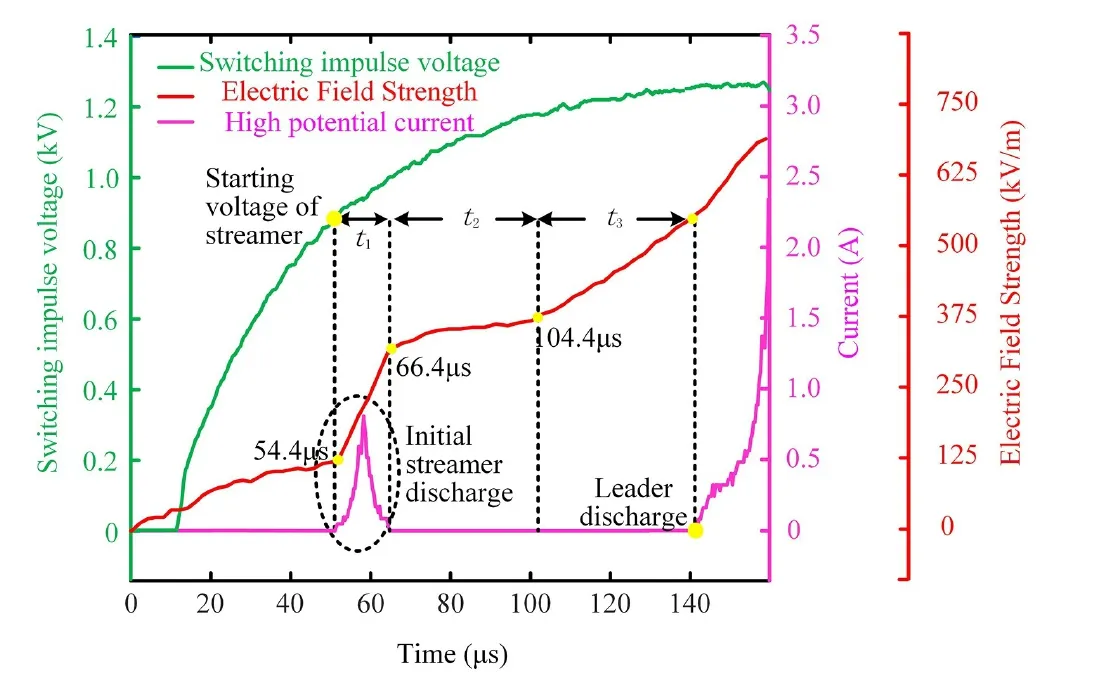
Figure 3.The operating impulse voltage is synchronized with thedischarge current waveform.
As can be seen from figure 4,the injected charge of the initial streamer increased with the increase of the starting voltage.When the starting voltage of the streamer was 824-862 kV,the injected charge of the initial streamer was in the range of 2.4-4.5 μC.When the starting voltage of the streamer was 865-885 kV,the injected charge by the initial streamer was stabilized at 5.2-5.9 μC,and the streamer was successfully converted into the leader,leading to gap breakdown.
The dark period is a crucial stage of leader initiation[24].We selected the corresponding 10 sets of leader breakdown data from the above 24 sets of data to analyze the relationship between the injected charge by the initial streamer and the dark period,as shown in figure 5.
According to figure 5,the sum of the streamer-to-leader transition time and the recovery time of the distorted electric field is the duration of dark period.When the injected charge of the initial streamer increased from 5.21 μC to 5.89 μC,the dark period extended from 84 μs to 115 μs.At the same voltage level,the streamer-to-leader transition time and recovery time of the distorted electric field both grew longer with the increase of the injected charge by the initial streamer.

Figure 4.The relationship between the injected charge and the starting voltage of the initial streamer.
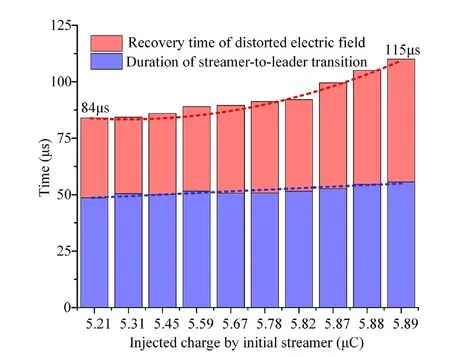
Figure 5.The relationship between the injected charge by the initial streamer and the duration of the dark period.
To sum up,the critical charge of streamer-to-leader transition at an altitude of 2200 m is in the range of 4.5-5.2 μC for 0.6 m spherical electrode discharge.The sphere-plane gap could not breakdown when the initial streamer injected charge was less than 4.5 μC.When the injected charge by the initial streamer was greater than 5.2 μC,the streamer was converted into a leader.The injected charge by the initial streamer also affected the dark period.The larger the injected charge by the initial streamer,the stronger the distorted electric field in the dark period,and the stronger the inhibition effect on leader development,the longer the duration of dark period.
4.Classical streamer-to-leader transition model
4.1.Classical model
Gallimberti established a theoretical model for streamer-toleader transition [7,8]:
where Wtand Ttrepresent the translational energy of gas molecules and the temperature of gas molecules,respectively,expressed in K;r is the initial streamer radius,expressed in m.
where k is the Boltzmann constant,k=1.38×10⁻²³J K-1,N is the density of gas molecules,N=2.686773×1025m-3,and εvis the energy required for N2molecules to excite the vibration ground state,which is taken as 0.28 eV
There are three ratios for the injected energy into the streamer stem: fe,ft,and fr,respectively,which represent the electronic excitation energy,translational energy,and rotational energy,respectively,and fv+fe+ft+fr=1
In the above equation,Tvis the vibrational energy temperature;w(Tv) is the vibrational energy corresponding to the vibrational energy temperature per unit volume of gas molecules;w(Tt) is the vibrational energy corresponding to the translational energy temperature per unit volume of gas molecules.
4.2.Simulation results
In combination with the above mathematical model,thestreamer stem temperature changing with time T(t) can be obtained by simulation,as shown in figure 6.At high altitude,the simulation duration needed to complete the streamer-to-leader transition can be obtained by taking 1500 K as the critical temperature for the streamer-to-leader transition.
The calculation results of ten groups of models are shown in table 1,and the streamer-to-leader transition durations of the classic models are represented by ta,and tszrepresents the measured duration of the experiment.According to table 1,the average error rate of the simulation duration of the classical model is 6.97%,which is relatively large.No matter how many iterations there are,the error rate can still not be reduced.Therefore,the model needs to be modified to adapt to the large sphere-plane air gap at high altitudes.
5.Modified streamer-to-leader transition model
5.1.Theoretical model that takes into account convective diffusion and thermal expansion
Hans Kristian Meyer et al investigated the convective diffusion of positive air gap streamer discharges and calculated the total charge σzinjected into the electrode during the transition from streamer to leader,which demonstrated a Gaussian distribution along the radial direction [25-27]:
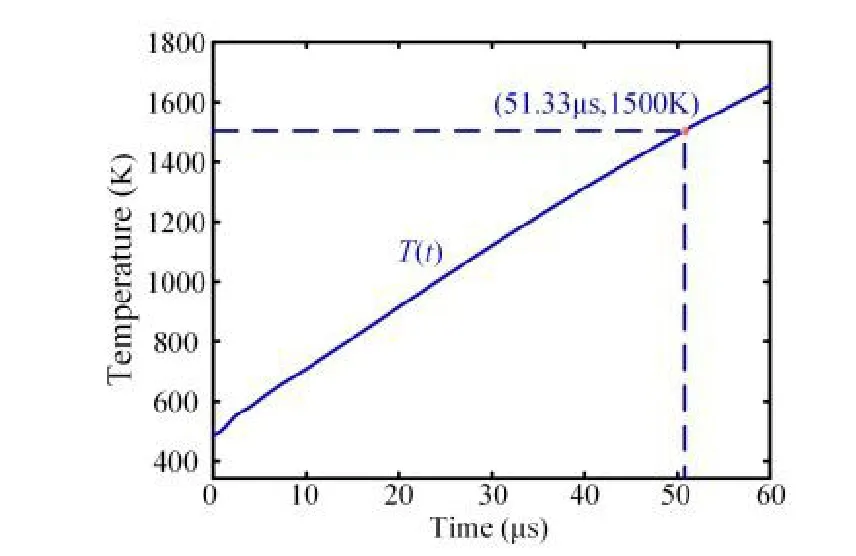
Figure 6.Simulation duration for streamer-to-leader transition.

Table 1.Injected charge and streamer-to-leader transition time of sphere-plane discharge.
where σzis the total density of the charge injected into the radial center of the stem root during the transition,λ is the distribution coefficient,taken as 10 [27],and ρ is the radial position of the stem root.
The streamer stem is divided into several coaxial microelements.The charge Qiflowing through the ith microelement segment can be expressed as:
The injected electrons in the streamer stem gradually decrease outward along the radial direction.Since the energy required for temperature rise is provided by electrons,and more electrons pass through the area near the stem root,the gas molecules get more energy,and the temperature of the gas molecules rises faster.Therefore,the temperature of the streamer stem gradually decreases radially outward from the electrode.Assuming that the peak temperature at the stem root is Tp,the high temperature zone at the center is 0.95Tp-Tp[25].When the discharge current of the initial streamer is injected,the temperature of gas molecules in the streamer stem gradually increases.When the temperature at the center of the stem root is greater than 1500 K,negative ions in the center unsteadily desorb many electrons to form the initial leader,and the high-temperature gas zones around it gradually transform into high-conductivity leader channels as the temperature rises.Now that the streamer has become the leader,it is completely transformed.
The single streamer stem’s initial high-temperature zone current is as follows:
where Iais the current flowing through the high-temperature zone of a single streamer stem,Izis the total current flowing through the initial streamer stem,and Iris the current flowing through the single streamer stem,above units of I are A.
According to reference [28],the empirical formula for the radius r of a single streamer stem is:
where Irpis the peak value of the current flowing through the single streamer stem,A.
It is assumed that the temperature distribution along the radial direction of the streamer is Gaussian,and the radius of the streamer expands radially at a constant pressure during the thermal ionization process,the radial temperature distribution formula after expansion of the streamer stem is:
where This the translational energy temperature,K;a is the streamer radius,a0=85 μm,T is room temperature,K.
The gas molecule density per unit volume δ can be calculated by the ideal gas state equation:
When measured pressure P is 75.4 kPa at an altitude of 2200 m and room temperature T is 289.5 K,gas molecule density δ is 1.88803×1025m-3.
The above-mentioned correction coefficients are substituted into Gallimberti’s theoretical model with the translational energy temperature Thof the discharge channel and the radius a of the streamer stem as outputs,then the temperature and radius of the streamer channel can be calculated at any moment.
5.2.Model correction process
As shown in figure 7,the steps for model correction of the modified transition at high altitude are as follows:
Figure 7.Flow chart of the modified model.
(1) Input the initial parameters of the model.We assume that the initial translational energy temperature Th0is equal to room temperature T,and the initial streamer radius a0is 85 μm.Both the above and the initial streamer current I(t)are inputs.
(2) Assuming that the number of streamer stems is n,calculate the radius of a single streamer as per formula (8).
(3) Take the unit radial radius of the peak temperature 1500 K at the root of a streamer stem as 0-5 μm,and determine the initial high temperature-zone according to the peak temperature of 0.95Tp-Tp.
(4) Formulas (7),(9) and (10) are used to calculate the single streamer stem’s initial high-temperature zone current,the radial temperature distribution after expansion of the streamer stem,and the gas molecule density per unit volume,respectively.In this step,we modify Gallimberti’s streamerto-leader transition model based on convective diffusion and radial thermal expansion and calculate conversion time after correction.
(5) Based on the criterion that field intensity in the dark period suddenly changes to streamer-to-leader transition,we compare and analyze the modified duration and the measured duration.In the case of great deviation,we iterate the number of streamer stem roots and re-calculate the radius of the streamer stem and the conversion duration.
(6) If the absolute difference between the measured time and the simulated time of the streamer-to-leader transition is very small,output the radius of the streamer stem a(t),streamer stem temperature Th(t) and the simulation duration tb.
5.3.Simulation results
We selected a set of data with a charge of 5.78 μC corresponding to the input current for analysis.When the initial radius of the streamer stem is 85 μm,the room temperature is 289.5 K,and the actual air pressure is 75.5 kPa,the simulation results of the modified model are as follows.
Figure 8.The simulation radius of the high temperature-zone of the streamer stem and the simulation duration for streamer-to-leader transition.
According to the calculation of the modified model,the curves of the radius and temperature of the high temperaturezone of the streamer stem changing with time can be obtained as shown in figure 8.At the beginning,the radius of the streamer stem is 85 μm,and the corresponding channel’s temperature is equal to room temperature at 289.5 K.With an increase in time,the high temperature-zone expands radially,and the streamer stem temperature rises continuously.At 30 μs,the radius of the high temperature-zone of the streamer stem is 151.6 μm and the temperature is 920.8 K.When the streamer stem temperature rises to 1500 K,the transition from streamer to leader is complete.At this point,the simulation duration of the streamer-to-leader transition is calculated as 50.43 μs,and the maximum radius of the corresponding high temperature-zone of the streamer stem is 180.1 μm.
For data less than or equal to 4.5 μC,the critical temperature of the streamer-to-leader transition cannot be reached by model simulation,which further verifies the accuracy of the critical charge of the streamer-to-leader transition obtained from the experimental data.The calculation results of ten groups of models before and after correction are shown in table 2,where aprepresents the maximum radius of the streamer stem in the high temperature-zone,and the streamer-to-leader transition durations of the models before and after correction are represented by taand tb,respectively.
As shown in table 2,the duration tbof the streamer-toleader transition after correction is stable at about 49.89 μs,and the average error rate obtained by the modified model is 0.94%.The average error rate of the simulation duration taof streamer-to-leader transition under the classical model before correction is 6.97%,and the average error rate of each group is reduced by 6.03%.It can also be found from figure 9 that the simulation duration after correction is closer to the measured value,so simulation results of streamer-to-leader transition duration calculated from the modified model are more accurate.
From the above conclusions,it is apparent that the calculation results of the modified model on the streamer-toleader transition time are almost consistent with the streamerto-leader transition time obtained by the experiment.Therefore,we use the calculation process of the modified model to set the temperature nodes of 400 K,600 K and 800 K,respectively,to iteratively calculate the temperature change of the streamer stem at different time points.
Figure 9.The duration comparison of the transition from streamer to leader.
Figure 10.The temperature and radius of the streamer stem change with time during the dark period.
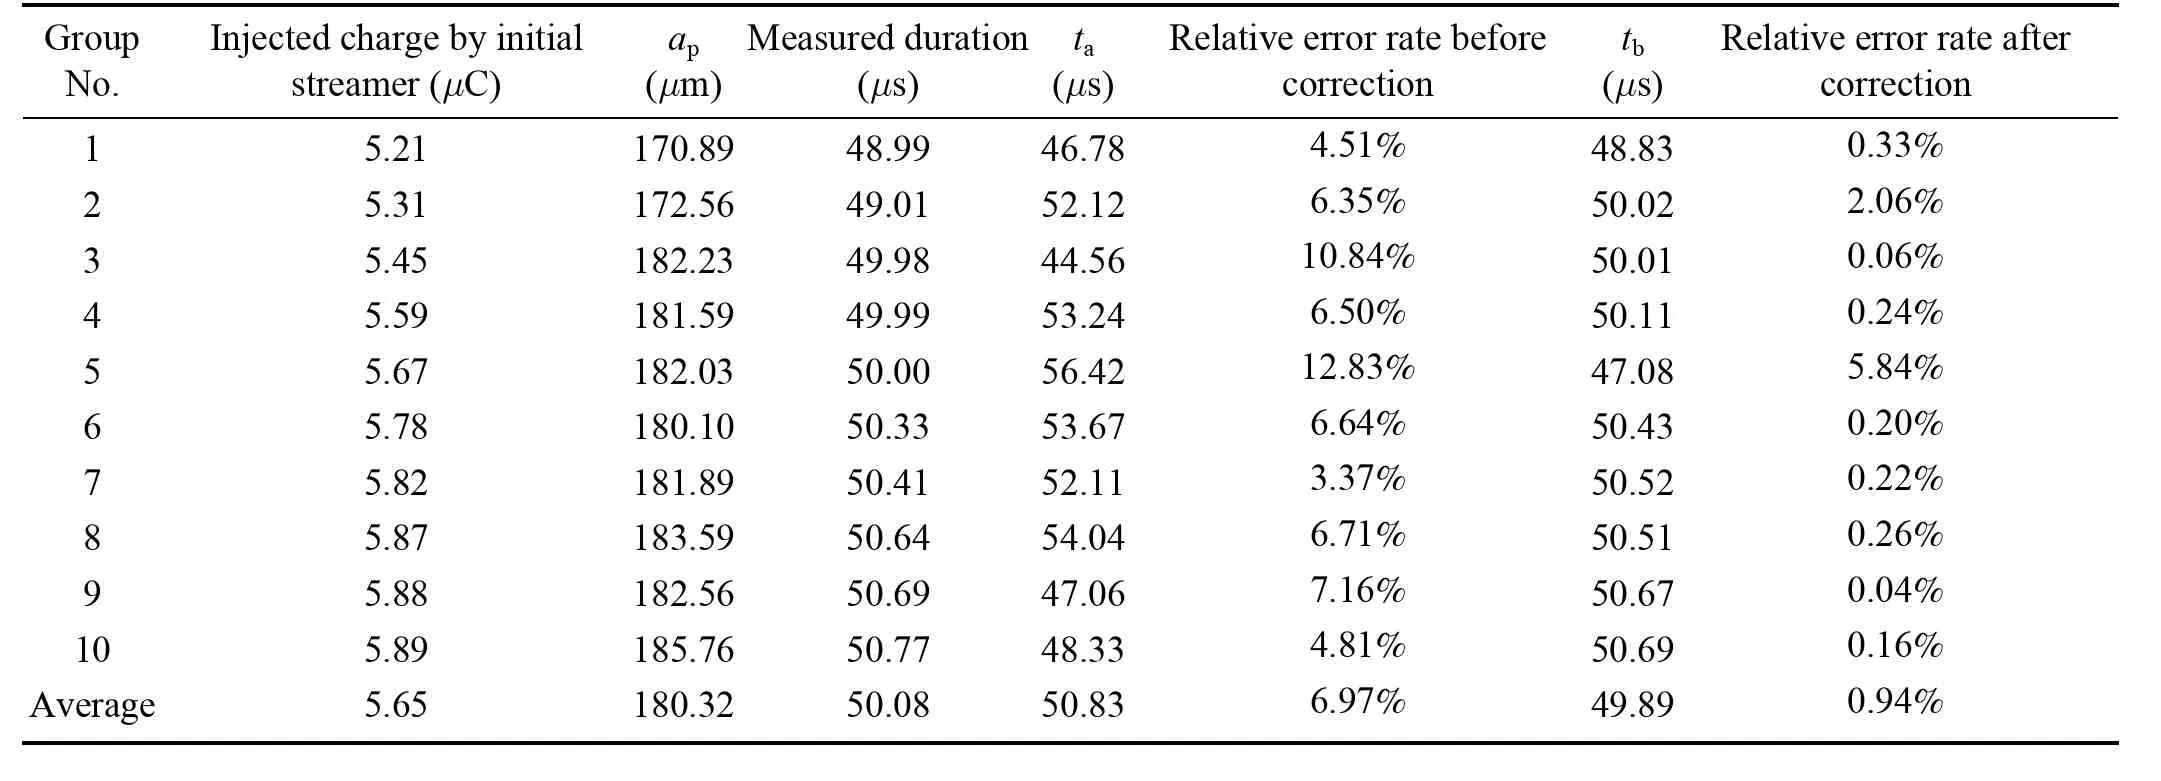
Table 2.Comparison of results before and after model correction.
The modified model of the transition from streamer to leader can be used to calculate the law of streamer stem temperature change synchronously,according to figure 10.With the passing of time,the radius and temperature of the streamer stem gradually increase,manifested by radial thermal expansion.The modified model calculates that when the time increases to 15.03 μs,the radius of the streamer stem increases to 275 μm,the temperature increases to 400 K.At this time,the radius of its central high temperature zone is 123 μm and the temperature is 600 K.When time increases to 25.01 μs,the radius of the outermost streamer stem expands to 535 μm.Based on the statistics of ten sets of simulation data,when the temperature of the high-temperature zone reaches 1500 K,the average maximum radius of the streamer stem in high temperature-zone is 180.32 μm and the maximum radius of the streamer channel is about 631 μm in the process of streamer-to-leader transition.
6.Conclusion
In this paper,the model of streamer-to-leader transition at high altitude was modified,considering the convective diffusion and thermal expansion coefficient.A photoelectric joint test of the large-size electrode with a 0.6 m diameter was carried out to study the radial distribution of the streamer channel’s temperature during the dark period at an altitude of 2200 m.Compared to Gallimberti’s transition model without considering thermal expansion,the modified model can improve the prediction accuracy of the duration of streamerto-leader transition,and simulation verifies the effectiveness of the modified model for sphere-plane gap discharge at high altitude.The conclusions are as follows:
(1) At an altitude of 2200 m,the critical charge of streamer-to-leader transition is in the range of 4.5-5.2 μC during the discharge process of a 0.6 m diameter sphereplane gap,which refers to the injected charge by the initial streamer.The initial streamer discharge current is integrated to obtain the initial streamer injection charge.When the initial streamer injection charge is less than 4.54 μC,the output temperature of the modified model cannot reach 1500 K,that is,no streamer-leader conversion is performed.When the initial streamer injection charge is greater than 5.2 μC,the streamer stem temperature of the modified model reaches 1500 K,the streamer leader conversion is completed,resulting in gap discharge.
(2) The modified model significantly improves the calculation accuracy of the streamer-to-leader duration at high altitudes.Compared with measured duration of sphere-plane electrode discharge at an altitude of 2200 m,the average error rate of the modified model was 0.94%,while the classical model was 6.97%,demonstrating the effectiveness of the modified model.
(3) Based on the modified model of streamer-to-leader transition,taking into account the convective diffusion of streamer discharges and the radial thermal expansion of the streamer stem,the initial radius of the high-temperature zone of the streamer stem is 85 μm,and the maximum radius of the high-temperature zone of the streamer stem and the maximum radius of the streamer channel during streamer-toleader transition are 180.32 μm and 631 μm,respectively.
Acknowledgments
The project is supported by National Natural Science Foundation of China (Scientific Funds for Young Scientists) (No.52007064).
猜你喜欢
杂志排行

Plasma Science and Technology的其它文章
- Ion-acoustic waves with non-planar wavefronts
- Gyro-Landau-fluid simulations of impurity effects on ion temperature gradient driven turbulence transport
- Investigation on the roles of equilibrium toroidal rotation during edge-localized mode mitigated by resonant magnetic perturbations
- Gyrokinetic simulation of magnetic-islandinduced electric potential vortex mode
- Different bactericidal abilities of plasmaactivated saline with various reactive species prepared by surface plasmaactivated air and plasma jet combinations
- A spatiotemporal evolution model of a short-circuit arc to a secondary arc based on the improved charge simulation method