Experimental study on the cavity evolution and liquid spurt of hydrodynamic ram
2022-11-28AnranChenXiangdongLiLanweiZhouYangziyiJi
Anran Chen,Xiangdong Li,Lanwei Zhou,Yangziyi Ji
School of Mechanical Engineering,Nanjing University of Science and Technology,Nanjing,210094,China
Keywords:Hydrodynamic ram Cavity oscillation Collapse pressure Liquid spurt
ABSTRACT In research of the characteristics of the cavity evolution,the pressure,and the liquid spurt in hydrodynamic ram,the experiment of the high-velocity fragment impacting the water-filled container had been conducted.The relationships between the above three characteristics have been researched.The evolution of the cavity can be divided into three processes according to its shape characteristics.The first liquid spurt occurred in Process II and the rest of it occurred in Process III.The duration of the second liquid spurt is longer than the first liquid spurt.When the impact velocity of the fragment is less than 996 m/s,the velocity of the second liquid spurt is the highest.When the velocity of the fragment is greater than 996 m/s,the velocity of the first liquid spurt is the highest.The maximum velocities of the first and second liquid spurt are 111 m/s and 94 m/s respectively.The pressure fluctuated sharply in Processes I and III.The maximum peak pressures in the shock and the cavity oscillation phases are 15.51 MPa and 7.96 MPa respectively.The time interval of the two adjacent pressure pulses increases with the increase of the fragment velocity.
1.Introduction
When a high-velocity fragment impacts a liquid-filled container,the hydrodynamic ram(HRAM)event occurs[1-5].This event could cause a shock wave and generate a cavity within the liquid,the complex pressure field and cavity dynamics may result in catastrophic failure of the container structure[6-12].As shown in Fig.1,the HRAM consists of the following phases:the penetration phase,the shock phase,the drag-cavity phase,the exit phase,the cavity contraction phase,and the cavity oscillation phase.The evolution of the cavity could generate complex pressure wave in the liquid,and this event will cause the liquid spurt.
1.1.The status of research on hydrodynamic ram
During phases(a)and(d),the fragment penetrates the panels of the liquid-filled container,punching penetration orifices and causing the deformation of the panels,and may cause the cracking and petalling of the back panel.
In the shock phase,the fragment protrusion into the liquid and drives a shock wave,McMillen et al.[13]found that the pressure in a shock wave increased linearly with the area of the spherical projectile.Disimile et al.[14]investigated the angular distribution of the initial wave and the variation with distance.They indicated that the initial shock wave decays with distance in a third-order polynomial trend.
Since the duration of the cavity evolution is the longest and the influence of this event is the greatest,cavity evolution is one of the major research objects.
In the drag-cavity phase,the fragment is decelerated by the drag force as it passes through the liquid,and a cavity filled with air and liquid-vapor is formed behind it.Lee et al.[15]studied the vertical water-entry of the spherical fragment and established a theoretical model of cavity growth.Guo et al.[16]investigated horizontal water entry behaviors of projectiles with different nose shapes.They established a theoretical model of cavity growth based on the solution to the Rayleigh-Plesset equation[17].Fourest et al.[18,19]modified the Rayleigh-Plesset equation due to the finite size of the liquid domain to predict the cavity radius change during the dragcavity phase.Chen et al.[20]conducted the experiments of highvelocity fragment impacts the liquid-filled container with different sizes and established the cavity growth model in which the dimension of the container was taken into consideration.
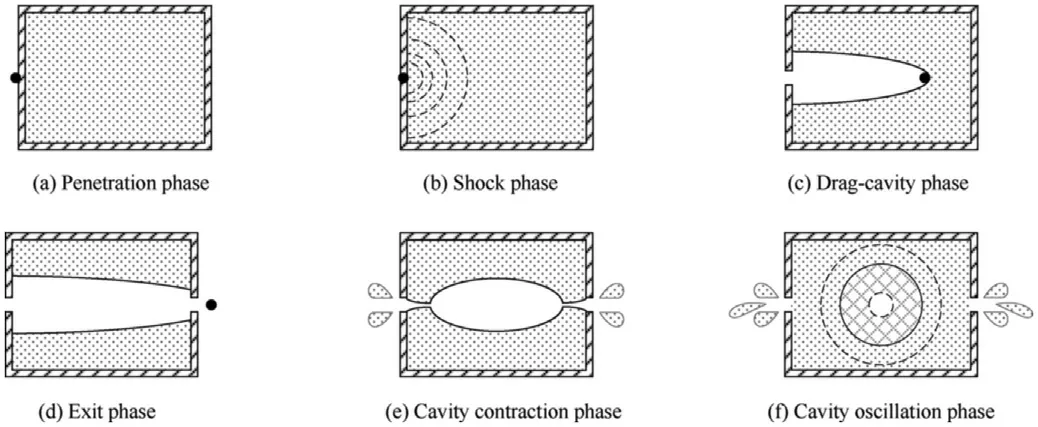
Fig.1.The phases of the hydrodynamic ram event.
In the cavity contraction and oscillation phases,the most obvious features are the cavity oscillation in the liquid and the liquid spurt outside the container.Shi et al.[21,22]found that the cavity collapse could produce a second shock wave in the liquid,and the time for the cavity closure and collapse was in an order of 1 ms-2 ms while the time for the rebound and collapse of the cavity was about 7 ms.They found that the surrounding liquid of the cavity collides with each other when the cavity separated from the surface of the liquid,this behavior could generate shock waves in the liquid,which are named collapse pressure[23].In the study of Mansoor et al.[24],the formation of the flat jet in the cavity was observed during the cavity contract,and the structure of this jet was influenced by the asymmetry in cavity dynamics caused by the proximity of the cavity to the square-sided tank walls.Abelson[25]found that a sharp increase in pressure followed by a rapid decay in the form of damped pressure oscillations was noted near deep closure,indicating that cavity collapse is accompanied by highpressure pulses.
1.2.The status of research on liquid spurt
The fuel tanks are one of the essential and flammable components of the military aircraft and vehicles.When fragments impact the fuel tanks,the hydrodynamic ram may occur,the resulting spurted atomized fuel can be easily ignited when it meets the ignition source,thereby affecting the survivability of the surrounding equipment.Therefore,the problem of liquid spurt has been widely concerned in the survivability community.Organizations and institutions dedicated to related study are Wright-Patterson Air Force Base[26,27],Southwest Research Institute[28],and United States Army Research Laboratory[28].
Disimile et al.[29,30]presented four unique phases of the liquid spurt,and the morphology and initiation mechanism of the liquid spurt in each phase were preliminarily explored.They found that the fragment residual kinetic energy levels influenced the shape,the magnitude of the velocity profile,and the spread of the spurts.They suggested that the average exit velocity of the liquid may depend on the average velocity difference of the initial and residual velocity of the fragment.Yang et al.[31]replicated the experiment of Disimile et al.[14]with a multiphase CFD code,CFD-ACE+,and discovered the multiple shock waves from CFD-simulation during the cavitation collapse process inside the fuel tank.The size and shape of the simulation results of the liquid spurt were very similar to the experimental results.To determine the driving mechanism behind the cavity collapse and the relationship between the cavity and the resulting transient spray in the HRAM,Lingenfelter et al.[32-34]conducted the experiments using two synchronized highspeed cameras to capture the interior cavity features and the corresponding exterior transient spray phases.Moreover,the relationship between the liquid spurt velocity and the pressure in the liquid is analyzed,and the theory of the pressure distribution that exists during the cavity oscillation was preliminarily proposed by Chen et al.[11].
Although the study on liquid spurt originates from the survivability of fuel tanks,the liquid medium used in most existing studies was water.Some scholars examine the differences and similarities of experimental results when using water and fuel.The experimental results of Burke et al.[35]indicated that the same phases exist in the spurt of fuel and water.When the medium is water,each phase appears later than the fuel.The use of water also allowed for better test measurements.Similarly,experiments conducted by Donald J.Crosch in the report[28]showed that the spurted droplets generated by water and diesel were essentially the same,as shown in Fig.2.Goss et al.[27]mentioned that water could mitigate fire ignitions that would obscure observation of the liquid spurt.
1.3.Research purpose
At present,the research on the HRAM and liquid spurt have been gradually developed.The study of the HRAM mainly focuses on features such as the liquid pressure,the cavity growth,and the structural response of the container.Most of the research on the liquid spurt focuses on its morphology and space-time distribution,which will eventually be applied to its influence on the ignition mechanism.However,it is infrequent to study the characteristics and the relationship between the mutual influence and action of the cavity evolution,the pressure,and the liquid spurt.
Combined with the previous research results and the existing experimental methods,the experiment of high-velocity fragment impacts the liquid-filled container has been conducted,and water was used in the experiment instead of fuel in this paper.The cavity evolution process has been observed and the characteristics of the external liquid spurt and the internal pressure change have been investigated.Additionally,the relationship between the cavity evolution,the liquid spurt,and the pressure change has also been primarily studied.
2.The liquid-filled container and the experimental setup
2.1.The liquid-filled container
The liquid-filled container used in the experiment was a cuboid steel box,as shown in Fig.3.The liquid-filled container was made up of the steel frame,the target panels,the fixed frames of the target panel,the rubber sealing frames,the Polycarbonate(PC)panels,the step fixed frame of the PC panels,etc.,which were assembled by bolts and nuts.The frame of the container was constructed of steel and had a thickness of 10 mm.The frame size is 710 mm×420 mm×460 mm(length×width×height),and the cubage is 96 L.The target panel used in the experiment is a 4 mm thick 2A12-T4 aluminum alloy plate with a density of 2.8 g/cm3and an ultimate strength of 420 MPa.The frame has one water injection hole and two transducer holes on its top wall.These two transducer holes are 85 mm and 235 mm away from the incident side of the frame,respectively.The PC panels are used as windows on each side of the container for optical observation.The step structure of the PC step frame could fix the PC panel and the PC panel was placed before and after the rubber gasket,which can play a buffering role and enhance the sealing effect of the container.
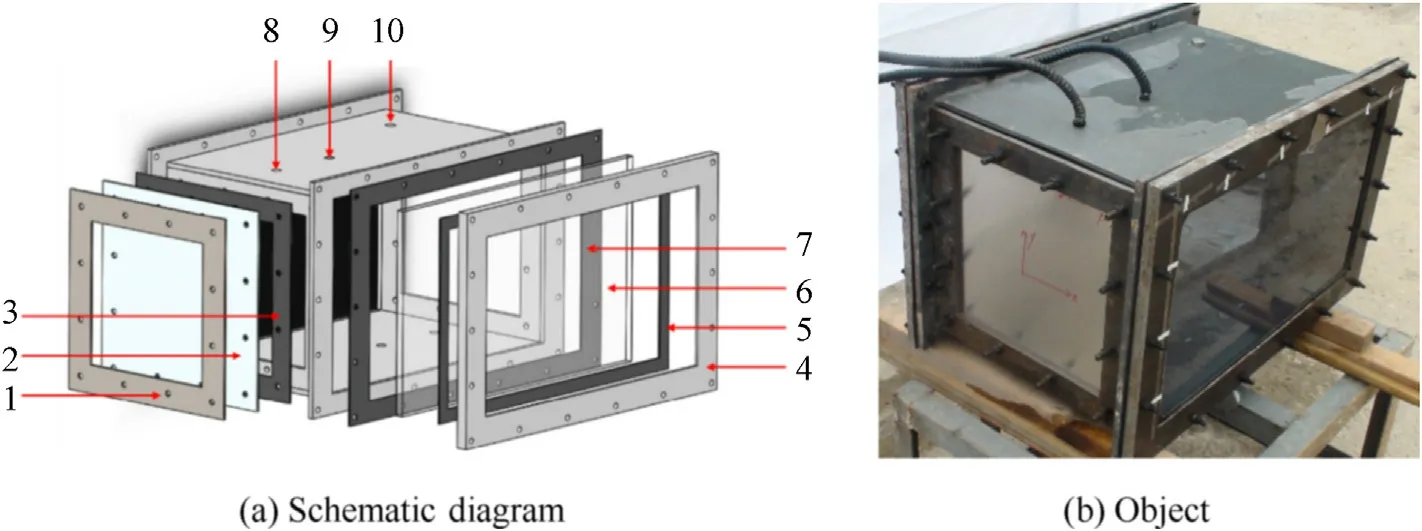
Fig.3.The frame and components of the liquid-filled container.
2.2.The experimental setup

Fig.2.The study of liquid type by Donald J.Crosch[28].
The experimental setup is mainly composed of φ14.5 mm ballistic gun,sabot stripper,velocity measuring screen,liquid-filled container,high-speed video camera,and data-acquisition device,the experimental setup is shown in Fig.4.The fragment used in this experiment is a tungsten alloy spherical fragment with a diameter of 9.5 mm and a mass of 8 g.The liquid used in the container is water.The impact velocity of the fragment could be controlled by adjusting the mass of the propellant.The sabot stripper is used to stop the sabot.The impact velocity of the fragment could be measured by a group of velocity measuring screens and a chronograph.The high-speed video camera could be used to record the evolution process of the cavity in the liquid.The impact and residual velocity of the fragment,and the liquid spurt outside the container could also be obtained using this device.The pressure in the liquid was measured with two Neptune T11 pressure transducers and the installation positions of the transducers are positions 8 and 9 shown in Fig.3(a).To avoid damage of the transducers by any possible impact of the fragment,the measuring positions are located such as to leave a distance from the centerline and the transducers are submerged in the liquid through a specially designed hollow screw to measure the pressure inside the container.
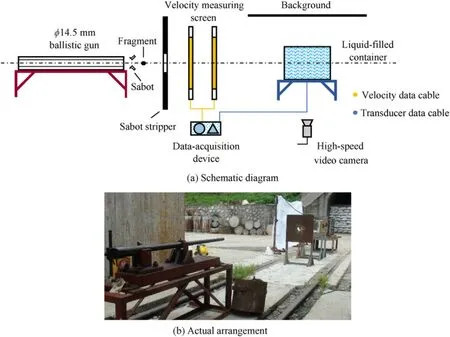
Fig.4.The experimental setup.
3.The experimental result and analysis
Six shots were conducted and the velocity of the fragment ranges from 600 m/s to 1300 m/s.After the fragment penetrated the front panel of the water-filled container,the fragment is decelerated by the drag force of the liquid,followed by a cavity that contained the air and the liquid-vapor.Since the duration of the penetration and shock phases are short,the characteristics and relationship between the cavity,the pressure,and the liquid spurt will be divided into the following three processes for analysis according to the cavity evolution.
3.1.The process of the cavity growth
The cavity growth process contains the whole drag-cavity phase and a period after the occurrence of the exit phase,as shown in Fig.5.In this process(Process I),the cavity surface is smooth and the shape of the cavity is regular.The increase of the cavity diameter is much slower than the increase of the cavity length.After the fragment exited the water-filled container,the cavity continued to expand in the radial direction but did not change the size in the axial direction due to the constraints of the container.This process is ended when the cavity begins to contract at two sides.
Since the diameter of the cavity at the panel is larger than the diameter of the penetration orifices during Process I,no liquid exists around the penetration orifices and no liquid spurt occurred outside the container.
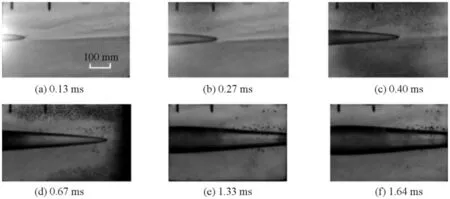
Fig.5.The cavity growth in Process I.(u0=1251 m/s).
The pressure-time history of the HRAM is shown in Fig.6,P1 and P2 are the positions of the two transducers,respectively.Fig.6(a)is the overall pressure-time of the HRAM.Combining with the cavity evolution phases and the characteristics of the pressure,the pressure-time history could be roughly divided into three parts which are 0-1.5 ms,1.5 ms-11.5 ms,and 11.5 ms-14.5 ms.The first part corresponds to the penetration phase,the shock phase,and the drag-cavity phase of the HRAM(Process I),as shown in Fig.6(b).The second part corresponds to the continuous growth of the cavity until the first collapse of the cavity after the fragment exits the water-filled container(Process II).During this process,the pressure in the liquid is relatively small and stable,with no obvious fluctuation and the duration of this part is the longest of the three.The third part corresponding to the cavity oscillation phase of the HRAM(Process III),as shown in Fig.6(c).In this part,the pressure appears multiple fluctuations in the liquid,and the duration is about 3 ms.
The pressure-time histories at different impact velocities are shown in Fig.7.The pressure measured at the two positions has a good consistency.The duration of the pressure pulse is insensitive to the impact velocity,which was about 0.073 ms in all cases,as shown in Fig.7(a).In this period,the pressure decays from its peak value to a slowly descending plateau and then to zero.The average pressure of the slowly descending plateau increases with the increase of the impact velocity of the fragment.As shown in Fig.7(b),the duration of the pressure fluctuations at P2 is about 0.05 ms.Since the distance between the P2 and impact point is greater than those of P1,the arrival time of the peak was later and the peak pressure was smaller.When the velocity of the fragment is higher than 866 m/s,two peaks could be observed in the pressure-time history.The second peak pressure may be caused by the reflected wave of the container wall,this phenomenon has not been studied in detail.According to the difference in the arrival time of the peak pressure and the distance of P1 and P2,the velocity of the initial shock wave could be calculated and is in the range of 1400 m/s~1500 m/s.
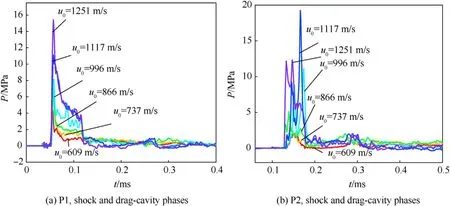
Fig.7.The pressure-time history in the shock and the drag-cavity phases.
In the penetration phase,the fragment impacts the front panel of the water-filled container,small pressure fluctuations will be generated in the liquid.The duration and the amplitudes of the pressure are shown in Table 1.The small fluctuation of pressure lasts about 0.013 ms-0.017 ms,with an amplitude of 0.25 MPa-0.69 MPa,and this amplitude increases with the increase of the impact velocity of the fragment.
During the shock phase,the peak pressures at different impact velocities are shown in Table 2.The peak pressure increases with the increase of the impact velocity and the measurement results at P2 are slightly smaller than those at P1.When the impact velocity of the fragment is 1117 m/s,the peak pressure at P2 was higher than that at P1.This may be because when the fragment moves directly under transducer 2,the shock pressure and the drag pressure are transferred to the detection surface at the same time.
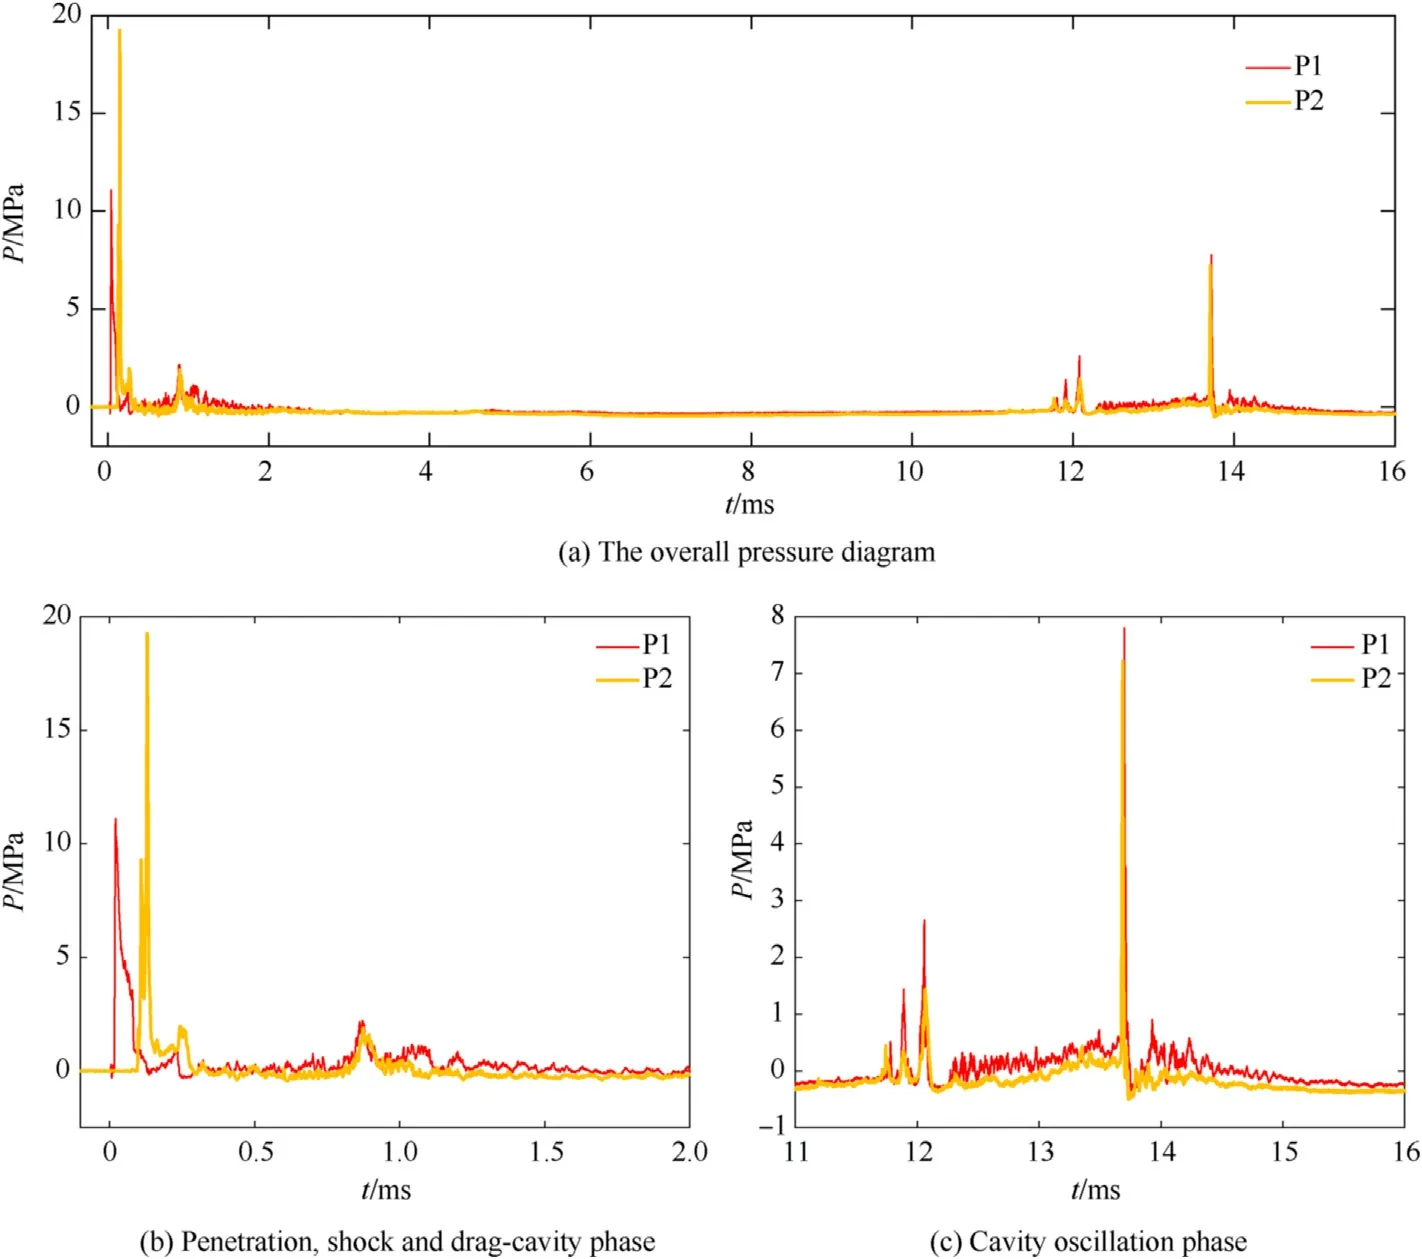
Fig.6.The pressure-time history.(u0=1117 m/s).

Table 1The duration and the amplitudes of the pressure in the penetration phase.

Table 2The peak pressure in the shock phase.
3.2.The process of the cavity contract to the first collapse
3.2.1.The experimental results in Process II
When the interior pressure at the throat of the cavity is lower than the atmosphere,the pressure difference between the inside and the outside of the cavity creates the contraction of the throat area.This contraction first appears on the two sides of the cavity.When the cavity contracts from two sides of the water-filled container,the airflow into the cavity is ended by the closure of the cavity and the enclosed cavity is contracting from the panels to the center of the container.As shown in Fig.8(a)and(b),the radial contract of the cavity begins early than its axial contract,especially near the orifices.The whole process of the cavity contracting from the throat position to the final collapse is defined as Process II.
At the beginning of Process II,the reentrant jet could be observed(Fig.8(c)).During the cavity contracts around the orifice,the surrounding water particles collide with each other so that shock waves are generated.When the cavity is closed,the bottom of the cavity produces strong vortex rings and the surrounding water is entrained inward to the cavity by the vortex rings[23].It forms a reentrant jet at the rear of the cavity where the water mixes with the incoming air from the orifice.As the reentrant jet continues to form,the cavity begins to separate from the container panels and creates an umbilical between the cavity and the orifice.The umbilical forms due to the significant low-pressure region in the cavity well below atmospheric pressure and is sufficient to draw ambient air through the orifice,albeit at a reduced rate.As the cavity continues to separate from the panels,the umbilical extends until it is severed,and the orifice mass flow begins its reversal and the liquid spurts out of the container[36].
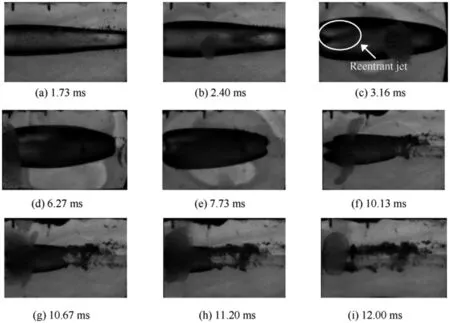
Fig.8.The cavity behavior in Process II.(u0=1251 m/s).
With the contract of the cavity,the reentrant jet has covered the whole volume of the cavity and the cavity is gradually opaque and irregular.When the cavity contracts to a sufficiently small size,the rapid increase of the contract velocity makes the surface of the cavity extremely unstable,and the cavity will be broken into small bubbles or clouds,which is defined as the first cavity collapse.
Table 3 shows the characteristics time of the cavity evolution inProcess II.The cavity begins to contract at 1.64 ms-1.91 ms after the fragment impacting the front panel of the container,and the cavity grows to its maximum volume about 2.00 ms-2.90 ms later.It takes about 7.00 ms-8.09 ms for the cavity to go from the maximum volume to the first collapse.

Table 3The characteristic time of the cavity in Process II.
Fig.9 shows a typical process of the liquid spurt(u0=1251 m/s)in Process II.The first time the liquid spurt occurred when the cavity contract at the penetration orifices.The liquid spurt has a high degree of atomization,as shown in Fig.8(c)~(e).There is only one liquid spurt discovered in Process II,which is defined as the pre-spurt phase.
The occurrence and duration of the liquid spurt are recorded in Table 4.The first liquid spurt occurred in the range of 2.13 ms-3.27 ms after the fragment impacted the front panel,and finished in the range of 8.00 ms-10.73 ms.The maximum and minimum duration of the first liquid spurt is 8.33 ms(u0=996 m/s)and 4.82 ms(u0=609 m/s)respectively.
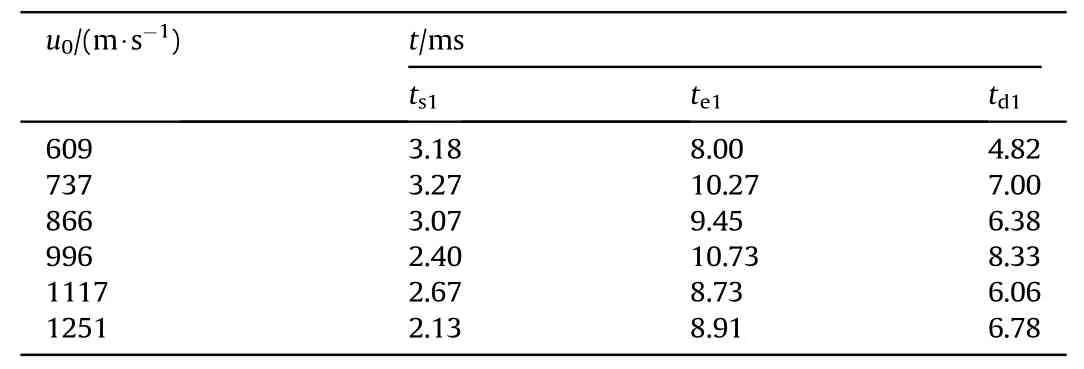
Table 4The characteristic time of the liquid spurt in Process II.
The delay time of the first liquid spurts with the contraction of the cavity is shown in Fig.10,the error bar is 0.25 times the measure result.The delay time varies with the fragment impact velocity roughly as a third-order polynomial function.The delay time of the first liquid spurt ranges from 0.49 ms to 1.63 ms.
3.2.2.The calculation results of the collapse pressure
In Process II,the pressure in the liquid is smooth with no significant change.At the end of this process,the cavity collapse could cause the pressure pulse in the liquid and the relevant parameters could be roughly calculated as follows.
Using the maximum and minimum radius of the cavity measured in the experiment,the position and the pressure of the collapse center of the cavity could be roughly estimated.Fig.11 shows the diagram of relevant parameters using in the calculation.Fig.11(b)shows the spatial coordinate system of each feature point.The penetration orifice at the front panel is set as the coordinate originO,the center of the collapsed cavity is set as pointA,and the positions of transducer 1 and transducer 2 are pointsBandCrespectively.
Assuming that the cavity collapse pressure decays in the way of spherical diffusion[37],the pressure at different distances from the collapse center is calculated as follows:

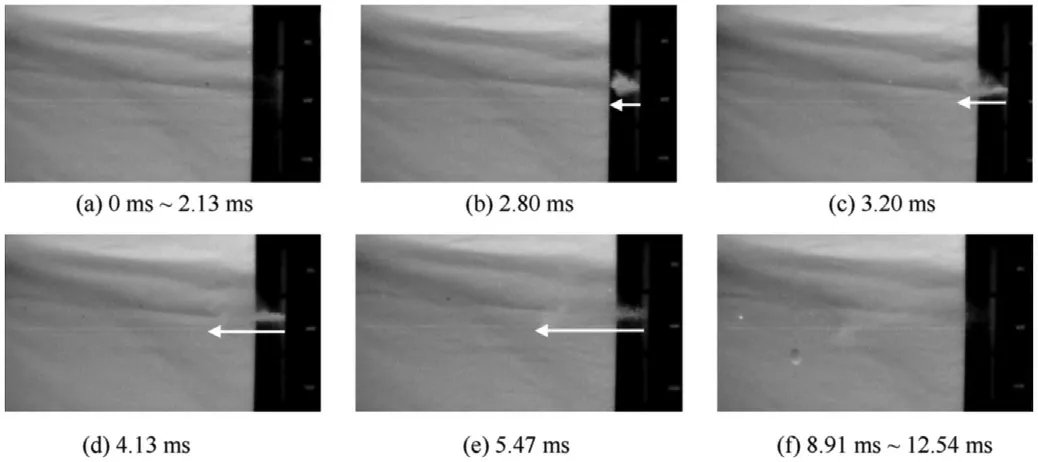
Fig.9.The liquid spurt in Process II.(u0=1251 m/s).
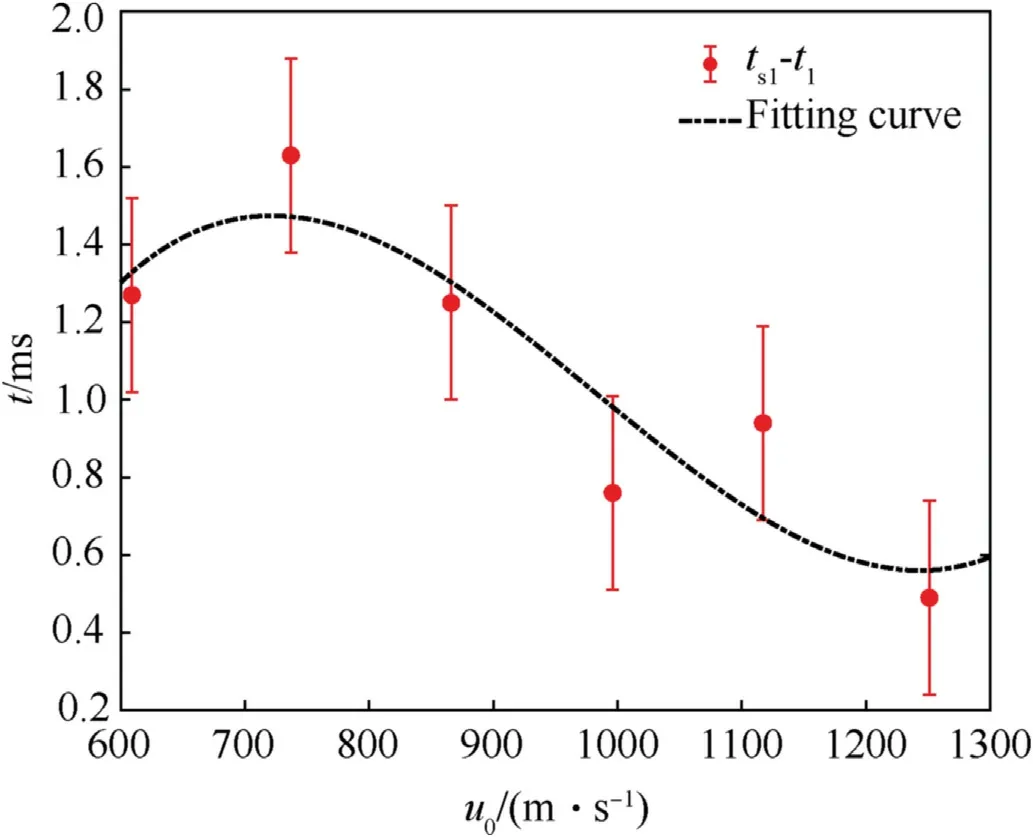
Fig.10.The delay time of the first liquid spurt.
wherePandrare the pressure and distance in the liquid,P0andR0are the collapse pressure and the initial cavity radius,TLis the propagation loss of the sound pressure signal extending fromR0tor.Since the position of the two transducers and the peak pressure at each position are known,the position of the collapse center could be calculated using the following equation,and the calculation results are shown in Table 5.

whered1=85 mm,d2=150 mm,h=65 mm,Lis the radial height of the container andL=400 mm,P1=PN2at position 1,P2=PN2at position 2 as shown in Table 8 and Table 9.
x2andx3could be calculated as follows:

The maximum and minimum radius of the cavity measured in the experiment are recorded in Table 6.Since the cavity collapse moment may not be exactly captured,there is an acceptable error in the measured results.According to the ideal gas state equation,the pressure when the cavity expands to the maximum radius and collapses can be estimated.

Table 5The calculation results of the positions of the collapse center.

Table 6The calculation results of the pressure in the process of the cavity collapse.

Table 7The characteristic time of the cavity in Process III.

Fig.11.The diagram of relevant parameters.

wherePcis the pressure at the cavity growth to its maximum radius,Vmaxis the maximum volume of the cavity,nis the amount of substance of the ideal gas,Ris the gas constant,andR=8.31441 J/(mol·K),Tis the environment temperature andT=298.15 K.
In this experiment,the maximum radius of the cavity when it collapses is in the range of 57.7 mm-96.1 mm,and this radius increases with the increase of the impact velocity of the fragment.The collapse pressure is not only affected by the maximum radius of the cavity but also by the amplitude of cavity volume before and after its collapse.The collapse pressure increases with the increase of the cavity radius and the amplitude of the volume change.The influence of the amplitude of the change in volume on the pressure is greater than that of cavity radius.The pressure at the collapse center is in the range of 23.323 MPa-215.33 MPa,and the pressure at the cavity growth to its maximum volume is in the range of 3.1367 MPa-7.6823 MPa.It shows thatP0is 7.44-28.91 timesPc.
3.3.The process of the cavity oscillation
As shown in Fig.12,after the first collapse of the cavity,there will be a cycle of re-expansion,contraction,and collapse,which is called cavity oscillation(Process III).In the hydrodynamic ram event,the cavity oscillates several times and stops when the energy finally dissipates,and the pressure wave generated in this process will increase the damage degree of the container.
After the cavity oscillates two times,a very interesting flow pattern inside the cavity could be observed.It looks like a turbulent cloud that inevitably is a multiphase and non-equilibrium flow.Moreover,in the subsequent oscillation of the cavity,the shape of the cavity is difficult to maintain the original cone,and it develops in the form of bubble cluster oscillation.
Table 7 shows the characteristics time of the cavity in Process III.The whole process takes about 17.03 ms from the fragment impacting the front panel of the water-filled container to the second time of the cavity collapse and the second collapse takes about 5.03 ms.It can be concluded that the occurrence of the first collapse of the cavity takes longer than the second collapse of the cavity,and the delay time of the second collapse of the cavity decreases with the increase of the impact velocity of the fragment.That is,in the same experiment,the cavity oscillation frequency decreases gradually.In different experiments,the cavity oscillation frequency increases with the impact velocity of the fragment.

Table 8The amplitude and occurrence time of the pressure pulses in Process III.(P1).

Table 9The amplitude and occurrence time of the pressure pulses in Process III.(P2).
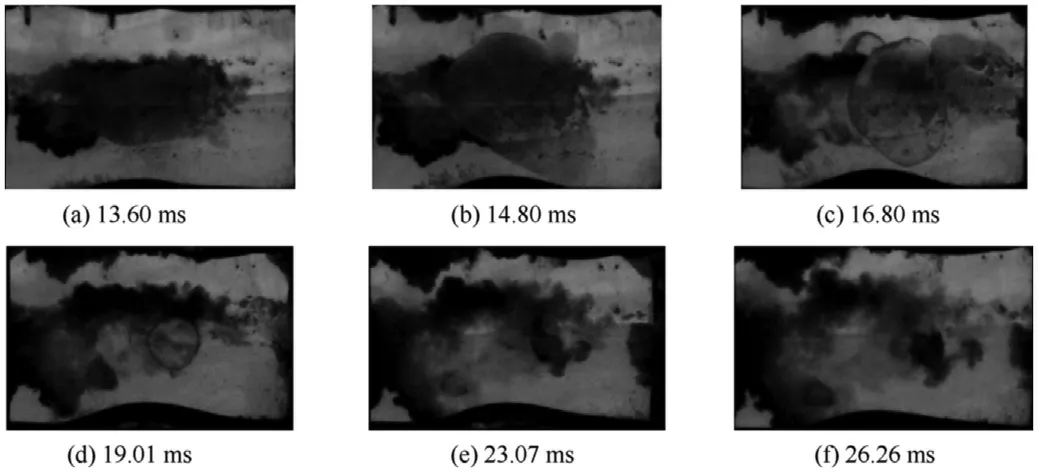
Fig.12.The cavity oscillation phase.(u0=1251 m/s).
3.3.1.The characteristics of pressure in Process III
The cavity oscillation is driven by the pressure difference between the internal pressure of the cavity and the liquid pressure.The collapse of the cavity could generate a pressure pulse in the cavity,as shown in Fig.13.The time features of the pressure pulses at different positions were consistent.The amplitude of the pressure pulses had no obvious relationship with the fragment impact velocity.The number of pulses increased with the increase of the fragment impact velocity.
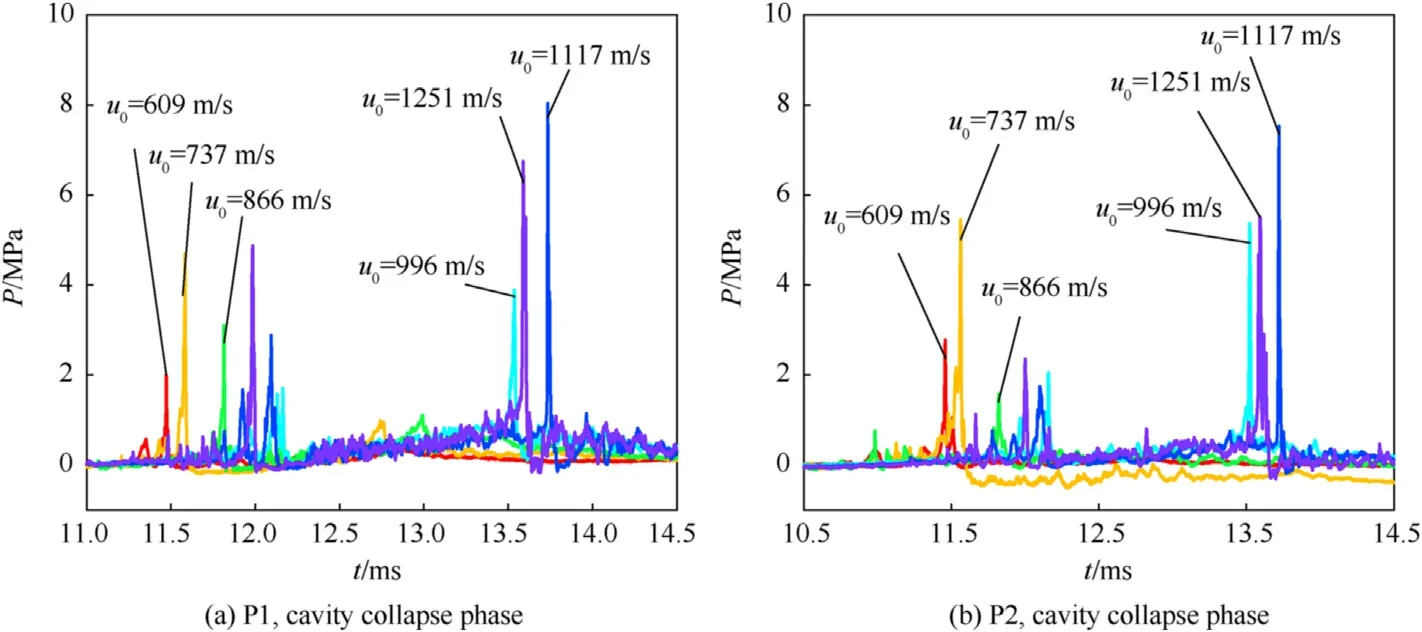
Fig.13.The pressure-time history in the cavity oscillation phase.
During the cavity oscillation phase,two or three of the collapse pressure pulses could be observed.Tables 8 and 9 record the amplitude and the occurrence time of the pressure in the liquid in Process III.PN1~PN3is the first to the third pulses of the collapse pressure.After several oscillations of the cavity,some pressure spikes may occur in some tests and these spikes are the results of reflections from the container walls and the front and back panels,recorded asPN4in Tables 8 and 9.The number of cavity collapse is less than the number of the pressure pulse.This indicates that the collapse of the cavity will inevitably cause the fluctuation of the pressure in the liquid,and each time of the cavity collapse may cause not only one time of the pressure pulse.
When the impact velocity of the fragments is higher than 996 m/s,the cavity collapse lasted for 0.4 ms-0.6 ms,and the duration of the second and third collapse of the cavity is 1.5 ms-1.75 ms.When the impact velocity of the fragment was less than 996 m/s,the time interval of the first and second collapse of the cavity was 0.1 ms-0.2 ms,and the time interval of the second and third collapse of the cavity was 1.25 ms-1.5 ms.In the experiments of 737 m/s,1117 m/s,and 1251 m/s,the first time of the collapse pressure has two peaks,and the duration of the adjacent two pulses of the first collapse pressure is about 0.06 ms-0.19 ms.In other words,with the increase of the times of the cavity collapse,the time interval of two adjacent pulses of the collapse pressure increases,and the time interval of cavity collapse increases with the increase of the fragment velocity.
The pressure pulsePN1occurs during the contraction of the cavity and is in the range of 0.57 MPa-1.60 MPa at P1,0.35 MPa-1.12 MPa at P2.The second pressure pulsePN2is caused by the first collapse of the cavity,and its occurrence time is about 0.47 ms later thanPN1.The peak value is relatively large,with an average peak value of 3.15 MPa.It can be seen from Table 8 that there is no obvious relationship between the value of the second pressure pulse and the impact velocity of the fragment because the center position of the cavity during its collapse has a great influence on the measurement results.The third pressure pulsePN3appeared at 1.24 ms-2.92 ms after the generation ofPN1.When the impact velocity of the fragment was lower than 996 m/s,the average amplitude ofPN3is less thanPN2.When the velocity is higher than 996 m/s,the average amplitude ofPN3is greater thanPN2.The maximum collapse pressure can reach 7.96 MPa(u0=1117 m/s),which is the second collapse pressure at position 1.In some tests,the fourth collapse pressure pulsePN4can be observed,which appears about 4.97 ms after the cavity collapse,and the pressure is very small,with an average amplitude of 0.33 MPa.The measurement results of the two positions have a good consistency.
3.3.2.The collapse pressure versus the impact velocity of the fragment
The standard atmospheric pressure and the peak pressure in the shock phase were taken as reference pressure respectively to analyze the characteristics of the pressure pulses(PN1~PN3)versus the impact velocity of the fragment in the cavity oscillation phase,as shown in Fig.14.The ratio of the collapse pressure to the standard atmospheric pressure is defined as the collapse-standard pressure coefficient(Cst-i,i=1,2 and 3),and the ratio of the collapse pressure to the peak pressure in the shock phase is defined as the collapse-shock pressure coefficient(Csh-i,i=1,2 and 3).
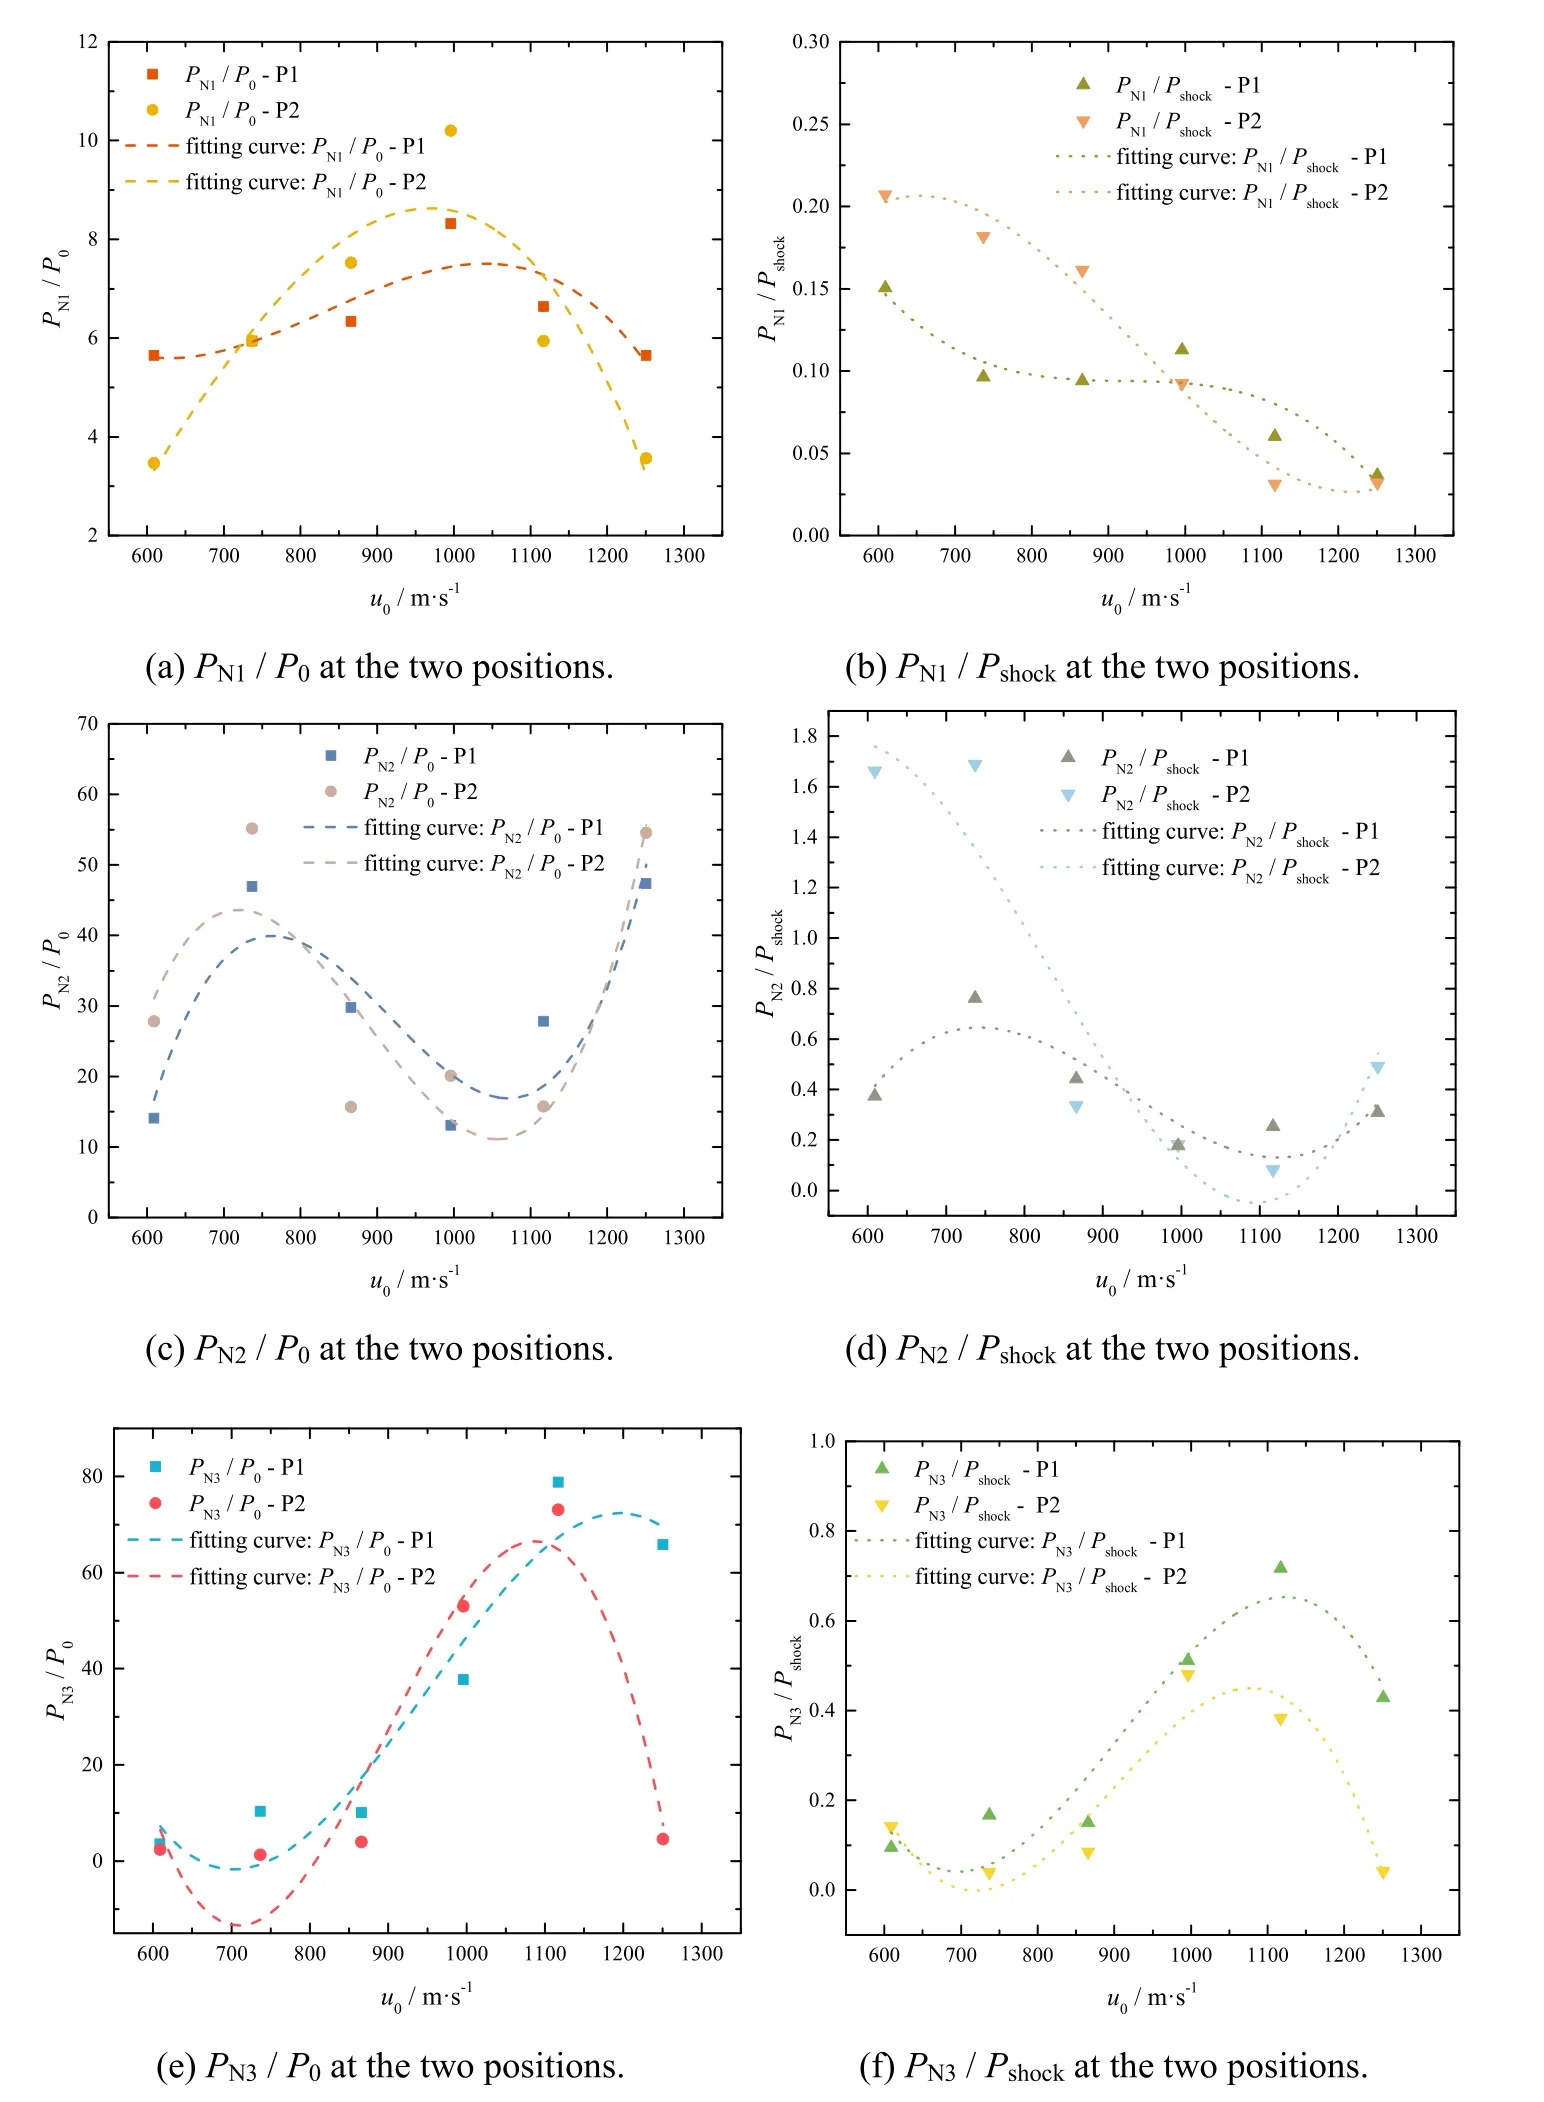
Fig.14.The Cst-i and Csh-i versus the impact velocity of the fragment.
The relationship ofCst-iandCsh-iversus the impact velocity of the fragment can be described by a third-order polynomial.When the impact velocity of the fragments is higher than 996 m/s,the third pressure pulse in the cavity oscillation phase is higher than the first and second pressure pulse.When the impact velocity of the fragment was less than 996 m/s,the second pressure pulse is larger than the first and third ones.The change rule of the pressure pulse versus the impact velocity is consistent at the two positions.For the first pulse of the collapse pressure,Cst-1andCsh-1have opposite changing trends versus the impact velocity.The value ofCst-1is the maximum when the fragment velocity is 996 m/s,andCsh-1gradually decreases with the increase of the fragment velocity.For the second pulse of the collapse pressure,Cst-2andCsh-2have the same changing trends versus the impact velocity.When the fragment velocity is in the range of 737 m/s~1117 m/s,the values ofCst-2andCsh-2decrease with the increase of the fragment velocity.For the third pulse of the collapse pressure,Cst-3andCsh-3have the same changing trends versus the impact velocity.When the fragment velocity is in the range of 737 m/s~1117 m/s,the values ofCst-3andCsh-3increase with the increase of the fragment velocity.
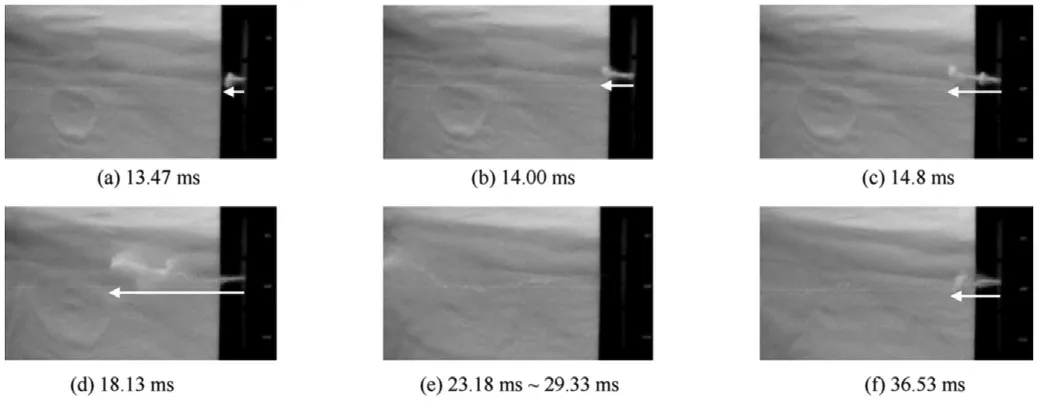
Fig.15.The liquid spurt in Process III.(u0=1251 m/s).
3.3.3.The characteristics of the liquid spurt in Process III
3.3.3.1.The shape of liquid spurt.The second liquid spurt occurred after the complete collapse of the cavity,as shown in Fig.15(a)to(d).After the liquid spurt out of the orifice,it gradually atomized during the movement and the shape of the liquid spurt has an umbrella-like head and a linear or columnar tail.In this phase,multiple liquid spurts of a similar shape occur in succession.Meanwhile,the cavity in the container oscillates several times and clouds of bubbles of various sizes can be observed in the container.After the multiple spurts of the liquid,the cavity oscillates less violently,and a stream of liquid is spurt about 11 ms later.The head of this liquid spurt is shaped like a ship anchor,and the tail gradually breaks apart during its movement.The cavity in the liquid corresponding to this process presents a flocculent shadow and no obvious bubbles exist.
3.3.3.2.The occurrence and the duration of the liquid spurt.
The characteristics time of the liquid spurt in Process III is shown in Table 10.The time difference between the second liquid spurt and the first liquid spurt was about 9.00 ms-10.41 ms.It can be observed that the first and second liquid spurt occurred earlier as the increase of the impact velocity of the fragment.The difference between the duration of the first and second liquid spurt decreases with the increase of the impact velocity of the fragment.
The delay time of the second liquid spurts with the collapse of the cavity is shown in Fig.16,the error bar is 0.10 times the measure results.The delay time varies with the fragment impact velocity roughly as a third-order polynomial function,and the delay time of the second liquid spurt ranges from 0.45 ms to 1.73 ms.Comparing Figs.10 and 16,it can be found that the delay time of the two times of the liquid spurt varies in the opposite trend versus the fragment impact velocity,and the changing range of the delay time of the second liquid spurt is slightly greater than the first liquid spurt.
Fig.17 shows the relationship between the number and the occurrence time of the liquid spurt with different impact velocities of the fragment.The number of the liquid spurt increase with the impact velocity of the fragment.The occurrence time of each liquid spurt is changing as a power function relationship with the number of liquid spurts.The error analysis is shown in Table 11,which includes R-square and adjusted R-square.
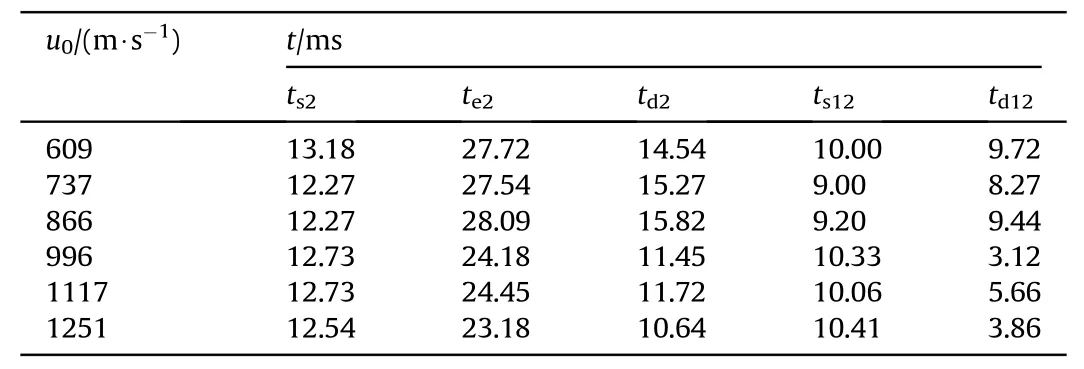
Table 10The characteristic time of the liquid spurt in Process III.

Table 11The error analysis of the fitting results of N-t.
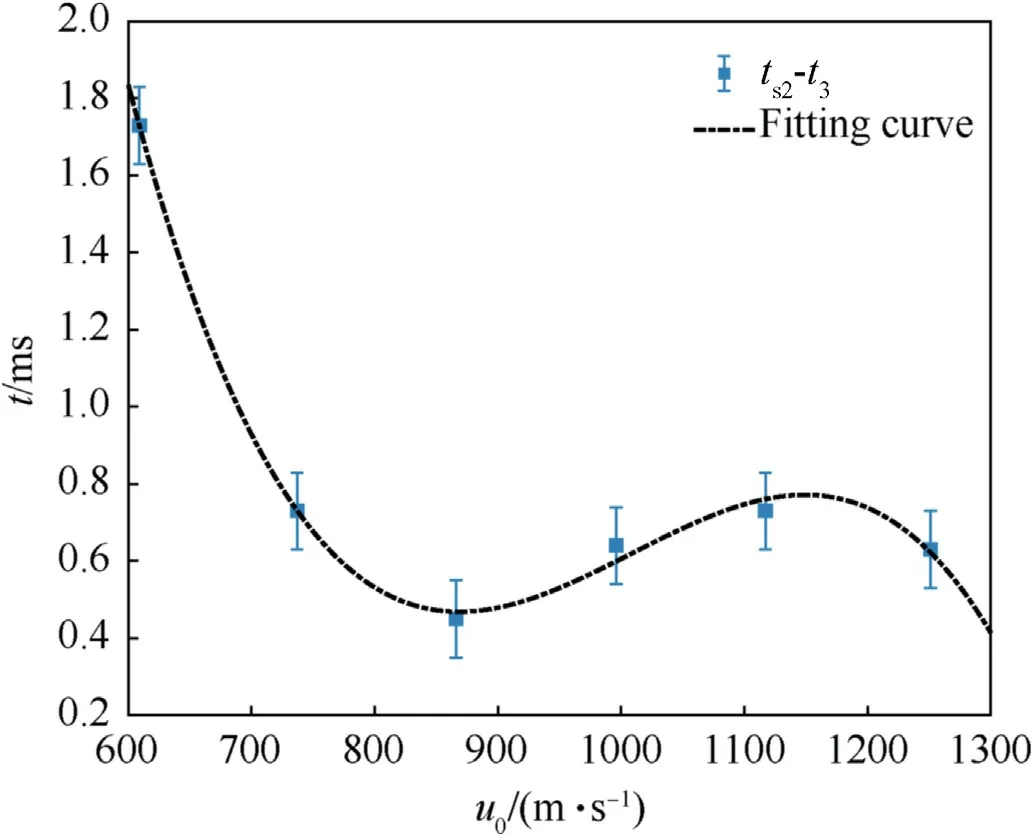
Fig.16.The delay time of the second liquid spurt.
The minimum R-square and Adj.R-square is 0.93758 and 0.92509 respectively,which shows that the fitting results have good prediction power for the relationship of the occurrence time of each liquid spurt versus the spurt number.
3.3.3.3.The movement of the liquid spurt.Fig.18 shows two typical experimental results of the initial velocity of each liquid spurt versus time.When the impact velocity of the fragment is less than 996 m/s,the velocity of the second liquid spurt is the highest.When the velocity of the fragment is greater than or equal to 996 m/s,the velocity of the first liquid spurt is the highest.This indicates that the initial fragment velocities that define the values of the velocities of the first two liquid spurt.
The liquid near the penetrating orifices has a larger mass and a higher velocity due to the high pressure in the liquid.When the first liquid spurt occurred,the pressure in the liquid was mainly the shock wave generated by the fragment impacting on the liquid surface and the shock wave generated by the fragment moving in the liquid under the drag force,which generated the initial pressure field in the liquid.The second liquid spurt occurred with the first liquid spurt atomized into the spray.
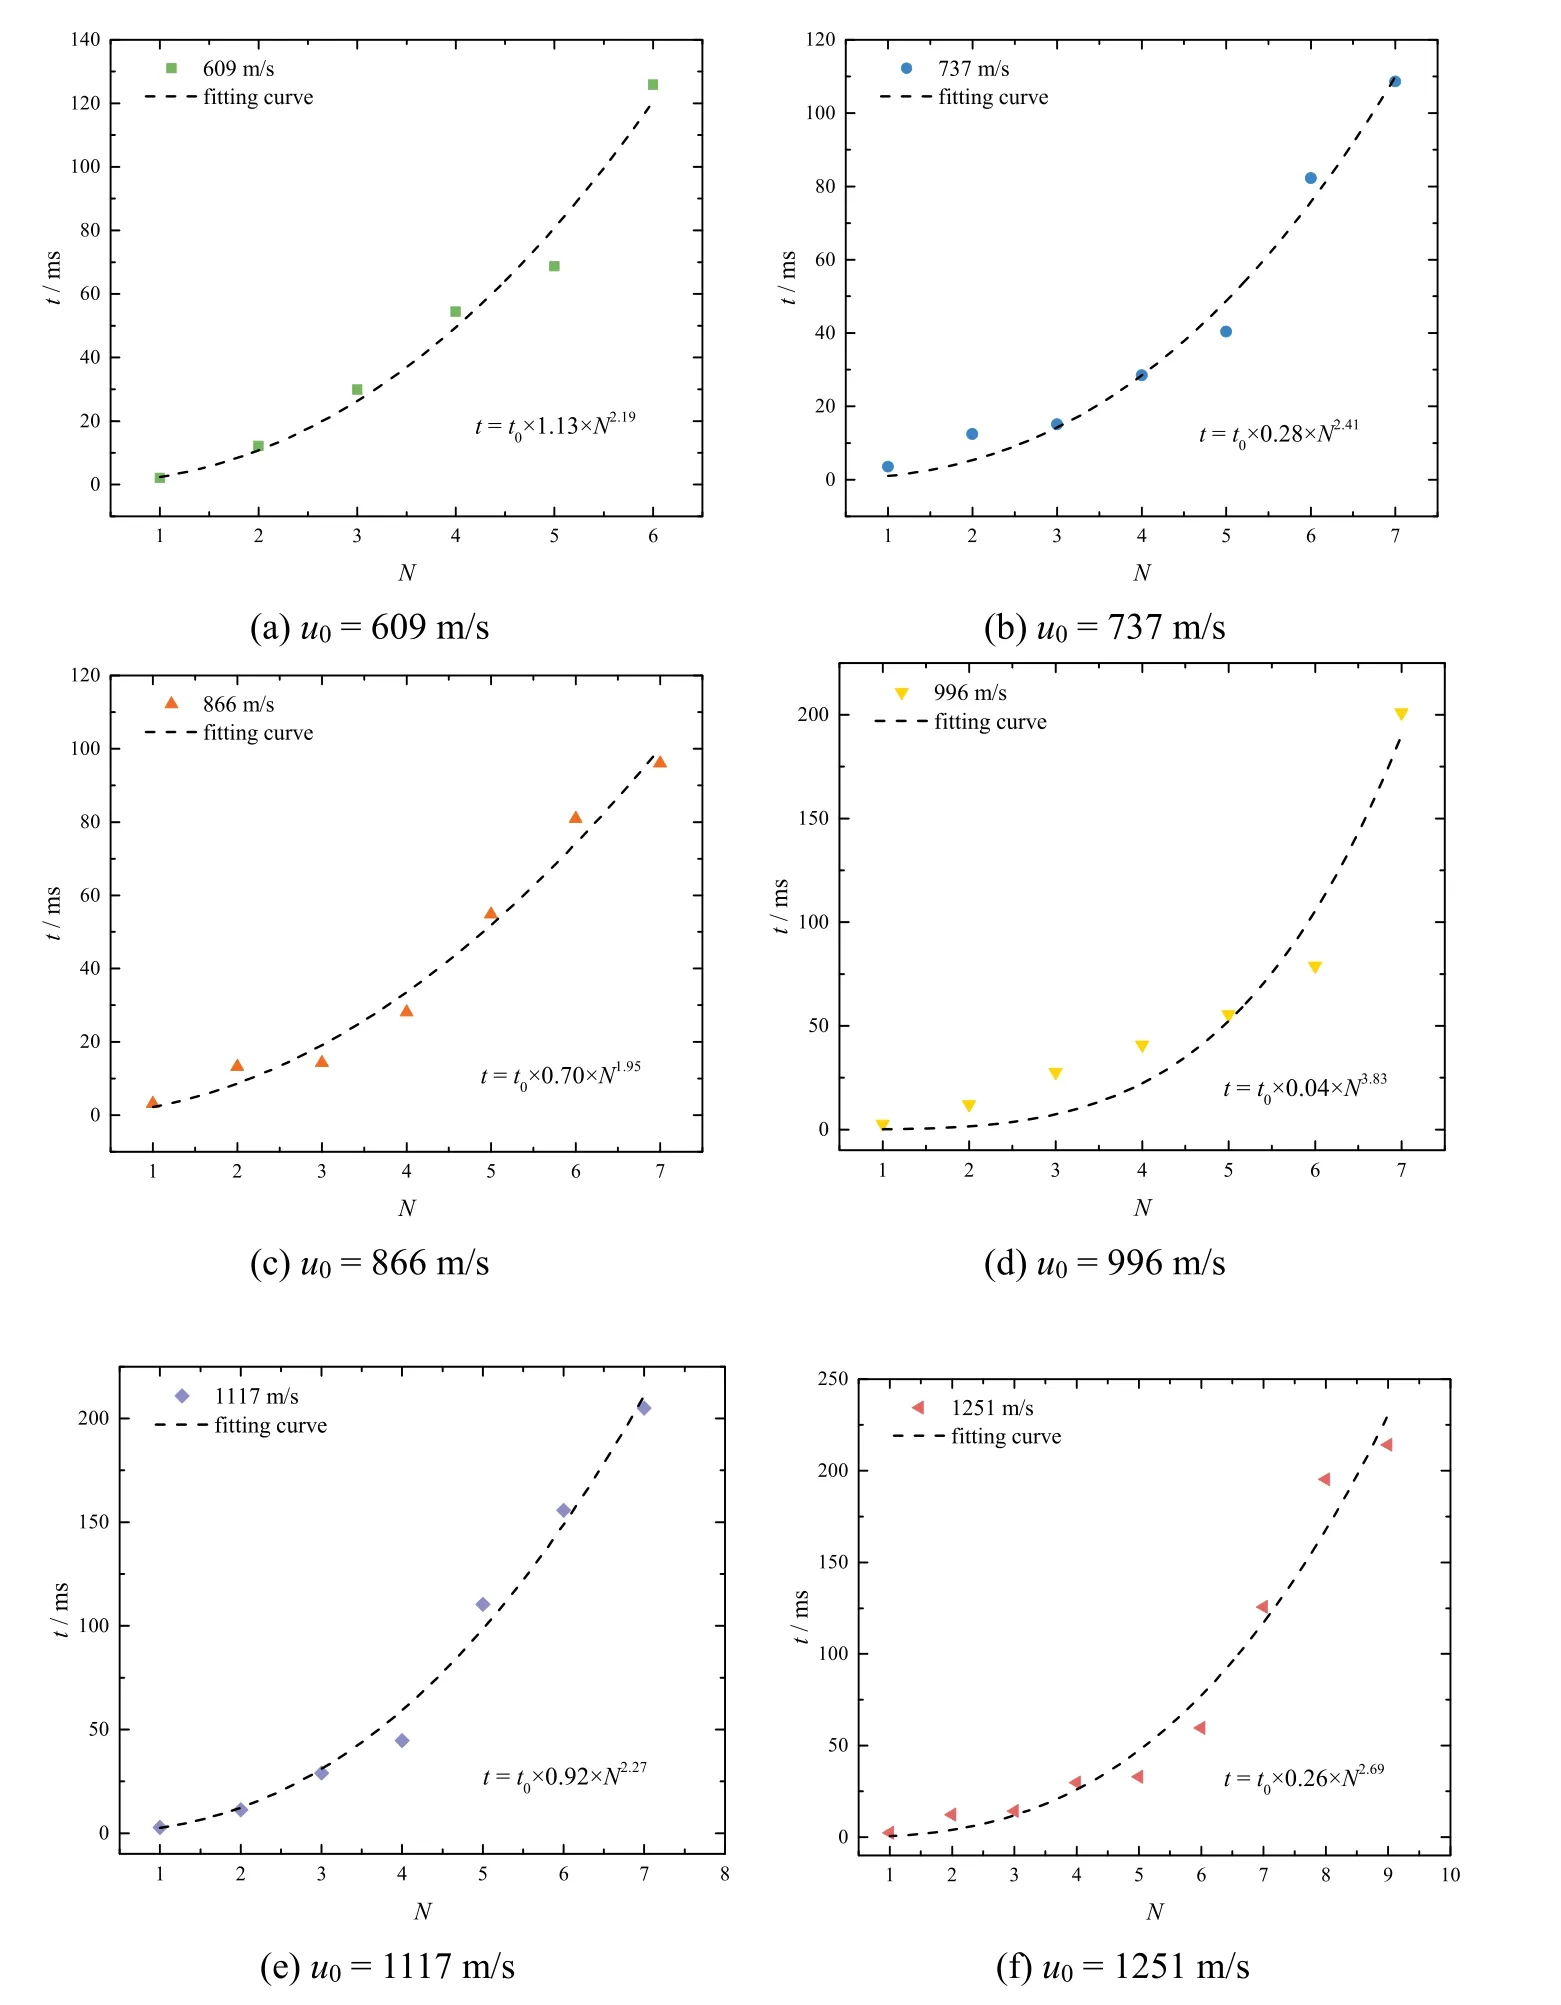
Fig.17.The occurrence time of each liquid spurt versus the spurt number.where t is the time of each liquid spurt and N is the number of the liquid spurt.The scaling factor is in the range of 0.04-1.13,and the power exponent is in the range of 1.95-3.83.
When the second liquid spurt occurred,the collapse pressure wave generated by the collapse of the cavity changes the initial pressure field in the liquid.When the impact velocity of the fragment is low,the initial pressure field in the liquid has been attenuated at the first spurt of the liquid,and the pressure field generated by the cavity contract is smaller than that generated by the cavity collapse.Therefore,the pressure field generated by the cavity collapse leads to a higher velocity of the liquid spurt(the second liquid spurt).When the impact velocity of the fragment is high,the initial pressure field in the liquid is also high,and the velocity of the first liquid spurt is larger than the second one.
Table 12 shows the experimental results of the velocity of the fragment and the liquid spurt.The initial velocity of the liquid spurt measured in the experiment ranges from 47 m/s to 111 m/s,and its magnitude has no obvious relationship with the impact velocity(u0),residual velocity(ur),and velocity difference(ud)of the fragment.This result is different from the conjecture in Refs.[29,30].
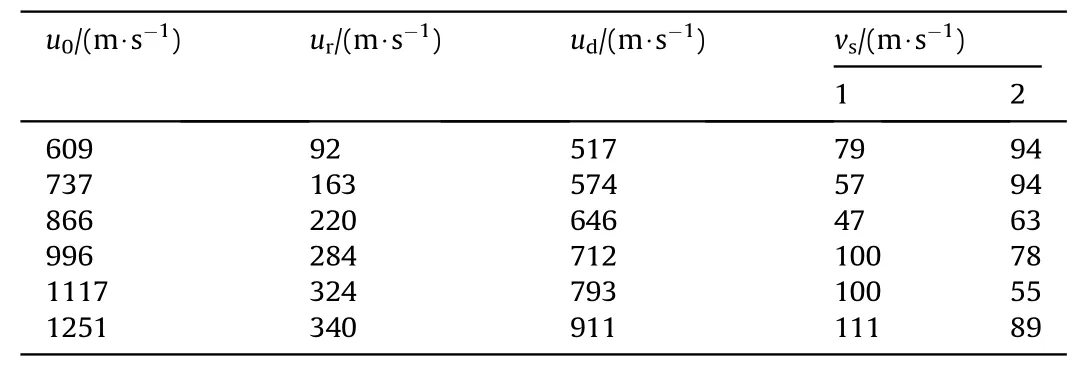
Table 12The experimental results of the velocity of fragment and liquid spurt.
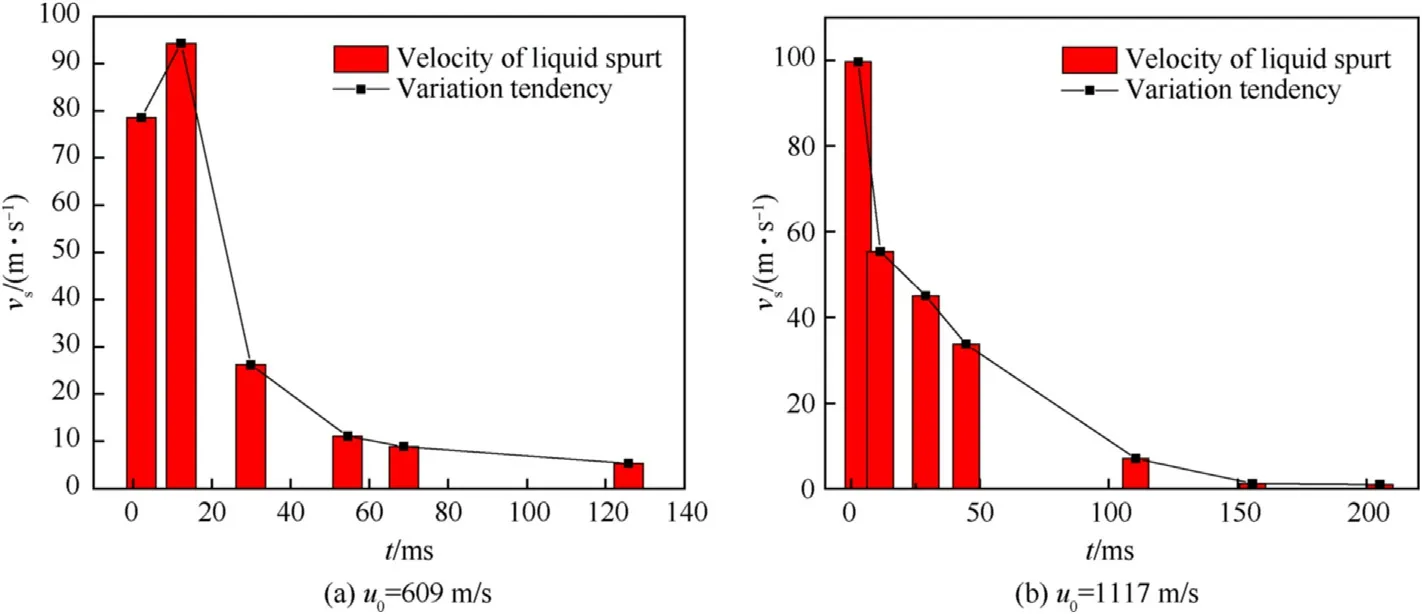
Fig.18.The characteristic of the initial velocity of the liquid spurt versus time.
The dimensionless velocity(U)of the liquid spurt is defined as the ratio of the actual velocity(vs)of the liquid spurt to the impact velocity(u0)of the fragment,and its relationship versus the relative spurt time(t/t0)is shown in Fig.19.
It can be observed that the dimensionless velocity decreases exponentially with the relative spurt time.As the number of the liquid spurt increases,the pressure in the liquid decreases gradually.Finally,the liquid flows out of the penetration orifices under the action of gravity at a velocity ranging from 1 m/s to 5 m/s.The error analysis is shown in Table 13.The scaling factor is in the range of 0.069-0.162,and the scaling factor of the independent variable(t/t0)is in the range of-0.113 to-0.054.

Table 13The error analysis of fitting results of t/t0-vs/u0.
Except for the experiment of the impact velocity of 866 m/s,the minimum R-square and Adj.R-square is 0.85071 and 0.81339 respectively.It can be considered that the fitting results for the relationship of the dimensionless velocity of the liquid spurt versus relative spurt time are reasonable.
Fig.20 shows the relationship between the displacement of the liquid spurt versus time and the impact velocity of the fragments after the first complete collapse of the cavity.Since the flowing mass of the second liquid spurt is large and this liquid spurt could last a long duration,it is chosen as the research object.Time zero is the time when the liquid spurt occurs.It can be seen that the displacement of liquid spurt changes linearly with time,the slope of the fitting curve increases with the increase of the impact velocity of the fragment,as shown in Fig.20(a).In the vicinity of the penetration orifice(about 100 mm),the displacement of the liquid spurt changes little with the impact velocity of the fragment when the movement time of the liquid spurt is short.This change becomes more and more obvious with the increase of time and the ratio of the displacement of the liquid spurt to the fragment diameter(df)increases with the increase of the impact velocity of the fragment,as shown in Fig.20(b).
4.Conclusions and outlooks
In this study,the experiment of the hydrodynamic ram has been conducted,and the whole process of the liquid spurt and the cavity evolution was recorded and the pressure in the liquid was measured.The conclusions are as follows:
(1)The cavity begins to contract in the range of 1.64 ms-1.91 ms later after the fragment impacting the front panel of the container.No liquid spurt occurred during this process.In the penetration phase,the small fluctuation of pressure lasts about 0.013 ms-0.017 ms,with an amplitude of 0.25 MPa-0.69 MPa.In the shock and drag-cavity phases,the duration of the pulse pressure is about 0.073 ms and the maximum pressure could reach 15.51 MPa(u0=1251 m/s,position 1).
(2)The cavity grows to its maximum volume of about 2.00 ms-2.90 ms after the contraction.It takes about 7.00 ms-8.09 ms for the cavity to go from the maximum volume to the first collapse.The first liquid spurt has a high degree of atomization and occurred at about 0.49 ms-1.63 ms after the cavity contraction.The duration of the first liquid spurt is in the range of 4.82 ms-8.33 ms.According to the calculation results,the pressure at the collapse center ranges in 23.323 MPa-215.33 MPa,and the pressure at the cavity growth to its maximum volume is in the range of 3.1367 MPa-7.6823 MPa.
(3)The whole process takes about 17.03 ms from the fragment impacting the front panel of the water-filled container to the second time of the cavity collapse and the second collapse takes about 5.03 ms.The second liquid spurt has an umbrella-like head and a linear or columnar tail and occurred at about 0.45 ms-1.73 ms after the first collapse of the cavity.The duration of the second liquid spurt is in the range of 10.64 ms-15.82 ms.The third liquid spurt has a ship-anchor-shaped head and the tail gradually breaks apart during its movement.The time interval of two adjacent pressure pulses increases with the increase of the number of times of cavity collapse,and the time interval of cavity collapse increases with the increase of the fragment velocity.The maximum collapse pressure is 7.96 MPa(u0=1117 m/s,position 1).
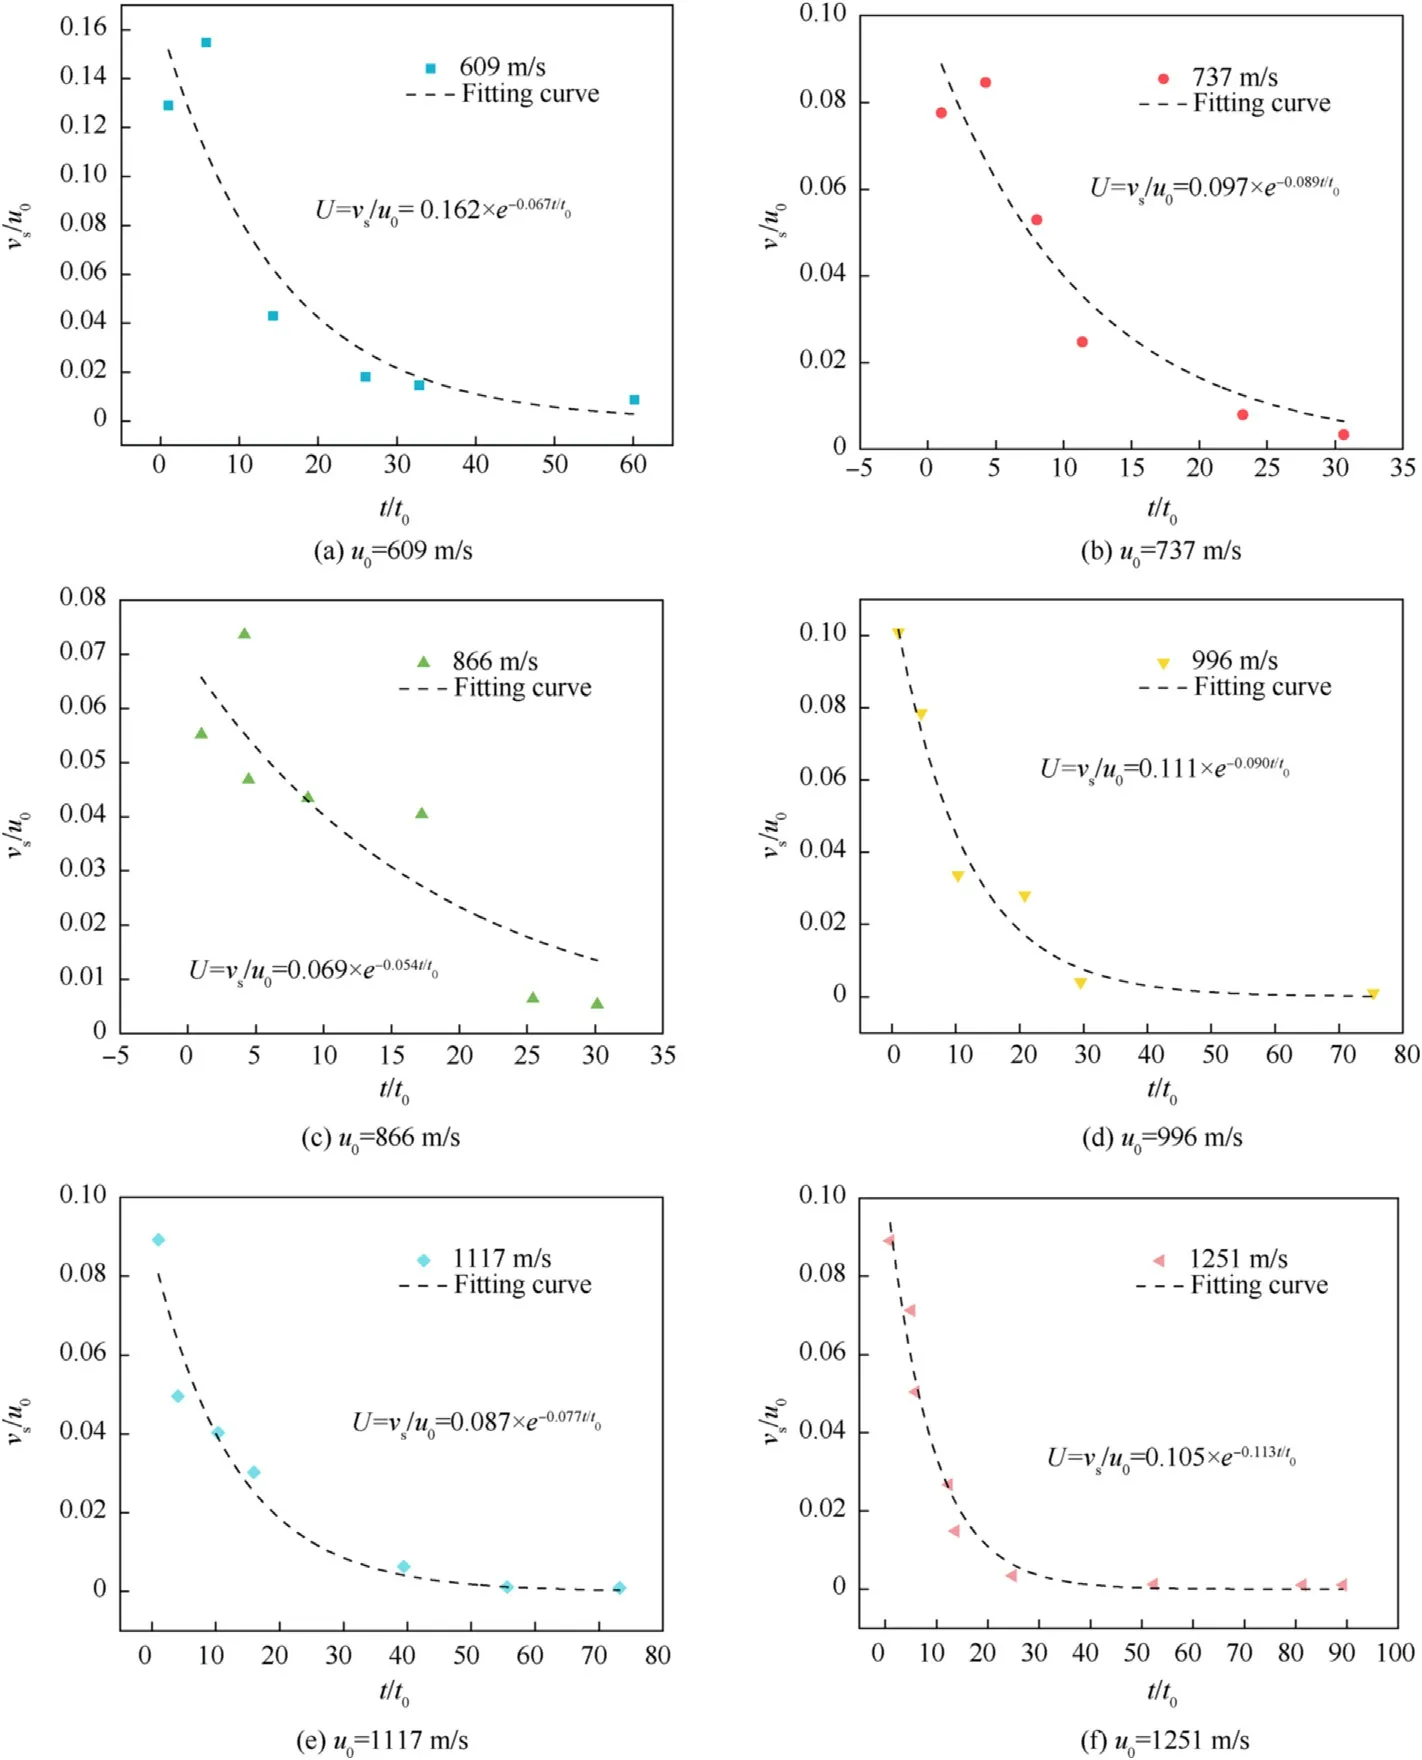
Fig.19.The dimensionless velocity of the liquid spurt versus the relative spurt time.
(4)When the impact velocity of the fragments is higher than 996 m/s,the third pressure pulse in the cavity oscillation phase is higher than the second pressure pulse.When the impact velocity of the fragment was less than 996 m/s,the second pressure pulse is larger than the third one.The changing trend of the collapse pressures versus the impact velocity is basically identical in the two positions of the transducers in the liquid.The collapse pressure pulse of different times has a diverse changing trend versus the impact velocity.
(5)When the impact velocity of the fragment is less than 996 m/s,the velocity of the second liquid spurt is the highest.When the velocity of the fragment is greater than or equal to 996 m/s,the velocity of the first liquid spurt is the highest.The dimensionless velocity decreases with time exponentially.
In our study,the final purpose is to establish an engineering model to predict the fire risk caused by fuel spurt.As the first step,the main purpose of this study is to analyze the mechanism of liquid spurt.Therefore,the water was used as a surrogate for fuel,based on the existing studies on HRAM and liquid spurt.It is intended that the finding of this manuscript can lay a foundation for the future study of the fuel ignition.
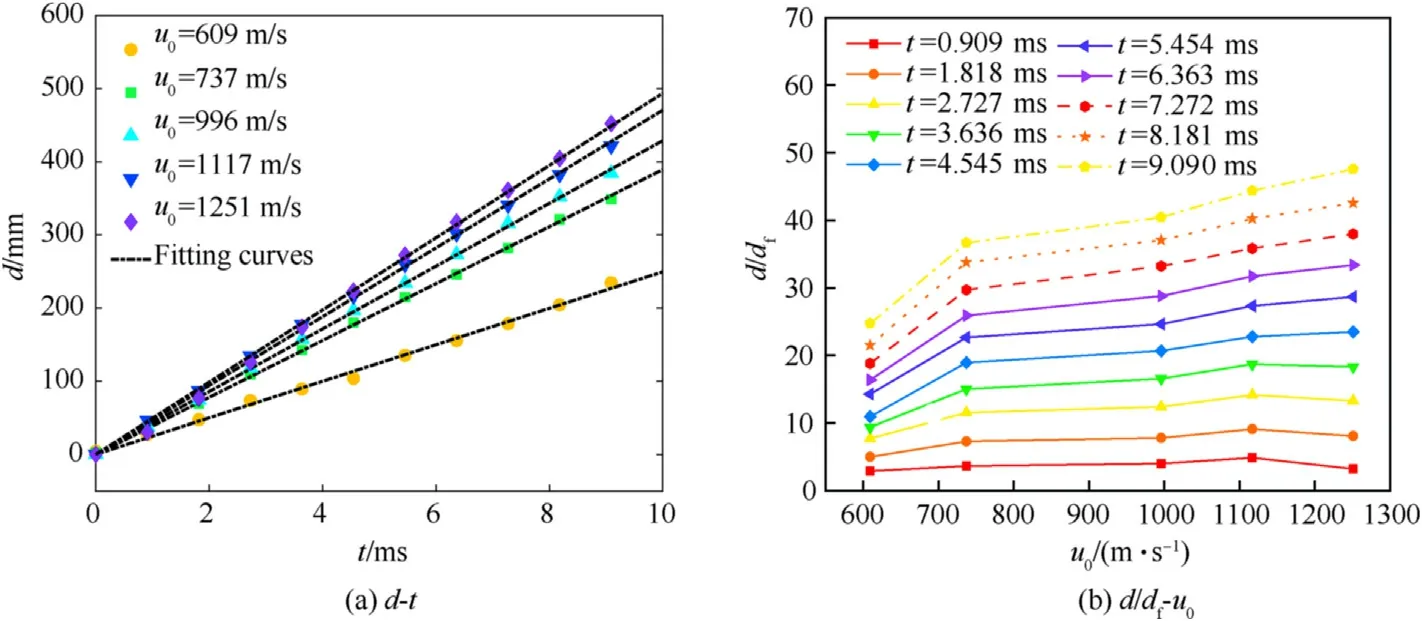
Fig.20.The displacement versus the time and the impact velocity of the fragment.
Declaration of competing interest
The authors declare that they have no known competing financial interests or personal relationships that could have appeared to influence the work reported in this paper.
Acknowledgment
We would like to thank the National Natural Science Foundation of China(Grant No.11572159)and the National Defense Science and Technology Foundational Enhancement Program Technology Field Foundation(No.2020-JCJQ-JJ-401)for providing the financial support for this study.
Nomenclature
u0:The impact velocity of the fragment
ur:The residual velocity of the fragment after exit the water-filled container
ud:The difference betweenu0andur
vs:The velocity of the liquid spurt
U:The dimensionless velocity of the liquid spurt,U=vs/u0
N:The time order of the liquid spurt
t:The time during the hydrodynamic ram
d:The displacement of the liquid spurt
df:The fragment diameter
P:The pressure in the liquid
P0:The collapse pressure in the liquid at the first time of cavity collapse
Pc:The pressure in the liquid when the cavity grows to its maximum radius
P1:The pressure at the position of transducer 1
P2:The pressure at the position of transducer 2
r:The distance in the liquid
R0:The initial cavity radius when the cavity begins to collapse
TL:The propagation loss of the sound pressure signal extending fromR0toR
x1:The distance from the collapse center of the cavity to the penetration orifice.
x2:The distance from the collapse center of the cavity to the transducer 1
x3:The distance from the collapse center of the cavity to the transducer 2
V0:The volume of the cavity when the cavity radius isR0
Vmax:The maximum volume of the cavity
n:The amount of substance of the ideal gas
R:The gas constant
T:The temperature inside the cavity
t1:The occurrence time of the cavity contract
t2:The time when the cavity grows to its maximum volume
t3:The occurrence time of the first collapse of the cavity
t4:The occurrence time of the second collapse of the cavity
tp:The duration of the fluctuation of the pressure in the penetration phase
PN1~PN4:The peak pressure in the cavity oscillation phase,the subscript represents the number of the occurrence of the peak pressure
Nm:The ratio between two peak pressures in the cavity oscillation phase
杂志排行
Defence Technology的其它文章
- Modified couple stress and thickness-stretching included formulation of a sandwich micro shell subjected to electro-magnetic load resting on elastic foundation
- Recent advances in the synthesis and energetic properties of potassium-based potential green primary explosives
- Investigation of normal,lateral,and oblique impact of microscale projectiles into unidirectional glass/epoxy composites
- A quasi-isentropic model of a cylinder driven by aluminized explosives based on characteristic line analysis
- Kevlar fabric reinforced polybenzoxazine composites filled with silane treated microcrystalline cellulose in the interlayers:The next generation of multi-layered armor panels
- Preparation of ammonium nitrate-based solid composite propellants supplemented with polyurethane/nitrocellulose blends binder and their thermal decomposition behavior
