Investigation of normal,lateral,and oblique impact of microscale projectiles into unidirectional glass/epoxy composites
2022-11-28ChristopherMeyerIsabelCatugasJohnGillespieJrBazleGamaHaque
Christopher S.Meyer,Isabel G.Catugas,John W.Gillespie Jr.,Bazle Z.Gama Haque
University of Delaware Center for Composite Materials(UD-CCM),101 Academy Street,Newark,DE,19716,USA
Keywords:Microscale Hypervelocity impact Composites Erosion Penetration
ABSTRACT Spacesuits and spacecraft must endure high velocity impacts from micrometeoroids.This work considers the impact of 100 μm diameter projectiles into composite targets at velocities from 0.5 km/s to 2 km/s.This work begins by presenting an energy-based theoretical model relating depth of penetration(DoP)and impact force to impact velocity,characteristic time,and threshold velocity and force.Next,this work compares numerical simulations of normal impact on composites to the theoretical model.Numerical simulations are conducted with LS-DYNA and the well-known composite model,MAT-162.The numerical models consider unidirectional S2-glass fiber reinforced SC-15 epoxy composite laminates.The numerical model shows good correlation with the theoretical model.The numerical model also investigates lateral impact,parallel to the fiber direction,and oblique impact at angles from 30° to 82.5°.This work decomposes oblique impact into normal and lateral components,and compares them with normal and lateral impact results.The results show good correlation of the normal component of oblique results with the theoretical model.This numerical and theoretical study focuses on DoP,velocity,and penetration resistance force as functions of time.The theoretical model and numerical simulations are used to determine new DoP parameters:characteristic time of depth of penetration and threshold impact velocity.These models are a first step in developing the capability to predict DoP for oblique,microscale,high-speed impact on composite materials.
1.Introduction
Micrometeoroids and orbital debris are abundant in space and pose a long-term threat to spacecraft and spacesuits.Micrometeoroids are very small fragments of asteroids while orbital debris are fragments of any size of man-made spacecraft or space structures.In Low Earth Orbit(LEO),defined as 2000 km from Earth"s atmosphere,orbital debris are more likely to be encountered than micrometeoroids.Orbital debris travel at an average velocity of 10 km/s and typically have diameters smaller than 5 μmor larger than 500 μm.However,at altitudes of 35000 km and in interplanetary space,micrometeoroids of sizes 5-500 μmare the primary potential threat to spacecraft and spacesuits and can reach velocities up to 70 km/s[1].Protecting spacecraft and spacesuits against these tiny particles is one of the biggest challenges for space engineers.
Spacecraft currently in LEO,including the Hubble Space Telescope(HST)and the International Space Station(ISS)regularly experience hypervelocity impacts from small particles,which decreases the integrity and functionality of the spacecraft.An HST solar array examined in 1993 after 3.6 years of exposure in space demonstrated impact crater diameters of 50-3000 μm[2](e.g.,Fig.1a).After the retrieval of the HST in 2002(about 8.25 years of exposure),it was found that the number of impacts per 8 cm2solar cell varied between 7 and 22[3].On 2 m2of ISS airlock shields,inspected in 2011(after 9 years of exposure),58 impact craters measuring 0.3-1.8 mm in diameter were found[4](e.g.,Fig.1b).Hypervelocity impacts in space result in ejecta from the spacecraft and projectile fragmentation.These fragments add to the LEO population of orbital debris,which has been accumulating for decades,and they increase the risk of devastating damage to spacecraft[5].
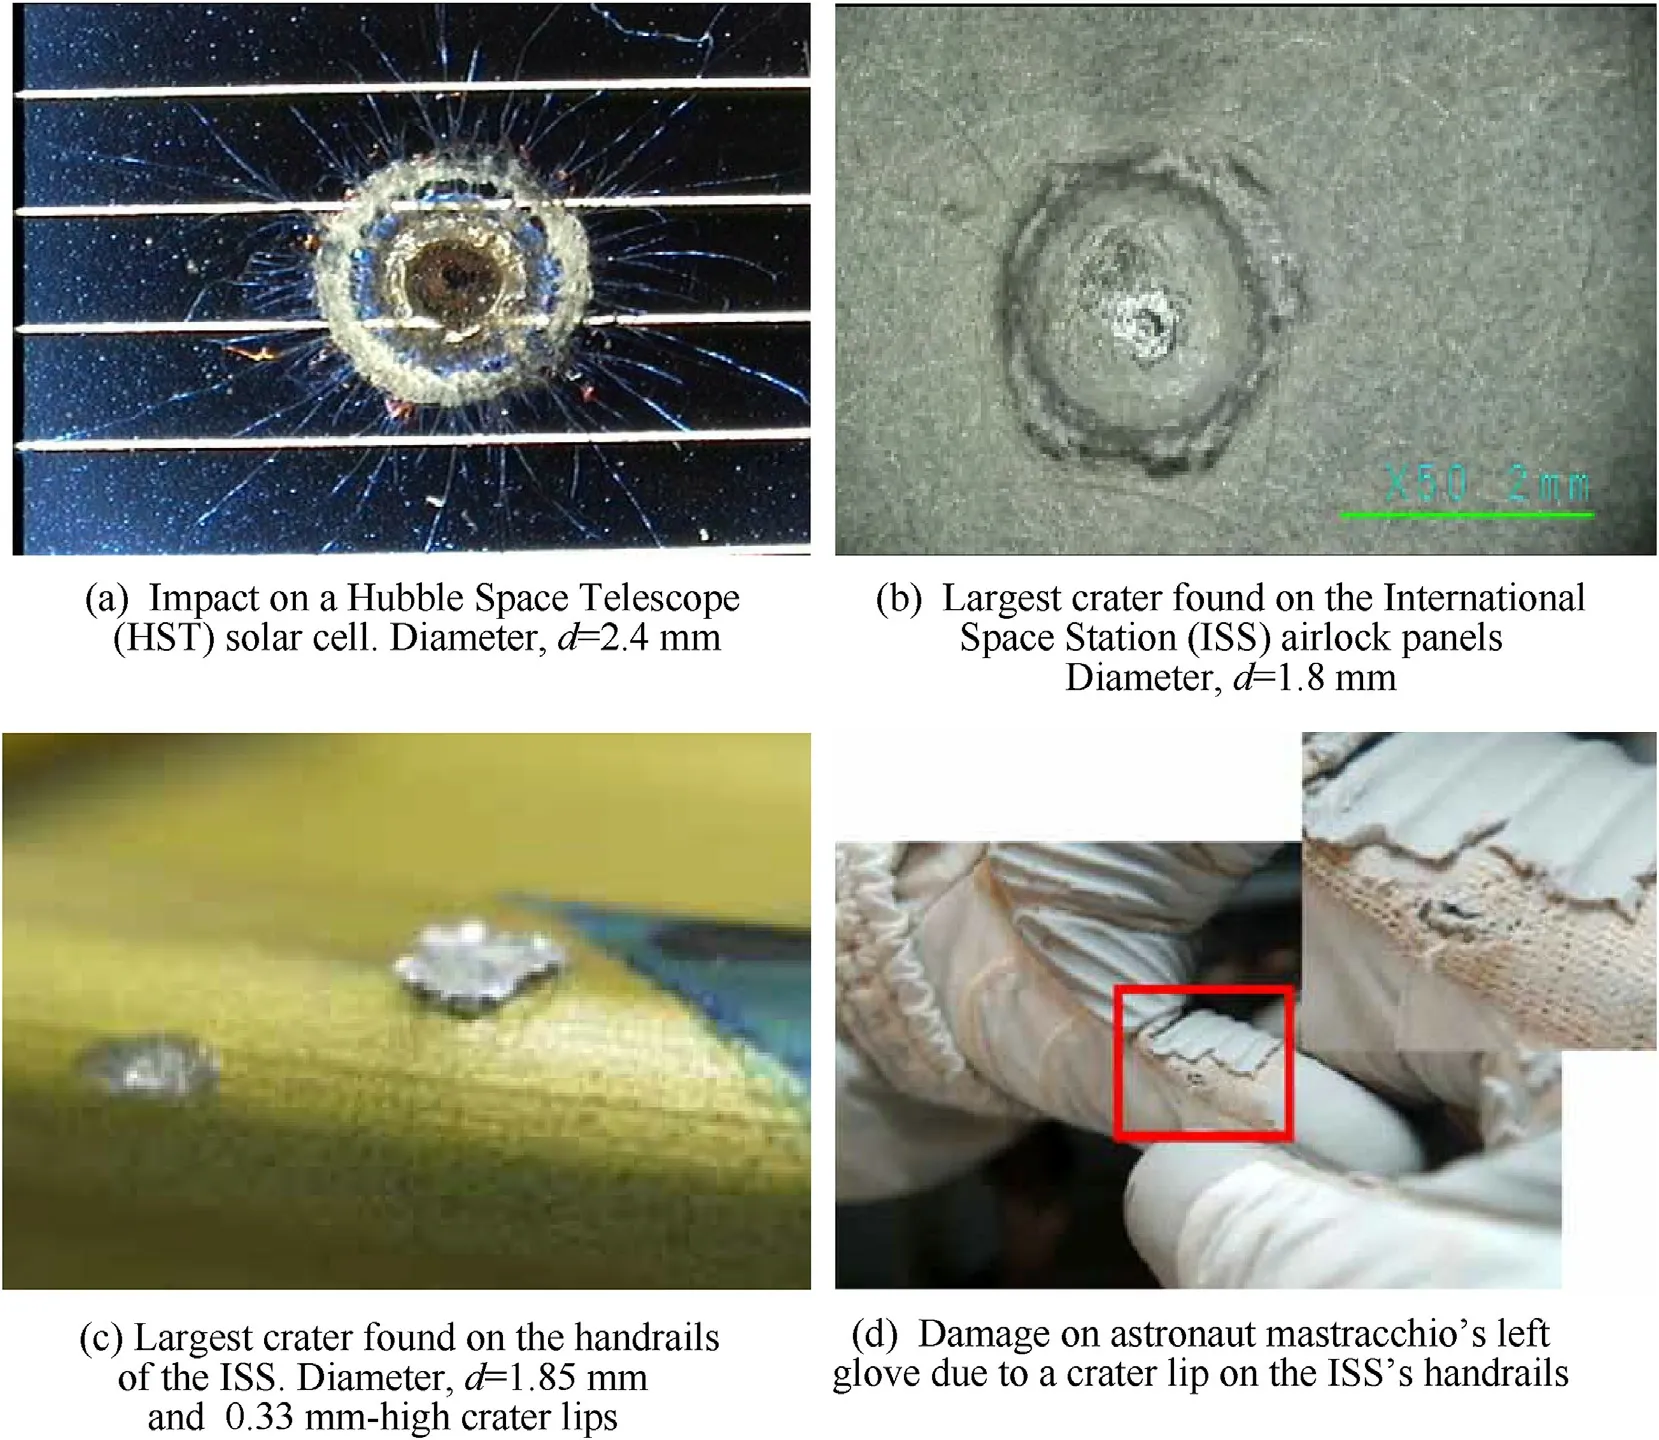
Fig.1.Examples of observed impacts in space and resulting damage.
Spacesuits,or Extravehicular Activity(EVA)suits,are also exposed to the risk of impact by micrometeoroids and orbital debris[6].Any damage to EVA suits can compromise the safety of the astronaut and shorten the life of the suit.Incidents have been reported in which EVA gloves were cut by an impact-induced crater on the handrails of the ISS(e.g.,Fig.1c).Although the damage was small,it resulted in the early termination of the EVA suit[7](e.g.,Fig.1d).These examples of micrometeoroids and orbital debris endangering spacecraft and spacesuits show that improving designs and materials is especially important to protect and advance space technology.
Experimental investigation of hypervelocity micrometeoroid impacts on structures is typically carried out with light gas guns(LGG)[8-12],but can also be conducted with laser driven flyer plates[13,14],or high explosives[15].LGGs can accelerate projectiles of up to 200 mm up to velocities of 6 km/s,but can be costly to operate and are limited in throughput.Although LGGs are typically used to launch 1-3 mm micrometeoroids(e.g.Refs.[9-12]),they can be used for 100-300 μmprojectiles(e.g.Refs.[2,16]),but the capability of launching an individual spherical projectile of 100 μmdiameter is extremely rare[16].Laser driven flyer plates can easily launch thin metal film projectiles of 100 μmor less up to velocities of 6 km/s,both economically and with high throughput,but are limited in projectile size,shape and material[17].Explosively driven projectiles require specialized facilities,which are rare and can be costly to operate.Computational simulations provide the capability for studying a wide variety of impact scenarios and are extensively used in hypervelocity micrometeoroid analysis(e.g.Refs.[10,11,18-22]).Since composites are increasingly used in space structures[23],the response of composite materials to micrometeoroid impact are also investigated experimentally(e.g.Refs.[10-13,24-27])and numerically(e.g.Refs.[10,11,19-22,28]).However,the state-of-the-art does not currently have predictive capability for oblique,microscale,high-speed or hypervelocity impact on composite materials.The numerical and theoretical models presented here are a first step in developing the capability to predict depth of penetration(DoP)for oblique,microscale,highspeed impact on composite materials.
In the present study,high-and hypervelocity impacts on unidirectional S-2 glass/SC15 toughened epoxy composites are simulated.Depth of penetration(DoP)and composite micro-erosion are examined.DoP experimental analysis methodology is used to reduce the computational DoP data,and the simulations are used to examine the effects of impact velocity,obliquity,and micro-erosion on composite targets.This work presents a novel theoretical model that relates the new DoP material parameters of characteristic time of depth of penetration and threshold impact velocity to the predicted depth of penetration and penetration resistance force as functions of impact velocity.This work develops a numerical model,validated with the theoretical model,and uses the model to examine oblique impact in terms of normal and lateral impact components.
2.Finite element modeling
2.1.Finite element models of depth of penetration and microerosion
Space polymer matrix composites are typically made from fine woven reinforcement with 0°and 90°tow thicknesses on the order of 100 μm.At the mesoscale(i.e.,~1000 μm)the woven material may be adequately represented as continuum,unidirectional(UD)composite,which is what we consider in this work.Likewise,100 μmis sufficiently larger than the fiber length scale(i.e.,~10 μm),which also justifies the continuum assumption.The continuum,UD assumption is demonstrated in Fig.2,which shows that at the length scale of the projectile diameter(100 μm),the woven composite is reasonably approximated by unidirectional composite.Additionally,the continuum assumption is reasonable since the length scale of the projectile is much greater than the fiber diameter.
We developed two UD finite element(FE)models.We designed model A(Fig.3)for the study of normal impact and depth of penetration through the thickness of the composite layers.We also use model A to study microscale erosion due to oblique impact.We designed model B(Fig.4)for the study of lateral depth of penetration,which is normal impact,lateral to the composite layers.Finite element model A is made of 20 unidirectional S-2 glass/SC15 epoxy composite laminas(thicknesslZ=62.5μm,Fig.3b)with stacking sequence[02/902]5.
The geometric dimensions of the FE model areLX×LY×LZ=2000 μm×1250 μm×1250 μm(Fig.3a).Model A includes 611,000 three-dimensional(3D),solid brick elements.Where projectile impact occurs,the mesh is refined to 6.25 μmper side cubes.This mesh size is 1/10th of the layer thickness so that there are 10 elements through the thickness of each refined layer under projectile impact.Away from projectile impact,the mesh expands to 62.5 μmper side cubes.Two sets of transition elements expand the mesh from the impact region.
To the boundary region(Fig.3b,c).Ten through-layer-thickness elements is the maximum practical mesh refinement with reasonable computational cost.Similar work has used one[29,30],three[31],and six[32]through-layer-thickness elements and shown good correlation with experiments.Refining the mesh one more level(i.e.,3.125 μmper side cubes)would increase the number of elements by 23(e.g.,to 4888000 elements in model A),it would reduce the timestep by half,and thereby double the solution time.Computational stability is ensured by controlling the timestep and ensuring the minimum contact stiffness necessary to prevent interpenetration.
Simulations use two projectiles:(i)a right circular cylinder(RCC)with massmRCC=6.153 μg,diameterDP=100 μm,and heightHP=100 μm,and(ii)a sphere with massmSph=4.027 μgand diameterDP=100 μm.The element size of the projectiles is about 10 μm.Table 1 includes geometric and mass properties of models A and B.Model B consists of 8 layers,each with the same thickness per layer as in Model A,and Model B has stacking sequence[0]8.The geometric dimensions of model B are 1500 μm×1250 μm×500 μm,and it has a total of 504,000 3D solid brick elements.Two sets of transition elements expand the mesh from the impact region to the boundary region.Model B uses the same RCC and spherical projectiles as Model A.

Table 1Finite element model A and B dimensions and mass properties.
2.2.Initial and boundary conditions
Semi-infinite,non-reflecting boundary conditions are used on all non-impact faces.The angle of obliquity,θ,is defined as the angle between the resultant direction of impact and the normal to the impact surface.The angle of obliquity is shown schematically in Fig.5 whereVXandVZare theXandZcomponents of the resultant impact velocity,VR.Both models A and B were subjected to normal impact(θ=0°)by RCC and spherical projectiles.Oblique impact simulations(θ>0°)used only the spherical projectile.Normal impact simulations with model A applied an initial projectile velocity only in the negative Z-direction.Oblique impact simulations with model A applied initial projectile velocity in theX-andZ-directions to achieve the desired angle of obliquity,θ,i.e.,
Simulations used the explicit dynamic finite element analysis code,LS-DYNA.Total simulation time is 1 μs.Computations are solved by a 24-processor workstation,and require 12-54 h wallclock time depending on the model and initial conditions.
2.3.Material properties

Fig.2.Scanning electron microscope image of woven microstructure illustrating the application of the continuum,unidirectional composite assumption relative to a 100 μm diameter projectile.
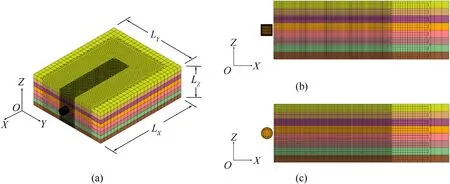
Fig.4.(a)3D finite element Model B,a unidirectional 8-layer composite laminate,and two projectiles,a right circular cylinder(RCC)and a sphere.LX×LY×LZ=1500 μm×1250×500μm,layer thickness,lZ=62.5 μm,and impact area mesh size,6.94 μm.(b)Cross section of Model B with RCC projectile of diameter,DP=100 μm,height,HP=100 μm,and mass mRCC=6.153μg.(c)Cross section of Model B with spherical projectile of diameter,DP=100 μm and mass,mSph=4.027μg.
Simulations used the well-known MAT-162 constitutive model to capture the rate-dependent,progressive damage evolution of unidirectional composite laminates under micro-impact loading.Unidirectional S-2 glass/SC15 epoxy composite material parameters and LS-DYNA modeling have been extensively characterized and experimentally validated,and model parameters are provided in Table 2[31,33-39].Readers are referred to these references for detail on the basis of the parameters provided in Table 2.The parameters in Table 2 are defined as follows.Subscripts relate to fiber direction where 1 indicates parallel to the fiber direction,2 indicates transverse to the fiber direction,and 3 indicates through the thickness direction.With respect to the coordinate axes in Figs.3 and 4,these directions correspond to the coordinate axes as follows:for a[0]layer,1 toX,2 toY,and 3 toZ,and for a[90]layer,1 toY,2 toX,and 3 toZ.ThenE1,E2,E3are elastic moduli,ν21,ν31,ν32are Poisson"s ratios,andG12,G23,G31are shear moduli.Similarly,X1,TandX1,Care fiber direction tensile and compressive strengths,X2,TandX2,Care transverse direction tensile and compressive strengths,andX3,Tis through-thickness tensile strength.Through-thickness compressive strength is controlled bySFC,which is crush strength.Shear strengths are given bySFS,which is fiber shear strength,and byS12,S23,andS31.SFFC is the scale factor for residual compressive strength(i.e.,minimum compressive strength of completely damaged material is 10%of the undamaged compressive strength).PHIC is the Coulomb friction angle for matrix and delamination failure.S-DELM is the scale factor for delamination,and OMGMX is the limit damage parameter for elastic modulus reduction.Element erosion criteria are given by E-LIMIT,the element eroding axial strain,ECRSH,the element is eroded if it reaches this fraction of original volume under compression,and EEXPN,the element is eroded if it reaches this multiple of the original volume under expansion.Strain rate softening coefficients are given by AM1 and AM2,for fiber damage in directions 1 and 2,AM3,for fiber crush and punch shear damage,and AM4 for matrix and delamination damage.Finally,the coefficients for strain-rate dependent properties are strength,Crate1,axial moduli,Crate2,shear moduli,Crate3,and transverse moduli,Crate4.Additional detail may be found in the MAT-162 user manual[40].
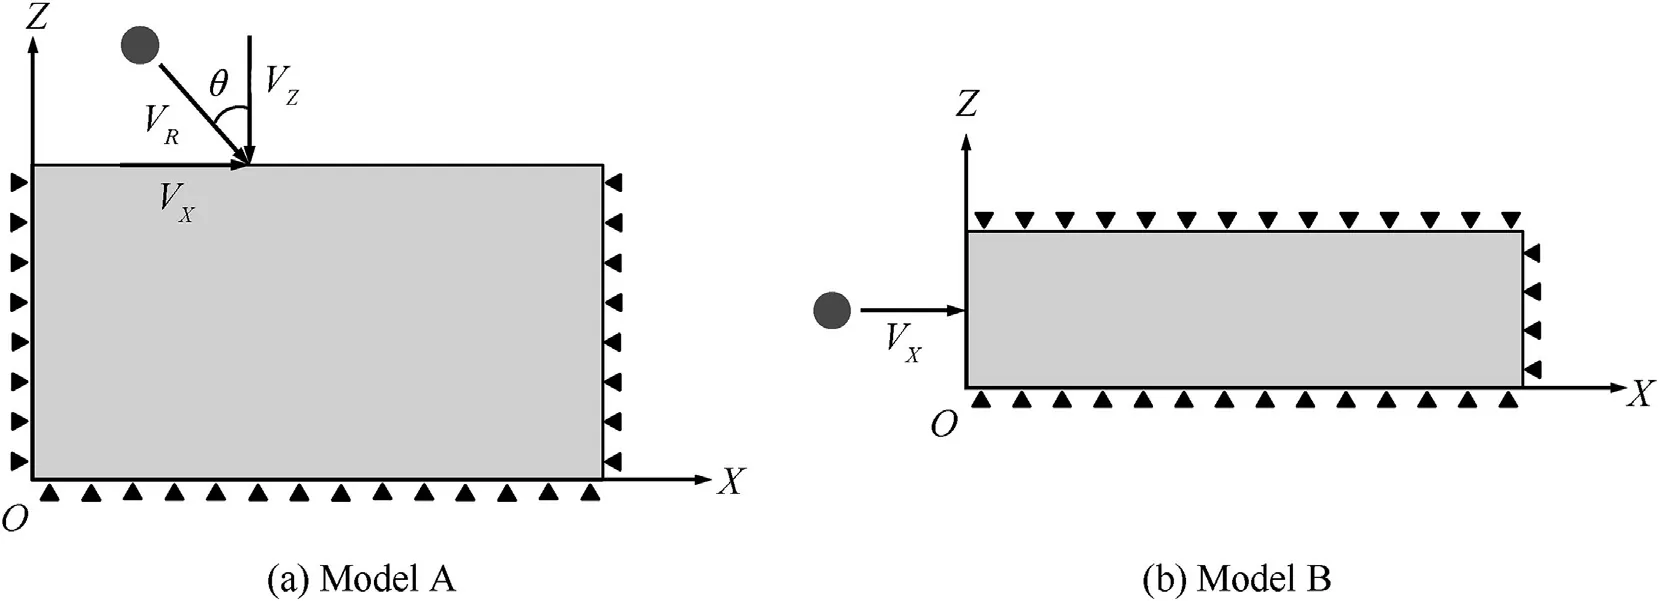
Fig.5.Schematic diagram of the initial and boundary conditions assigned to the FE models.

Table 2MAT162 Input Properties & Parameters of unidirectional S-2 Glass/SC15 Composites.
Rigid,elastic steel projectiles used the following properties:ρ=7.85 g/cm3,E=210 GPa,ν=0.29.Models included static(fS=0.5)and dynamic(fD=0.3)frictional coefficients for contact between the projectile and the composite target.
It should be noted that MAT-162 does not include an equation of state,which is important for hypervelocity impacts and very large pressures.In this work,the maximum impact velocity is 2 km/s.Under high pressure,progressive damage and failure in MAT-162 is governed by the parameters for crush strength,SFC,and fiber crush/punch-shear strain softening,AM3.Volumetric compression and related energy dissipation are modeled by only allowing element deletion under compression if the element volume is reduced to 1%of initial volume(i.e.,AM3=1).Parametric studies and the effects of volumetric compression are reserved for future work since the present parameters have been extensively characterized and experimentally validated[31,33-39].Further,it should be noted that the projectile was assumed rigid and non-eroding.Under very high and hypervelocity impacts,an impactor may erode.Low density,porous micrometeoroids can be expected to disintegrate.Metal impactors from orbital debris will plastically deform,but consideration of projectile plasticity is reserved for future work.The present work must be limited to considering a rigid projectile so that the numerical results can be compared with the theory presented in the following section since the theoretical model must assume a rigid projectile.
3.Results and discussion
3.1.Energy-based analysis method for depth of penetration data
Recently,Haque and Gillespie[41]presented a new theoretical model for the analysis of experimental depth of penetration(DoP)data.This model uses an energy-based approach to identify several novel parameters important to the analysis of depth of penetration.These parameters include threshold velocity of penetration,VTH,characteristic time,τDoP,and damping coefficient,cDoP,which will be discussed below.While this model was developed using experimental DoP data,in the present work we apply this theoretical model to numerical depth of penetration data.The following is an abbreviated review of the theoretical model,but the model is presented more completely in Appendix A or by Haque and Gillespie[41].
A rigid,flat-nosed,right-circular-cylindrical projectile impacts a semi-infinite target with impact velocityVI.The projectile has radiusrP,heightHP,massmP,and density ρP.There exists a threshold impact velocity,VTH,below which the projectile will not penetrate into the target,but instead rebounds from the target with velocityVRTH.The rebounding projectile travels in a direction opposite from the direction of the impact velocity,as shown schematically in Fig.6a.Conversely,for an impact velocity greater than the threshold velocity,the projectile will penetrate into the target to a depth ofdP.Upon reaching the depth,dP,ifVIis sufficiently greater thanVTH,the projectile will instantaneously stop then rebound with a velocityVR,as shown schematically in Fig.6b.
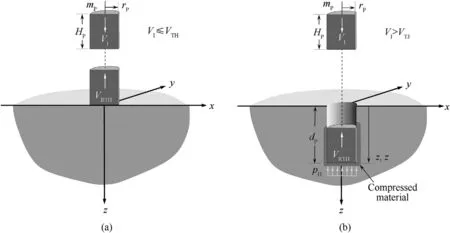
Fig.6.Fundamental Concept of Depth of Penetration Experiments in which(a)impact velocity is less than a threshold velocity required for penetration,VI<VTH and(b)impact velocity is greater than the threshold velocity,VI>VTH.
Projectile penetration into the target stops when the instantaneous velocity of the projectile,V(t),equals the threshold velocity,i.e.,V(tTH)=VTH.Here,tis time,andtTHis the time when the instantaneous projectile velocity equals threshold velocity.During the penetration process,an instantaneous penetration resistance forceFP(t)acts on the projectile.This penetration resistance force is defined asFP(t)=πr2PpH(t),wherepH(t)is the hydrodynamic pressure of the highly compressed composite material in contact with and under the penetrating projectile(Fig.6b).The magnitude ofVTHis governed by the stiffness of the target.We can considerVTHas a material parameter of the target(for a given projectile)because the projectile cannot penetrate the target with a velocity less than this threshold velocity.Also,VTHcan be determined from DoP experiments.
The principal of work and energy can be used to derive the following relationships,which are presented here without further explanation.The full derivation is provided in Appendix A.The depth of penetration,dP,is related to the impact,VI,and threshold,VTH,velocities through a characteristic time,τDoP.

By fitting the DoP data using Eq.(1),the characteristic time,τDoP,and the threshold velocity of penetration,VTH,can be determined.The unit of characteristic time can be expressed as[mm/(km/s)],which means that the projectile will penetrate the target by“τDoP“mm per km/s of differential impact velocity(i.e.,VI-VTH).The initial penetration resistance force,FI,is calculated as

Similarly,the threshold penetration resistance force,FTH,is calculated as

The negative signs indicate the force acts in a direction opposite to the direction of penetration(i.e.,zin Fig.6).After the projectile penetrates into the target and decelerates to the threshold velocity,the projectile enters a dynamic indentation phase during which the projectile velocity may be expressed as

During the penetration phase,for velocities greater than the threshold velocity,the velocity of the projectile as it penetrates into the target may be expressed as

Finally,the penetration resistance force acting on the projectile may be computed by

Eq.(1)through(6)are used in the following depth of penetration analysis.
3.2.Through-thickness microscale depth of penetration
To study projectile depth of penetration as a function of impact velocity,we conducted fourteen depth of penetration(DoP)simulations at seven impact velocities ranging fromVI=0.5 km/s toVI=2 km/s.Seven of these simulations used a right circular cylindrical(RCC)projectile,and seven used a sphere.In all of these simulations,projectile penetration was perpendicular to lamina thickness as shown in Fig.3(i.e.,through-thickness,model A).Each of the 20 laminas in the target is 62.5 μmthick,and each projectile is 100 μmin diameter,hence microscale penetration.
Through-thickness depth of penetration data is provided inTable 3.The depth of penetration at each impact velocity for each projectile was measured from the undeformed impact surface to the final projectile position.In Table 3,forceFIis determined from Eq.(2),pHis determined fromFIdivided by the projectile crosssectional area,andtTHis determined from the data as the time at which threshold velocity is reached.The depth of penetration data is plotted and fit with Eq.(1)in Fig.7.Characteristic time,τDoP,is the slope of lines in Fig.7,and it is a measure of penetration resistance.From Eq.(1),we determined the characteristic time and threshold impact velocity of penetration,VTH,for both the RCC and spherical projectiles.The RCC characteristic time is 0.284 μsand its threshold impact velocity is 0.243 km/s.The sphere characteristic time is 0.311 μsand its threshold impact velocity is 0.200 km/s.The characteristic time of the RCC is less than the sphere because the target penetration resistance against the RCC is greater than the sphere.Qualitative DoP simulation results are presented in Fig.8.Note that all damage modes of MAT-162,including interlaminar delamination,are included in simulations,but discussion of these are beyond the scope of this work,which focuses on projectile depth of penetration,velocity,and the penetration resistance force of the target as these relate to the theoretical model presented.The reduction in projectile velocity over time,as it penetrates into the target,is plotted in Fig.9 for each impact velocity and projectile.There is a slight initial plateau in velocity for the spherical projectiles as the sphere projected area comes fully into contact with the target.
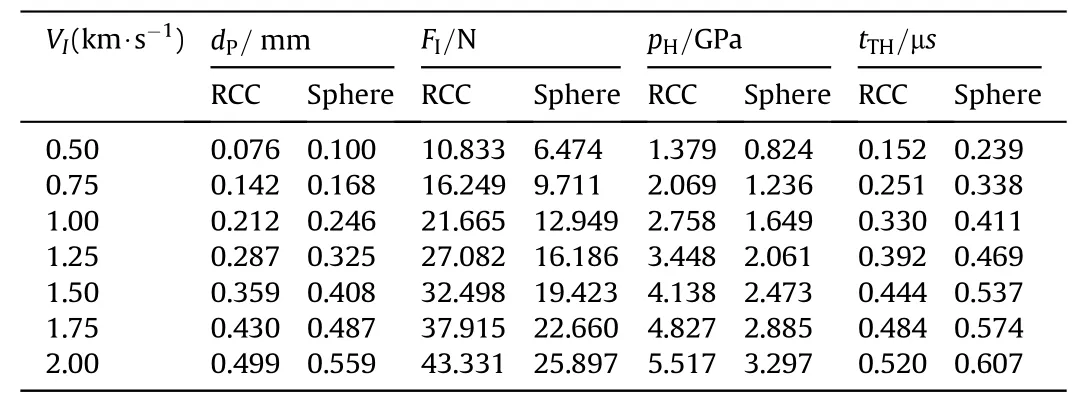
Table 3Through-thickness depth of penetration results for right circular cylindrical(RCC)projectile(mP=6.153 μg,τDoP=0.284 μs,VTH=0.243 km/s,FTH=5.265 N)and spherical projectile(mP=4.027 μg,τDoP=0.311 μs,VTH=0.200 km/s,FTH=2.590 N).
We determined the penetration resistance force,FP,as the force acting on the projectile over time.Penetration resistance force is plotted in Fig.10 for each impact velocity and projectile.The RCC has a flat nose,hence a constant contact area with discontinuity around its annulus,but the sphere initially has point contact,more gradually makes contact with its full projected area,and does not have any discontinuity.Because of this difference in contact,the peak resistance force for the RCC projectile is significantly larger than that of the sphere.
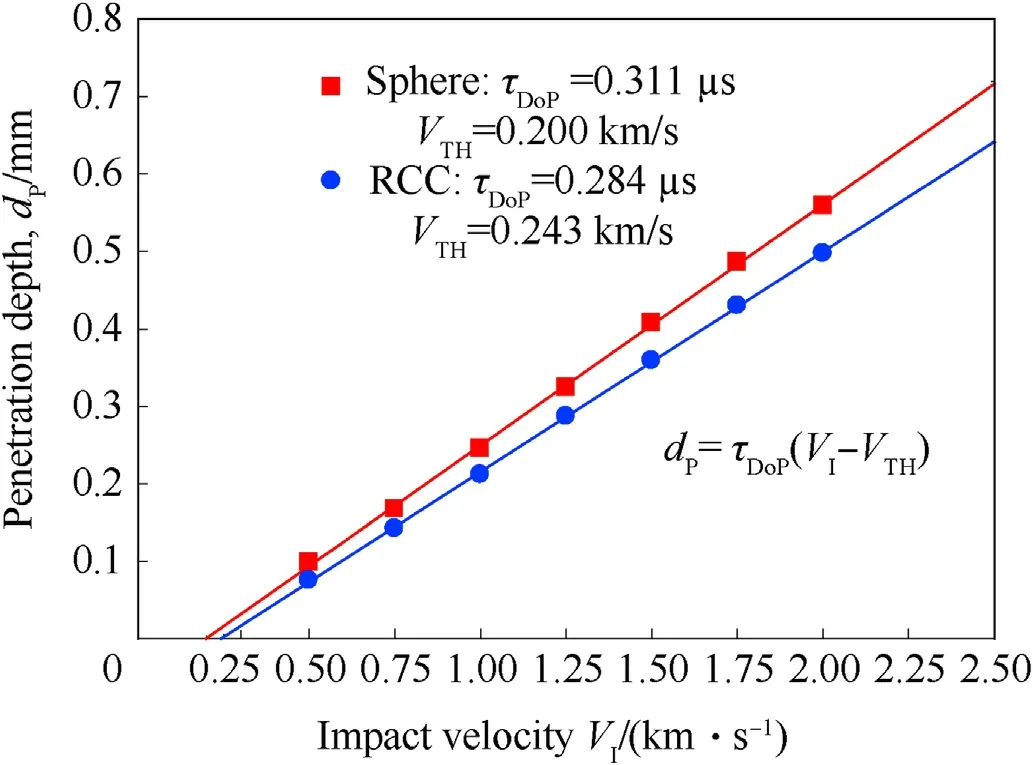
Fig.7.RCC and spherical projectile penetration depth as a function of impact velocity for the through-thickness microscale depth of penetration simulations.RCC projectile mass is 6.153 μg and spherical projectile mass is 4.027 μg.
With the known mass and computed characteristic time for the RCC and spherical projectiles,we can use Eq.(2)to calculate the impact force as a function of impact velocity.The force-velocity data for each projectile is plotted in Fig.11.In Fig.11,we show that the impact force is related to the impact velocity through a damping coefficient,cDoP=mP/τDoP.The damping coefficient for the RCC-target pair is 21.7 kg/s,and the damping coefficient for the sphere-target pair is 12.9 kg/s.This damping coefficient indicates how efficiently the target dissipates energy from a particular projectile.A larger value ofcDoPfor a particular projectile impacting the same target means the target dissipates that projectile"s energy more quickly.The RCC has a larger value ofcDoPthan the sphere,and this is again due to the difference in nose shapes.
When a projectile impacts a target with a particular initial velocity,the projectile"s velocity is reduced as its energy is dissipated,and at some time,the projectile will cease penetrating and begin a dynamic indentation phase.This point in time is the threshold time,tTH,and at that time the projectile"s velocity has reduced from the impact velocity to the threshold velocity,VTH.During the penetration phase,material ahead of the projectile deforms and is displaced to the sides of the projectile,and the projectile penetrates deeper into the target.During the dynamic indentation phase,the material ahead of the projectile is deforming,but the projectile does not displace the material from ahead to the sides.With Eq.(4)and the previously determined characteristic time,τDoP,and threshold velocity,VTH,we can determine the threshold between the penetration and indentation phases.In Fig.12,we normalized the velocity-time curves in Fig.9 by the impact velocity and the characteristic time,then we plotted the threshold line.The threshold line is given by the(VTH,tTH)pair at each impact velocity,for each projectile.Threshold time is given in Table 3 for each projectile.
During the penetration phase,the projectile"s velocity is reduced in a nonlinear fashion according to Eq.(5),but during the indentation phase,the projectile"s velocity is assumed to reduce linearly according to Eq.(4).In Fig.13a,we compare the velocity predicted by Eq.(5)to the RCC projectile velocity versus time data from Fig.9a.In Fig.13a,it may be seen that the theoretical model fits the data well during the penetration phase.However,once the projectile enters the dynamic indentation phase,Eq.(5)diverges from the data.
The penetration resistance force is given by Eq.(6),and Fig.13b compares the numerical simulation results for through-thickness RCC penetration.The theoretical model fits well for higher velocity impacts,but the force-time data for lower velocity impacts oscillates.During penetration,the resistance force oscillates because the projectile makes contact with the target and the force increases,then the target elements reach a failure strain and are eroded from the computation,leading to a decrease in force.The projectile motion then catches up to the target surface and contact again increases force,followed again by erosion,and so on causing oscillation of the force versus time data.This oscillation is more apparent for the RCC projectile than the sphere,as seen in Fig.10.Additionally,in this work,the theoretical model is only applied to the RCC.A detailed study of the effects of projectile geometry is reserved for future work.The present study seeks to better understand oblique depth of penetration in a composite target by decomposing the oblique impact into normal(through-thickness)and lateral components,and studying each component.
3.3.Lateral microscale depth of penetration
Studies of projectile penetration into composites typically proceed through the lamina thickness as in the previous section(i.e.,Fig.3,model A).Composites usually have the greatest resistance to penetration through the lamina thickness because the reinforcing fibers are oriented in the plane perpendicular to the direction of penetration.Through-thickness penetration of composite armor is expected on Earth where gravity helps to ensure the desired orientation of the composite.But a space structure may be oriented differently in three-dimensional space,and micrometeoroids and space debris can travel in any direction.Therefore,in addition to through-thickness penetration,it is important to study the response of composites to micrometeoroids if impacted at an oblique angle.Penetration parallel to the lamina plane is a component of oblique penetration.This lateral penetration is shown in Fig.4.
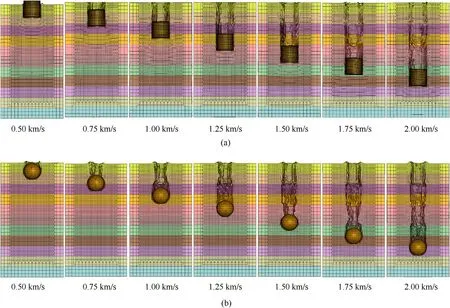
Fig.8.Qualitative through-thickness depth of penetration simulation results for(a)right circular cylindrical projectile with diameter 100 μm,and for(b)spherical projectile with diameter 100 μm.Each composite lamina is 62.5 μm thick.
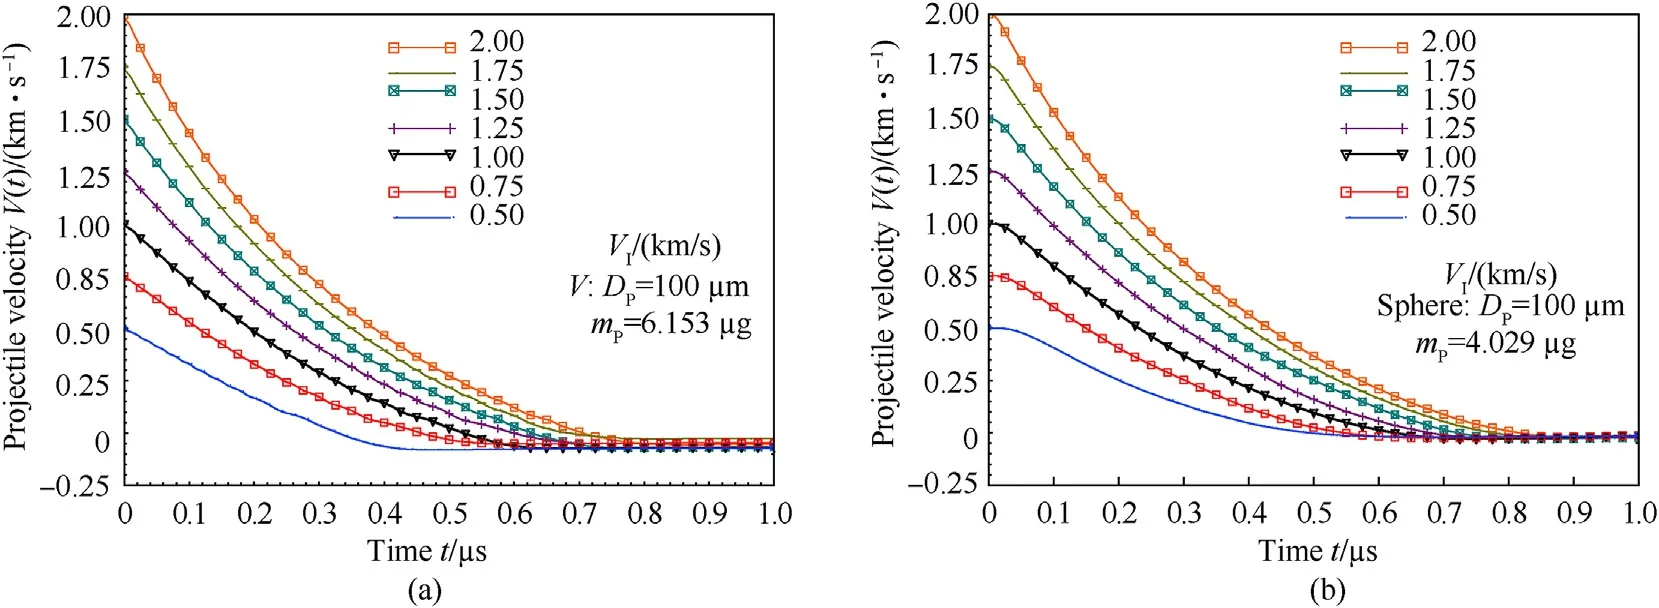
Fig.9.Through-thickness penetration.(a)Right circular cylindrical(RCC)and(b)spherical projectile velocity as it penetrates through-thickness into target over time for each impact velocity.
Here we again conducted fourteen depth of penetration(DoP)simulations at seven impact velocities ranging fromVI=0.5 km/s toVI=2 km/s,half with a right circular cylindrical(RCC)projectile and half with a sphere.In all of these simulations,projectile penetration was parallel to lamina thickness as shown in Fig.4(i.e.,lateral,model B).Similar to the previous section,each of the 8 laminas in the target is 62.5 μmthick,and each projectile is 100 μmin diameter,hence we model microscale penetration.
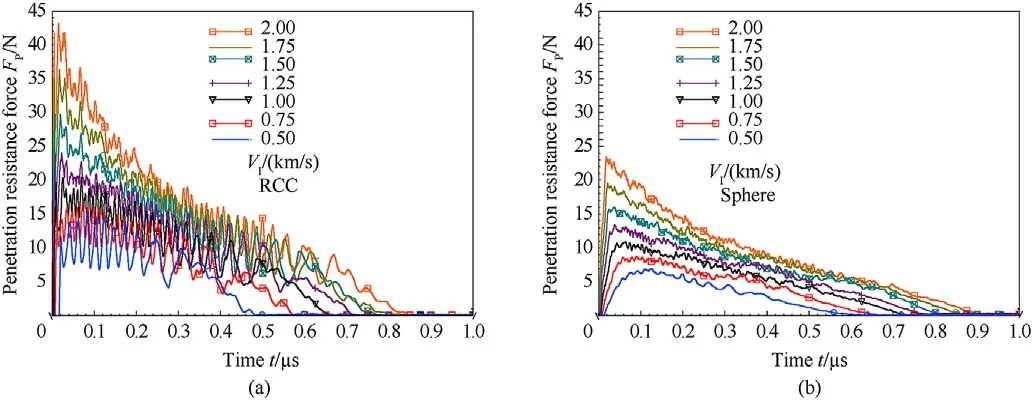
Fig.10.Through-thickness penetration.(a)Right circular cylindrical(RCC)and(b)spherical projectile penetration resistance force as it penetrates through-thickness into target over time for each impact velocity.
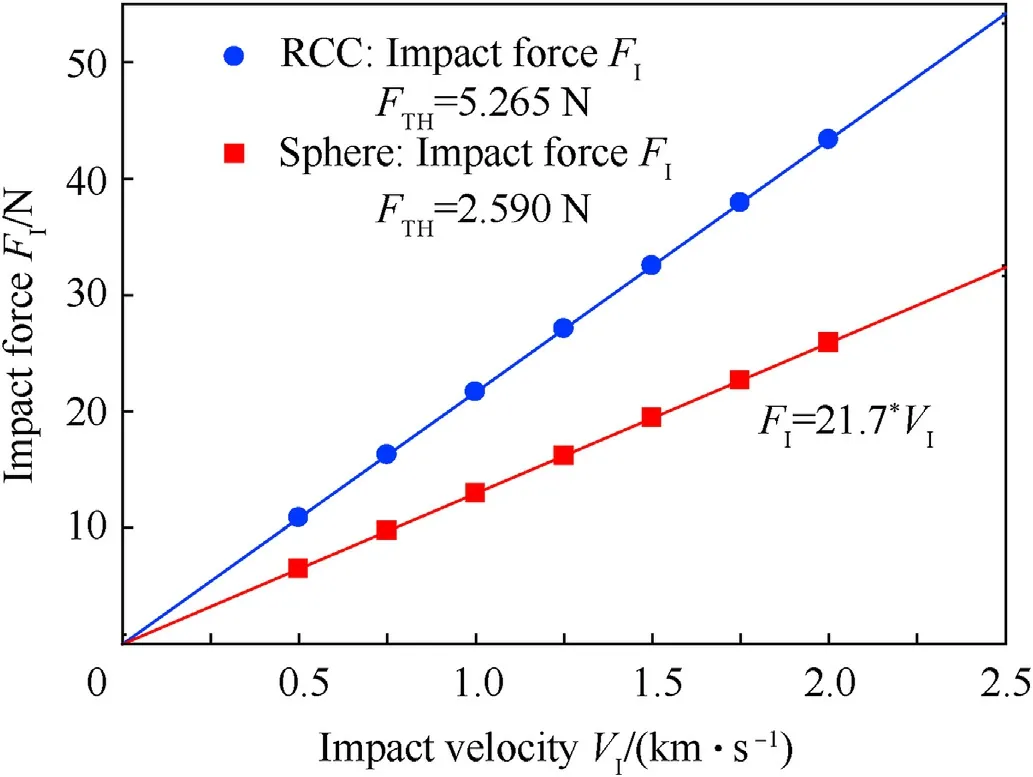
Fig.11.Through-thickness penetration.Right circular cylindrical(RCC)and spherical projectile impact force,FI,as a function of impact velocity with linear fitting lines given by FI=(mP/τDoP)VI=cDoPVI and threshold velocity given by FTH=(mP/τDoP)VTH=cDoPVTH.Here,cRCCDoP=21.7 kg/s and cSphDoP=12.9 kg/s.
Lateral depth of penetration data is provided in Table 4.The analysis here proceeded as for through-thickness penetration.Penetration depth as a function of impact velocity is plotted Fig.14.The RCC characteristic time is 0.371μsand its threshold impact velocity is 0.088 km/s.The sphere characteristic time is 0.380 μsand its threshold impact velocity is 0.103 km/s.The characteristic time of the RCC is only very slightly less than the sphere,in contrast with the through-thickness penetration results,which show a greater difference between RCC and sphere.Through-thickness,the target penetration resistance against the RCC is greater than the sphere,but target resistance to each projectile is almost equal in lateral penetration.Referring to the properties in Table 2 for the[02/902]Scomposite,through-thickness penetration resistance is dominated by tensile strength(X1,T)of the[02](fiber direction)unidirectional layers.However,lateral penetration resistance is dominated by the compressive strength(X1,C),which is roughly half of the tensile strength.Recall that all layers in the lateral impact model(Fig.4)are oriented with fiber direction parallel to penetration(i.e.,[0]8).
Qualitative depth of penetration simulation results are presented in Fig.15.The reduction in projectile velocity over time,as it penetrates into the target,is plotted in Fig.16 for each impact velocity and projectile.As before,there is a slight initial plateau in velocity for the spherical projectiles as the sphere projected area comes fully into contact with the target,but this plateau is smaller for lateral than for through-thickness penetration for reasons just discussed.Penetration resistance force is plotted in Fig.17 for each impact velocity and projectile.Penetration resistance force results are similar in amplitude for both lateral and through-thickness penetration,but lateral penetration takes considerably longer than through-thickness to reduce to zero force(and velocity).
The force-velocity data for each projectile is plotted in Fig.18.The damping coefficient for the RCC-target pair is 16.6 kg/s,and the damping coefficient for the sphere-target pair is 10.9 kg/s.Normalized velocity-time data is plotted in Fig.19,illustrating the penetration and indentation phases.Threshold time is given in Table 4 for each projectile.

Table 4Lateral depth of penetration results for right circular cylindrical(RCC)projectile(mP=6.153 μg,τDoP=0.371 μs,VTH=0.088 km/s,FTH=1.459 N)and spherical projectile(mP=4.027 μg,τDoP=0.380 μs,VTH=0.103 km/s,FTH=1.092 N).
In Fig.20a,we compare the velocity predicted by the theoretical model to the RCC projectile velocity versus time data from Fig.16a.Fig.20b compares the numerical simulation results for lateral RCC penetration with the theoretical model.The theoretical model fits well for higher velocities,and adequately for lower velocities.The validity of the theoretical model was demonstrated experimentally by Haque and Gillespie[41].Here we have validated our RCC numerical simulations of through-thickness and lateral impact by comparison with the theoretical model.Oblique impacts involve normal(through-thickness)and lateral components of velocity,force,and penetration depth.Having determined the response for each of these components and having validated the numerical approach with the theoretical model presented,we now explore oblique impact of a microscale spherical projectile onto a composite target.

Fig.12.Through-thickness rigid body projectile dynamics during the penetration and indentation phases for(a)right circular cylindrical(RCC)projectile and(b)spherical projectile across a range of impact velocities,VI.
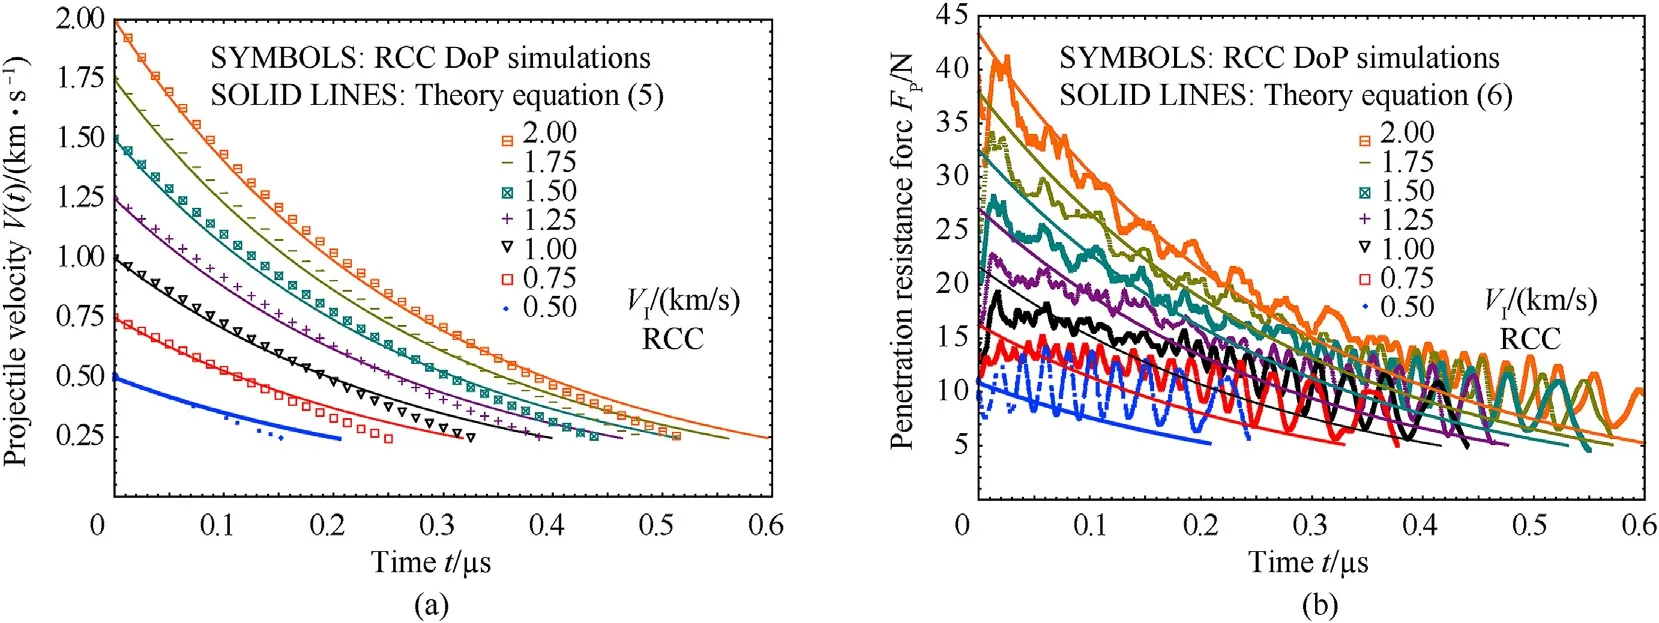
Fig.13.Comparison of theoretical model with RCC DoP simulation data.(a)Velocity versus time simulation data and theoretical model Eq.(5).(b)Penetration resistance force versus time and theoretical model Eq.(6).
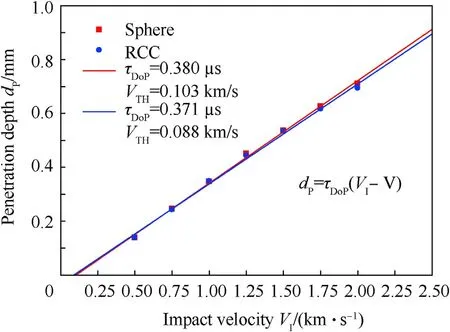
Fig.14.RCC and spherical projectile penetration depth as a function of impact velocity for the lateral microscale depth of penetration simulations.RCC projectile mass is 6.153 μg and spherical projectile mass is 4.027 μg.
3.4.Microscale oblique impact and target erosion
In the preceding sections,we simulated multilayered,unidirectional composites being impacted normally,through the thickness,and laterally,on the edge of the laminas.Often microscale orbital debris and micrometeoroid impact does not occur parallel to these principal directions,but rather occurs at some angle of obliquity relative to the composite laminas.If material is ejected due to this impact,the target surface is eroded.We conducted microscale oblique impact simulations to study such target erosion.Here,all simulations are of a sphere impacting a 20-layer[02/902]5unidirectional composite with 2 km/s initial velocity,but we varied the impact angle from 30°to 82.5°along the X-Z plane(see Figs.3 and 5).Table 5 provides the impact angles along with corresponding X-and Z-components of velocity to yield 2 km/s resultant impact velocity.
Oblique impact results can be decomposed intoX-andZ-components of velocity,depth of penetration,and force,and the penetration mechanics of these components are similar to the through-thickness and lateral impacts described earlier.The depth of penetrationX-(dXP)and Z-components(dZP)are included in Table 5.These X and Z depth of penetration and velocity data are plotted in Fig.21a.These X and Z data are fit separately,each with a line determined by Eq.(1),which fits these data well.From these Eq.(1)fits,theX-andZ-components’characteristic time and threshold velocity were determined and are respectively,τXDoP=0.541 μs,τZDoP=0.311 μs,VXTH=0.355 km/s,VZTH=0.199 km/s.From these,the spherical projectile mass(4.027 μg),and Eq.(3),the threshold force for each component was determined asFXTH=2.642 N andFZTH=2.577 N.
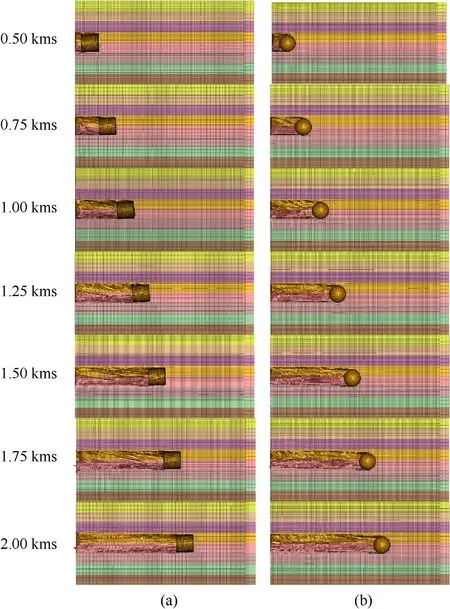
Fig.15.Qualitative lateral depth of penetration simulation results for(a)right circular cylindrical projectile with diameter 100 μm,and for(b)spherical projectile with diameter 100 μm.Each composite lamina is 62.5 μm thick.
Interestingly,the normal,through-thickness sphere DoP data from the previous section also fits well with the normal component of the oblique impact data(dZP)in Fig.21b.However,the slope of the lateral sphere DoP data from the previous section does not fit the lateral component of the oblique impact data(dXP).The increased lateral penetration and displacement of the oblique impact is explained by the rotation,sliding,and friction of the lateral component on the free surface of the target.Lateral depth of penetration is confined within the target,and experiences greater hydrodynamic pressure,which inhibits rotation and sliding,induces friction on additional surface area of the sphere,and thereby reduces penetration depth.However,oblique impact on the target free surface allows the sphere to rotate and slide laterally on the surface and experience friction on less surface area of the sphere.Therefore,more energy is required for lateral penetration than for the lateral(X-axis)component of oblique penetration.However,the data may be shifted by including an additional term in Eq.(1),and this is described in Appendix B.
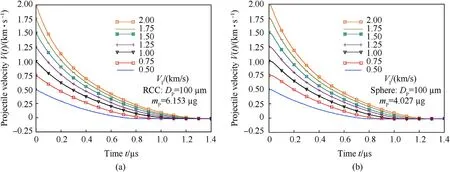
Fig.16.Lateral penetration.(a)Right circular cylindrical(RCC)and(b)spherical projectile velocity as it penetrates laterally into target over time for each impact velocity.
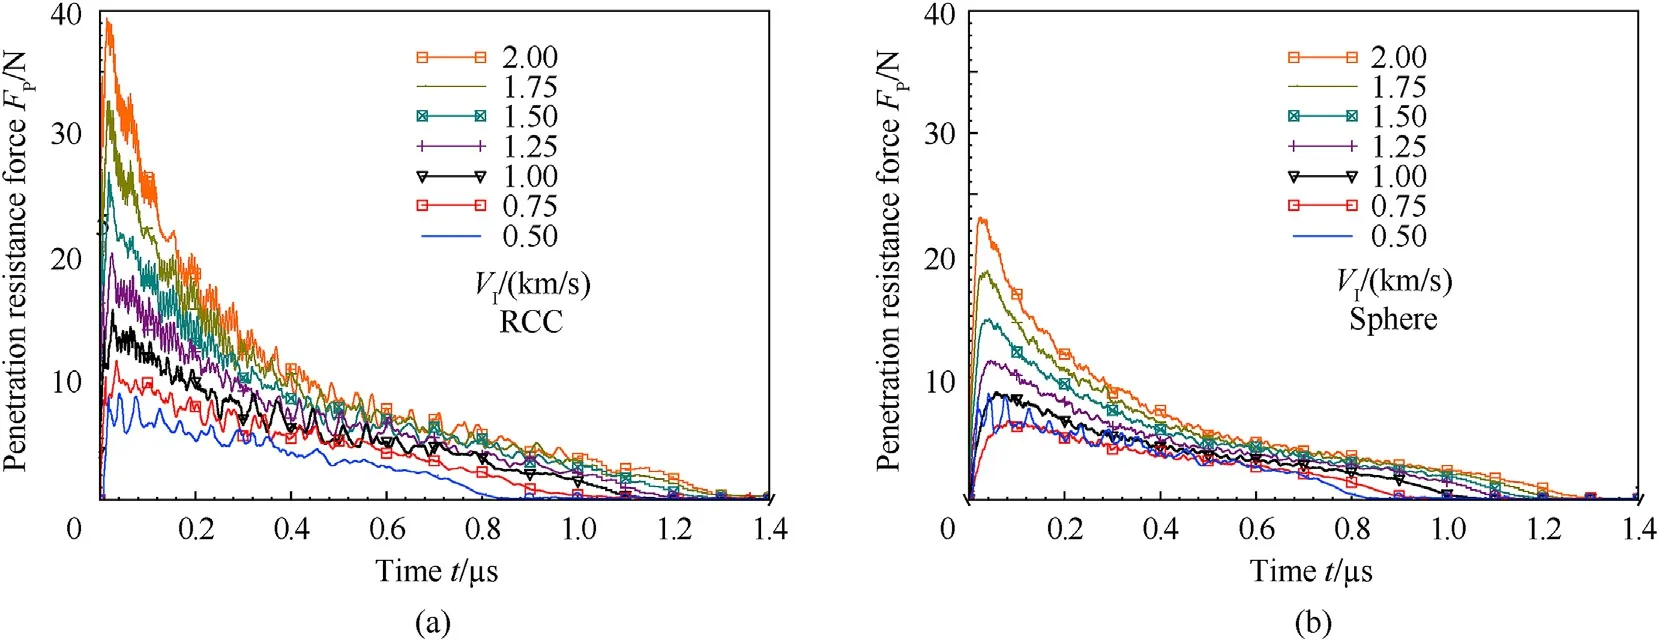
Fig.17.Lateral penetration.(a)Right circular cylindrical(RCC)and(b)spherical projectile penetration resistance force as it penetrates laterally into target over time for each impact velocity.
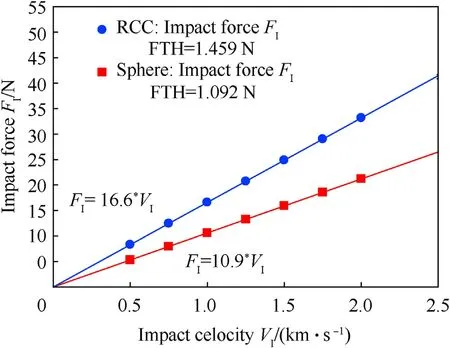
Fig.18.Lateral penetration impact force as a function of impact velocity with analysis conducted as earlier for through-thickness penetration.
Qualitative images of oblique impacts are provided in Fig.22,and impact angles given are relative to vertical(see Fig.5).The projectile impacting at 82.5°merely grazed the surface of the composite and completely rebounded at 0.7 μs.This rebound is confirmed by the approximately 1.25 km/s residual velocity of the 82.5°impact,which is shown as a plateau in Fig.23a.
Element distortion is observed in some cases.During penetration,elements must distort or erode.If distortion is too severe,the calculation becomes unstable and fails,but erosion prevents this by eroding elements under sufficient strain(where strain is a function of the change in element dimensions,so distortion).However,occasionally,an element may become distorted without meeting the erosion criteria.In this case,distorted elements retain no tensile strength and only a small fraction of strength under compression or shear(see Table 2 and related discussion).Therefore,these elements do not cause instability because they have minimal effect on contact force or stored energy.Additionally,distortion generally occurs only for elements around the sides of the penetrating projectile(not ahead)because these elements may not reach sufficient strain for erosion,but they have minimal effect on reducing projectile energy(primarily through frictional sliding),so element distortion has negligible effect on results.

Fig.19.Lateral penetration.Rigid body projectile dynamics during the penetration and indentation phases for(a)right circular cylindrical(RCC)projectile and(b)spherical projectile across a range of impact velocities,VI.
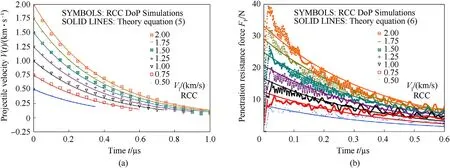
Fig.20.Comparison of theoretical model with RCC DoP simulation data.(a)Velocity versus time simulation data and theoretical model Eq.(5).(b)Penetration resistance force versus time and theoretical model Eq.(6).

Table 5Angle of obliquity,θ,with corresponding velocity components,VX and VZ,to achieve resultant velocity,VR.
Examination of Fig.22 shows that penetration depth and related damage is dominated by impacts with small obliquity,while surface erosion is dominated by impacts with large obliquity.The projectile impacting at 75°penetrated into the composite but rebounded.In the process of rebounding,the 75°projectile ejected some material and eroded a trough in the composite surface,which is seen in Fig.22.For the impact angles less than 75°,the projectile penetrated into and was eventually arrested by the composite.This arrest is demonstrated by Fig.24b,which shows only the 75°and 82.5°have non-zeroZ-component velocities later in time.Note that,for clarity,Zvelocity sign is shown opposite of Fig.5.
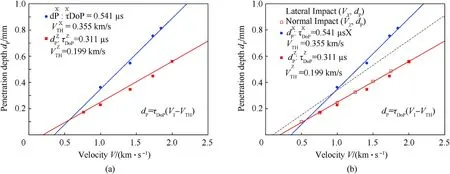
Fig.21.Oblique impact depth of penetration,dP,as a function of impact velocity.(a)The depths along X-and Z-axes(see Fig.5)are reported separately with X-and Z-components of impact velocity.(b)The through-thickness(normal)and lateral impact data are added.Normal data fits well with the normal component of oblique impact data(dZP),but lateral data does not fit well with the lateral component(dXP),for reasons described in the text.
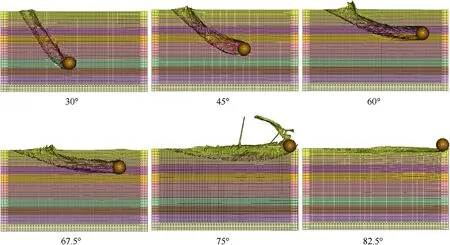
Fig.22.Cross-sections of microscale depth of penetration simulations with spherical projectile impacting at the indicated angles of obliquity.All simulations impacted with 2 km/s resultant velocity.
Resultant penetration force,FRP,is plotted in Fig.23b as a function of time and impact obliquity.Lateral(X-)and normal(Z-)components of velocity and force as functions of time and obliquity are provided in Figs.24 and 25 respectively.In Fig.24,the velocity is normalized by respective components of impact velocity(see Table 5).Penetration resistance force results are similar in amplitude for both lateral and through-thickness(normal)penetration components,but lateral penetration takes longer than throughthickness to reduce to zero force(and velocity).Finally,we can use Eq.(2)to calculate the impact force as a function of impact velocity.The data from Table 5 is used with Eq.(2)and plotted in Fig.26.
4.Summary

Fig.23.(a)Resultant projectile velocity of the spherical projectile over time as a function of angle of impact obliquity.(b)Resultant penetration resistance force on the spherical projectile over time as a function of angle of impact obliquity.
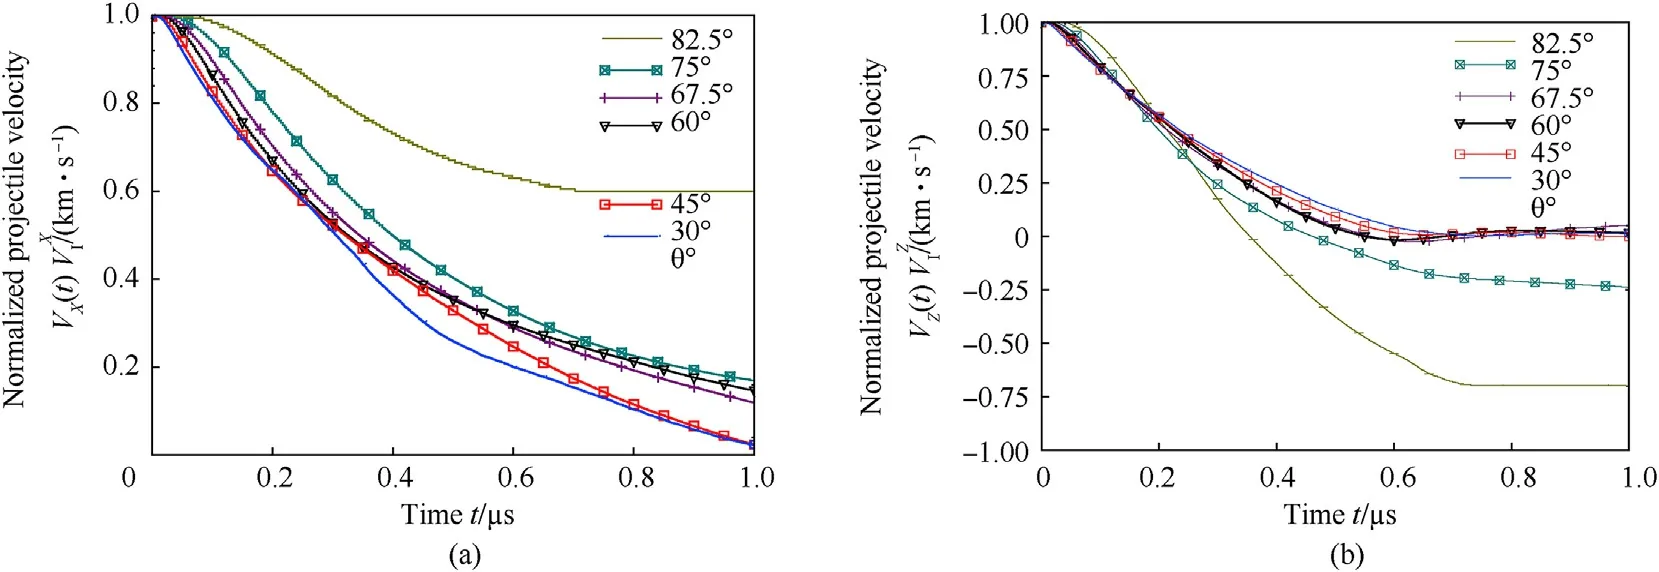
Fig.24.Normalized components of projectile velocity as a function of time for each obliquity.(a)X-component velocity,normalized by X-component of impact velocity.(b)Zcomponent velocity,normalized by Z-component of impact velocity.
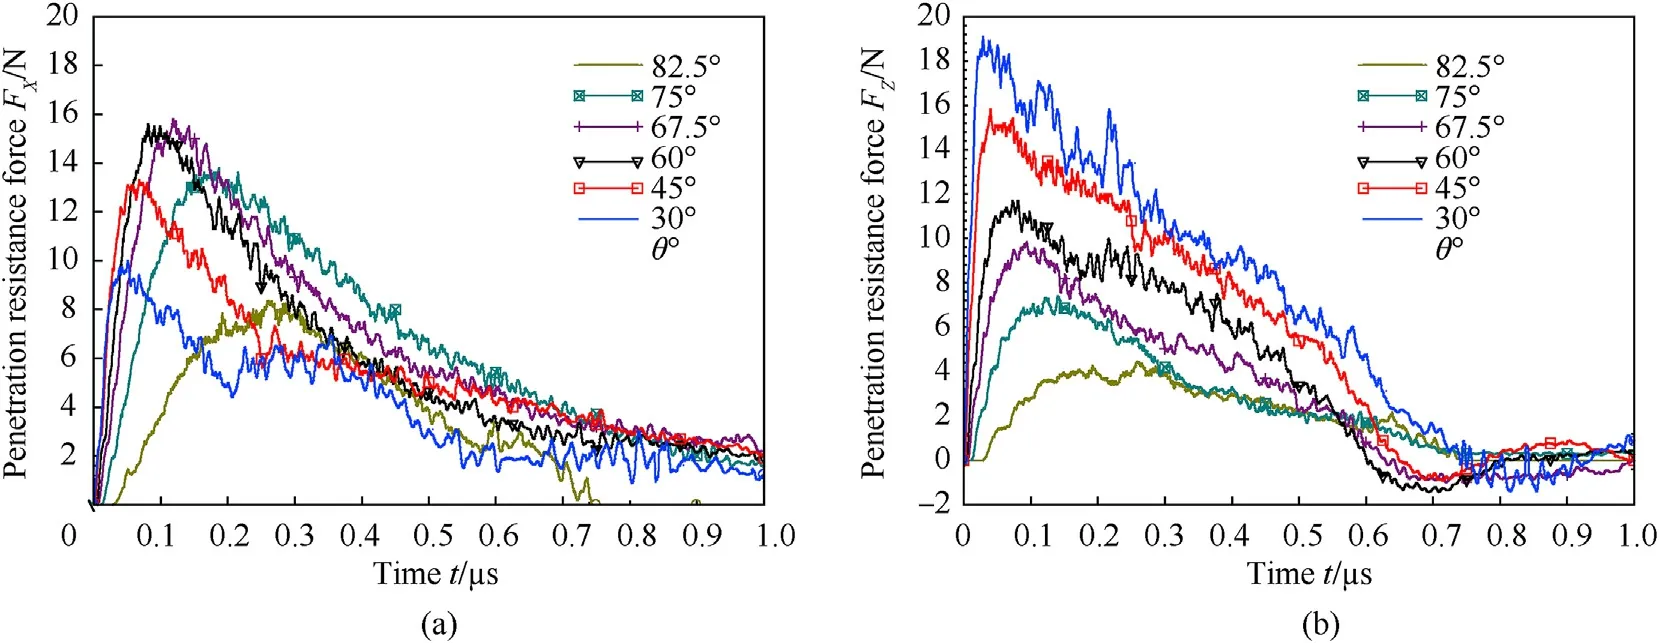
Fig.25.(a)X-component and(b)Z-component of penetration resistance force as a function of time for each obliquity.
In this work,we developed microscale finite element models of normal,lateral,and oblique impacts on multi-layered unidirectional composites.We paraphrased a theoretical model for a right circular cylinder impacting a multi-layered composite target at normal(through-thickness)and lateral directions relative to the laminas.This theoretical model was previously presented and experimentally validated in the literature.Using a modeling approach that had been validated in the literature,along with wellcharacterized material parameters,we simulated a cylinder and a sphere projectile impacting a multi-layered composite target normally and laterally to the layers.We showed that the theoretical model predictions match well the numerical model results for cylinder projectile velocity and penetration resistance force as functions of time.We demonstrated that the theoretical model can be used with depth of penetration measurements to give the profile of velocity and force.
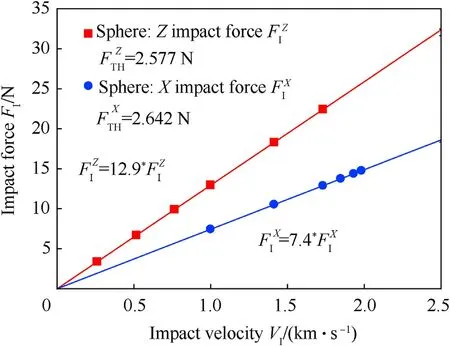
Fig.26.Oblique penetration of sphere.X and Z components of impact force,FI,as a function of impact velocity with linear fitting lines given by FI=VI(mP/τDoP)and threshold velocity given by FTH=VTH(mP/τDoP).
Using the theoretical model,we validated the simulations of a cylinder impacting normally and laterally.We used the same models to simulate normal and lateral impacts by a sphere.To study microscale,oblique,depth of penetration in multi-layered composites,we decomposed oblique sphere impacts into normal and lateral components and compared these components with normal and lateral simulation results.The numerical model shows that using normal and lateral depth of penetration simulations we can describe the penetration under oblique impact.With the theoretical model and decomposed oblique impact components,we can predict the response of composites under oblique impact in terms of depth of penetration as a function of impact velocity and velocity and penetration resistance force as functions of time.The numerical and theoretical models presented here are a first step in developing the capability to predict depth of penetration(DoP)for oblique,microscale,high-speed impact on composite materials.
Declaration of competing interest
The authors declare that they have no known competing financial interests or personal relationships that could have appeared to influence the work reported in this paper.
Acknowledgement
Research was largely conducted under the NASA EPSCoR RID Program,A Plan for NASA/EPSCoR Research Infrastructure Development in Delaware(NASA Award NNX15AK34A).Research was also sponsored in part by the U.S.Army Research Laboratory and was accomplished under Cooperative Agreement Number W911NF-12-2-0022 and W911NF-13-2-0027.This work was supported in part by funding from the U.S.Army Educational Outreach Program"s Undergraduate Research Apprentice Program,which funded an undergraduate student to gain research experience.The views and conclusions contained in this document are those of the authors and should not be interpreted as representing the official policies,either expressed or implied,of the U.S.Army Research Laboratory or the U.S.Government.The U.S.Government is authorized to reproduce and distribute reprints for Government purposes notwithstanding any copyright notation herein.
APPENDIX A.DEPTH OF PENETRATION ANALYSIS METHODOLOGY
The following paraphrases the energy-based theoretical model first presented by Haque and Gillespie[41].As described in the text and referring to Fig.6,consider a rigid,flat-nosed,right-circularcylindrical projectile impacting a semi-infinite target with impact velocityVI.The projectile has radiusrP,heightHP,massmP,and density ρP.The threshold impact velocity isVTH.Projectiles impacting the target with velocities less thanVTHwill rebound without penetrating into the target.Projectiles impacting the target with velocities greater thanVTHwill penetrate into the target to a depth ofdP.Projectile penetration into the target ceases when the instantaneous velocity of the projectile,˙z(t),equals the threshold velocity.Here,tis time,andtTHis the time when the instantaneous projectile velocity equals threshold velocity.During the penetration process,an instantaneous penetration resistance forceFP(t)acts on the projectile.This penetration resistance force is defined asFP(t)=πr2PpH(t),wherepH(t)is the hydrodynamic pressure of the highly compressed composite material in contact with and under the penetrating projectile.
From the principal of work and energy,the work of penetration(WDoP)can be expressed as

Here,WDoPis done from the time of impact(t=0)to the end of the penetration process,when the non-eroding projectile reaches the threshold velocity of penetration(t=tTH).In equation(A1),EIis the impact energy,andETHis the kinetic energy at threshold impact velocity.The work of penetration can also be expressed as

wherez(t)is the instantaneous location of the projectile,andFP(t)is the instantaneous penetration resistance force acting on the projectile.Favgis the integrated average penetration resistance force,and is defined as

Here,aavgis the integrated average acceleration of the projectile.Using Eq.(A1)to(A3),we can expressaavgin terms ofVI,VTH,anddPas

whereVavg=(VI+VTH)/2 is the average penetration velocity,τDoPis the characteristic time,aI=VI/τDoPis the initial acceleration at timet=0,andaTH=VTH/τDoPis the final acceleration at timet=tTH.The characteristic time τDoP,is defined as

The characteristic time,τDoP,and the threshold velocity of penetration,VTH,can be determined from DoP data using Eq.(A6).The unit of characteristic time can be expressed as[mm/(km/s)],which means that the projectile will penetrate the target by“τDoP“mm per km/s of differential impact velocity(i.e.,VI-VTH).
With Eq.(A4)we can express Eq.(A3)as

Here,FIis the initial penetration resistance force at timet=0,andFTHis the threshold penetration resistance force at timet=tTH.The initial penetration resistance force can be expressed as

Similarly,the threshold penetration resistance force can be expressed as

In Eqs.(A8)and(A9),cDoPis the damping coefficient of the DoP data,and has the unit N/(m/s)or kg/s.
From Eq.(A4)(i.e.,aavg=Vavg/τDoP),we can write a generalized expression for instantaneous acceleration of the projectile,

Integrating Eq.(A10),we get the instantaneous velocity of the projectile

Integrating Eq.(A11),we get the instantaneous displacement of the projectile

wherez0=VIτDoPis the characteristic displacement of the projectile.At timet=tTH,˙z(tTH)=VTH,and we can express this threshold time of penetration as

with Eq.(A11),we can express Eq.(A10)as

where¨z0=VI/τDoPis the characteristic acceleration of the projectile.Then the penetration resistance force acting on the projectile can be computed by

whereFP0=mp¨z0is the initial impact contact force given by

Using Eqs.(A11)and(A15)we can express penetration resistance force as

Fromand Eqs.(A15)and(A16),the instantaneous hydrodynamic pressure can be expressed as


Hence,for timet>tTH,the equation of motion for the rigid projectile is

and the velocity and displacement of the projectile are

During the dynamic indentation phase of penetration,the projectile is under constant deceleration according to Eq.(A20),and the projectile will reach zero velocity and rebound at timet=tR,which is given by

The total time of the indentation phase is
tIND=tR-tTH=τDoP(A24)
APPENDIX B:Relating lateral and oblique dop data.
The oblique impact data was split intoX-andZ-components.TheX-component of oblique DoP as a function of impact velocity was plotted and a line fit by Eq.(1).However,plotting the lateral impact DoP data relative to this line,it is seen that the lateral data does not fit with theX-component of oblique data.This discrepancy is due to differences in energy dissipation due to the sliding,rotation,and friction of oblique impact on a free surface versus the lack of sliding and rotation and greater friction surface area involved in confined lateral penetration.No rigorous proof has yet been determined to quantify this discrepancy in energy dissipation,but the following describes a correction to the lateral data that brings it in line with the oblique data.
Examining the data in Fig.21,it may be seen that the lateral DoP data can be rotated to fit the oblique data line.Eq.(1)can be rearranged intoAx+By+C=0 form to give equation(B1),whereVis velocity,dPis depth of penetration,are the characteristic time of depth of penetration and threshold impact velocity for the lateral data,respectively.

IfMis a nonsingular,projective transformation matrix,the transformed line is given by 1M-1.For a clockwise rotation φ about an arbitrary point(V0,dP0),M-1is given by Eq.(B2).

The rotation angle relating the lateral data to theX-component of the oblique data is given by Eq.(B3),


Then multiplying Eq.(B4)by(V,dP,1)Tproduces a linear equation.

Referring to Fig.21b and taking the rotation point as(V0,dP0)=(1,0.36),and considering the values of the constants,given earlier,the transformed equation may be expressed in terms of these constants as

The lateral depth of penetration data cannot be shifted since it was the output of the lateral simulations.Thus,the lateral DoP data can be plugged into Eq.(B6)and the data will be transformed to align with the X-component of the oblique data.This is shown in Fig.B1.
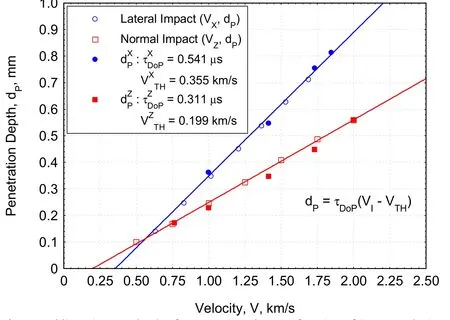
Fig.B1.Oblique impact depth of penetration,dP,as a function of impact velocity.Lateral impact data is transformed to align with the X-component of oblique data.
杂志排行
Defence Technology的其它文章
- Modified couple stress and thickness-stretching included formulation of a sandwich micro shell subjected to electro-magnetic load resting on elastic foundation
- Recent advances in the synthesis and energetic properties of potassium-based potential green primary explosives
- A quasi-isentropic model of a cylinder driven by aluminized explosives based on characteristic line analysis
- Kevlar fabric reinforced polybenzoxazine composites filled with silane treated microcrystalline cellulose in the interlayers:The next generation of multi-layered armor panels
- Experimental study on the cavity evolution and liquid spurt of hydrodynamic ram
- Preparation of ammonium nitrate-based solid composite propellants supplemented with polyurethane/nitrocellulose blends binder and their thermal decomposition behavior
