Study on time-varying seismic vulnerability and analysis of ECC-RC composite piers using high strength reinforcement bars in offshore environment
2022-10-19LiangYanZhaoFulinLuoJunandChenPei
Liang Yan ,Zhao Fulin ,Luo Jun and Chen Pei
1.College of Civil Engineering,Zhengzhou University,Zhengzhou 450001,China
2.College of Mechanics and Safety Engineering,Zhengzhou University,Zhengzhou 450001,China
3.Wuhan Building Material Industry Design &Research Co.,Ltd,Wuhan 430000,China
Abstract: As the main seismic component of a bridge,seismic damage to the bridge pier has a greater effect on its subsequent service.In the offshore chloride environment,the issues (e.g.,reinforcement bar corrosion and attenuation of concrete strength) of piers caused by chloride ion seriously curtail the normal service life and deteriorate the anti-seismic property of bridge structures.The engineered cementitious composite (ECC)-reinforced concrete (RC) composite pier with high strength reinforcement bars (HSRB) is expected to solve the above problems.This study aims to clarify the time-varying seismic vulnerability (SV) of the HSRBECC-RC composite pier during its full life cycle (FLC).Based on OpenSees,the refined finite element analysis models of RC pier,ECC-RC composite pier,and HSRBECC-RC composite pier have been established.Moreover,using the nonlinear time-path dynamic analysis method,the influence of chloride ion erosion on the time-dependent seismic vulnerability (SV) of these different piers in different service life and different peak ground acceleration (PGA) were analyzed from a dynamic point of view.The research shows that the exceeding probability (EP)of the same damage level increases with the enhancement of service time and PGA and with the increase of destruction,the exceeding probability (EP) of slight damage (DL-1),moderate damage (DL-2),serious damage (DL-3),and complete collapse (DL-4) decreases in turn;the corrosion degree of chloride ion to piers is small during the early service period,the time-varying vulnerability curve of the bridge piers is almost the same as that of a new bridge,and during later service,as the extent of chloride ion corrosion deepens,exceeding probability (EP) under severe damage (DL-3) and complete collapse(DL-4) is increased,and the seismic performance is significantly enhanced.
Keywords: bridge piers;engineered cementitious composite (ECC);high strength reinforcement bars (HSRB);seismic vulnerability (SV);exceeding probability (EP);full life cycle (FLC)
1 Introduction
With the progress of society,large-scale construction of offshore and cross-sea bridges is increasing in China.In the process of long-term service of bridges in an offshore environment that pertains to the infiltrating chloride erosion environment,problems such as structural corrosion and mechanical property degradation of materials are serious,which lead to the durability damage to bridge structures and the anti-seismic property of bridges attenuate by degrees.The bridge pier is one of the most core ductile energy-consuming components of the bridge against earthquakes,and its seismic property has a great influence on the entire bridge.Reinforced concrete (RC) piers are more prone to damage than other members in the bridge,and failure of piers will cause collision damage to the superstructure of the bridge and may even cause the entire bridge to collapse(Zhouet al.,2012).Therefore,the seismic design and reinforcement of the pier structure is crucial.In the offshore environment,the issues (e.g.,reinforcement bar corrosion and decrease of concrete strength) of piers caused by chloride ions seriously curtail the normal service time and deteriorate the anti-seismic property of structures.To solve the above problems,measures such as changing the form of the pier section or increasing the reinforcement ratio are usually used to augment the energy dissipation capacity of the pier.This kind of efficiencyincreasing behavior at the bridge structure level not only has a limited degree of improvement in its seismic performance but also greatly increases the difficulty and cost of construction.At present,using high-performance materials and high-strength reinforcement bars to replace ordinary concrete and reinforcement bars in bridges can effectively improve the energy dissipation and self-reset performance during earthquakes (Maet al.2020;Guanet al.2018) and this has become a major research direction.Engineered cementitious composite (ECC) is a highperformance fiber-reinforced cementitious composite(HPFRCC) designed based on micro-mechanics;Li designed it in the 1990s by deliberately tailoring the matrix,fiber,and fiber/matrix interface based on the micromechanics theory (Zhanget al.,2019,2020a).Despite the high ductility of ECC,which enables the structure to have good energy dissipation and self-reset capabilities (Zhanget al.,2020b),it has a higher cost when compared with ordinary concrete.Therefore,the ECC is only used in the plastic hinge area of the pier.In addition,using high-strength reinforcement bars as a substitute for ordinary steel bars can further improve the anti-seismic property of the piers (Wanget al.,2015).Consequently,the ECC-RC composite pier with high strength reinforcement bars (HSRB) is expected to solve the above problems.
Based on the development of performance-based anti-seismic conceptual design,RC structures are often subjected to seismic hazard probabilistic assessments,and the deterministic design criteria for specific sites are gradually transitioning to the development of vulnerability curves based on the level of structural behavior required to describe the structural needs and responses.Therefore,this study evaluates the antiseismic property of bridge piers by analyzing their seismic vulnerability (SV).Corrosion of steel bars in RC structures is a common,natural phenomenon that can accelerate the deterioration of a structure,which is being studied by many scholars.Specifically,based on OpenSees,Liet al.(2016) discussed the impact of chloride ion erosion on the diameter and yield strength of reinforcements in piers.They evaluated chloride ion erosion on the anti-seismic property of piers through moment-curvature analysis on the pier section.To consider chloride ion erosion,Ghosh and Sood (2016),through the moment-curvature analysis of the column section,they evaluated the vulnerability of a bridge using the time-varying curvature ductility requirement ratio and compared the original and time-varying limit state vulnerability curves.Afsar Dizajet al.(2018) evaluated the SV of RC columns and predicted the time-varying bearing capacity of corroded rectangular RC columns using a nonlinear frame model.The above research indicates that the durability damage to RC structures in the offshore environment during service has become a problem that cannot be ignored.Some researchers have proposed using ECC and high strength rebar to replace ordinary concrete and rebar in the plastic hinge zones of RC structures.For example,Choet al.(2018) substituted ordinary concrete with HPFRCCs in the plastic hinge zones of the RC column,which not only improved ductility but also diminished cracks in the critical flexural zones of the RC column.Xuet al.(2017) discussed the mechanical behavior of ECC and ECC-RC composite columns.They pointed out that ECC and ECC-RC composite columns have superior deformation capacity,superior energy absorption capacity and slower stiffness degradation than RC columns.Qinet al.(2020) studied the flexural behavior of reinforced concrete beams reinforced with high strength and high ductility ECC(HSHD-ECC).They found that RC beams reinforced with ECC layers can not only improve the cracking,yield and ultimate load of RC beams but also improve the deformation and energy absorption capacity.Geet al.(2016) studied the flexural mechanical behavior of ECC-RC composite beams with HSRB.They found that the yield and ultimate bending moment after cracking of ECC increased with the increase of the reinforcement ratio and strength,but the stiffness remained basically unchanged.Although the investigations can help to understand the seismic performance of HSRBECC-RC composite piers,there are many differences between these members and the HSRBECC-RC composite piers.There are limited studies on the evolution law of the seismic capacity of this new composite pier structure during its full life cycle (FLC).
This study aims to evaluate the seismic capacity of HSRBECC-RC composite piers in the FLC by analyzing the time-varying SV of the piers.Based on OpenSees,the finite element analysis models of the RC pier,ECCRC composite pier and HSRBECC-RC composite pier are established to analyze the influence of chloride ion erosion on the time-varying SV of different piers under different service times and different peak ground motion accelerations in the FLC.The time-dependent SV curves and surfaces of different piers under minor damage,medium damage,severe damage,and complete collapse are built by selecting a logical durability damage index that studies the time-varying SV of bridge structures.Finally,the anti-seismic property of HSRBECC-RC composite piers can be analyzed and evaluated.
2 Finite element modeling
2.1 Bridge pier analysis model
In this study,the middle span 7# pier of a threespan (40 m+60 m+40 m) continuous rigid-frame bridge located in the offshore environment of China is selected.The pier has a height of 11.80 m,and C50 concrete is used.The stirrups and longitudinal steel bars of the pier are made of HRB400 rebar with diameters of 16 mm and 32 mm,respectively,and the concrete cover is 40 mm.The bridge pier foundation structure adopts a rigid expanded foundation.The site category is class II.The site fortification intensity is 7°,and the structural design service time is 100 years.
Based on OpenSees,the nonlinear analysis model of the example pier is established.The ordinary concrete and reinforcement is substituted with the ECC and HSRB in the pier plastic hinge areas to obtain the composite piers model.The 3D finite element model of bridge piers is shown in Fig.1.The nonlinear fiber beam-column element is used in the finite element analysis model to simulate the plastic deformation of bridge piers (Chenget al.,2019).In the OpenSees software simulation,considering the ferrule effect of stirrups,concrete can be divided into constrained concrete and unconstrained concrete.Moreover,this study divides the crosssection of the pier by refining separate fiber division to meet accuracy requirements,as shown in Fig.2.The confined concrete area is divided into 2691 fibers,the unconstrained concrete area is divided into 208 fibers,and the longitudinal reinforcement is divided into 172 fibers according to the geometric location.

Fig.1 3D finite element model of bridge piers: (a) RC pier (b) ECC-RC composite pier,and (c) HSRBECC-RC composite pier

Fig.2 Fiber section of pier
Through the analysis of forced displacement,the translational constraint forceFand the rotation angle constraint forceMof the main girder at the pier roof on the longitudinal plane of the bridge are obtained.ThenFandMare applied to the pier roof to simulate the influence of the bridge superstructure on the bridge pier.Moreover,the diagram of the boundary constraint between the main girder and the pier roof is shown in Fig.3,and the zero-length element is used to simulate the restraint effect of the main girder on the pier roof in OpenSees.
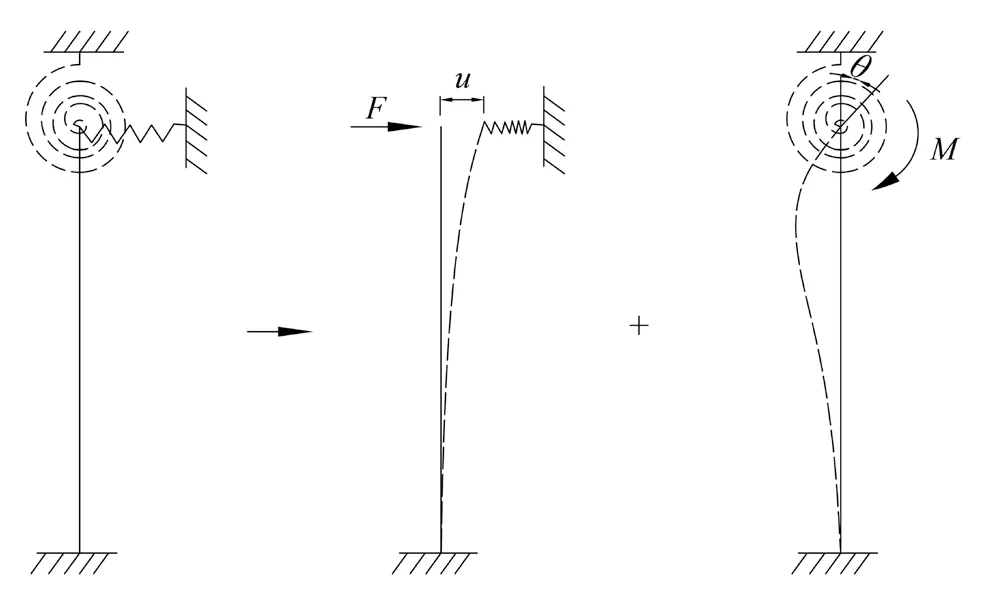
Fig.3 Boundary constraint on pier top
2.2 Material constitutive model
2.2.1 Concrete and reinforcement constitutive model
The plastic hinge rotation ability of the pier is the main index to evaluate its ductility.Due to the restraint effect of stirrups,the ultimate strain of confined concrete in the core area is higher than that of unconstrained concrete,thus enhancing the ductility of bridge piers.Therefore,it is necessary to consider the concrete of the protective layer separately from the concrete of the core area.In this study,the Concrete02 model is used to simulate the unconstrained and confined concrete.Based on the Kent-Park concrete constitutive model modified by Scottet al.(1982),the stress-strain relationship is shown in Fig.4.The constitutive model can be expressed by Eq.(1),and the elastic modulusEc,the axial compressive strengthfckand the axial tensile strengthftkof C50 concrete are 34.5 GPa,32.4 MPa mpa and 2.65 MPa,respectively.The reinforcement constitutive adopts the steel02 material constitutive based on the uniaxial isotropic strengthening Giuffre-Menegotto-Pinto (Calado and Brito,2002),and the stress-strain curve is shown in Fig.5.The constitutive equation can be expressed by Eq.(5),and the elastic modulusEs,the yield strengthfsd,and the strain hardening coefficientbof HRB 400 are 20 GPa,400 MPa,and 0.01,respectively,and the elastic modulusEs,the yield strengthfsd,and the strain hardening coefficientbof high-strength reinforcement bar are 20 GPa,785 MPa,and 0.01,respectively.
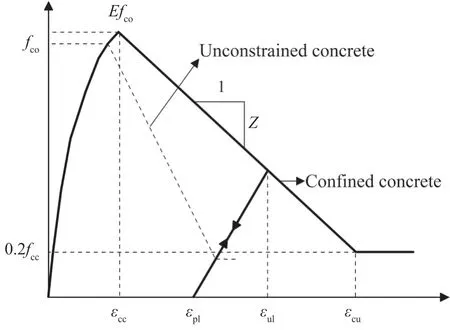
Fig.4 Stress-strain relationship of concrete
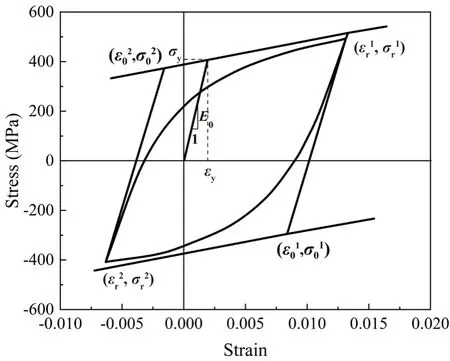
Fig.5 Steel02 material constitutive model
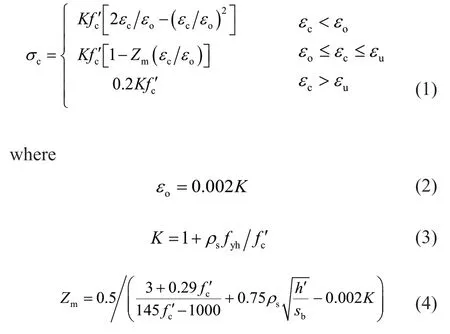
whereKis the concrete strength increasing coefficient caused by stirrup restraint.εois the peak strain.Zmis the slope of the stress-strain softening section under compression.is the compressive strength of the concrete cylinder.fyhis the yield strength of the stirrup.ρsis the volume stirrup ratio.h′is the width of core confined concrete calculated from the outer edge of the stirrup.sbis the stirrup spacing,andεuis the ultimate compressive strain of concrete,andεu=0.004+0.9ρs(fyh-300).

whereσ*andε*are the stresses and strains of steel bars,respectively.bis the strain hardening coefficient,andRis the parameter considering the Bauschinger effect.
2.2.2 ECC constitutive model
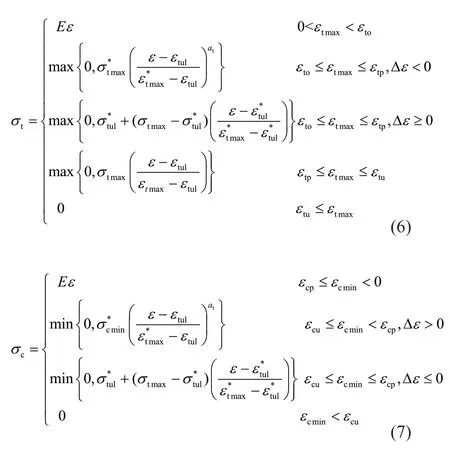
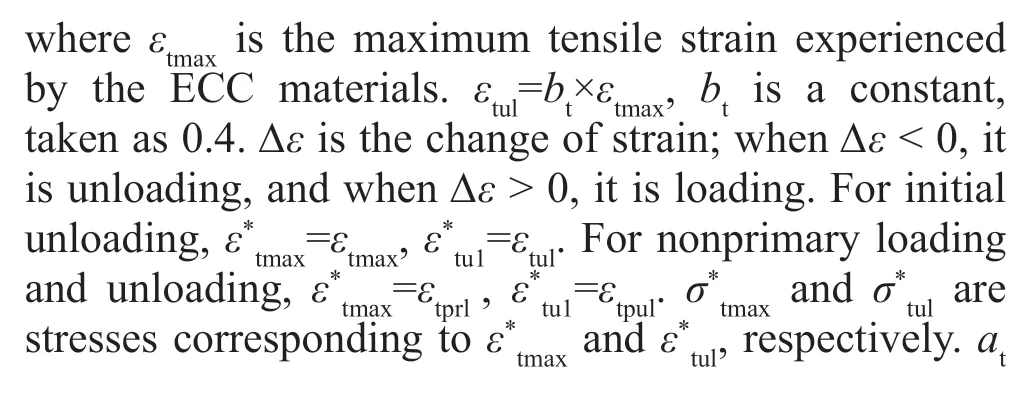
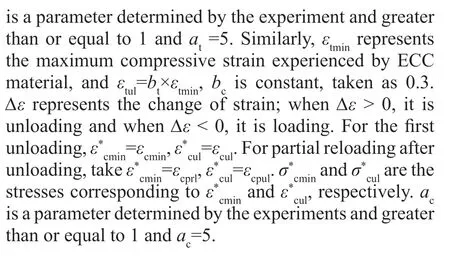
At present,there are few studies on the hysteretic constitutive relationship of ECC material under cyclic loading.According to the test results of Kesner and Billington (2004),Hanet al.(2003) proposed a tensile and compression hysteretic constitutive model of ECC material based on the total strain model,and its constitutive equation can be expressed by Eqs.(6)-(7).The ECC01 constitutive model,which considers the loading-unloading criterion in the OpenSees database,is used to simulate the ECC material.The constitutive model of ECC material is shown in Fig.6.The mechanical parameters of the ECC used herein are obtained from the test data from Deng and Zhang (2017).The elastic modulusE,the axial compressive strengthfc,the axial tensile strengthftand the strain hardening coefficientbof ECC with 2% fiber volume content used in the pier are 40 GPa,60.35 MPa,6.12 MPa,and 0.03,respectively.The tensile and compressive stress-strain curves of ECC are shown in Fig.7.Combined with Eqs.(6) and (7),the ECC01 material constitutive model used to simulate ECC materials in the OpenSees can be obtained.

Fig.6 Constitutive model of ECC material
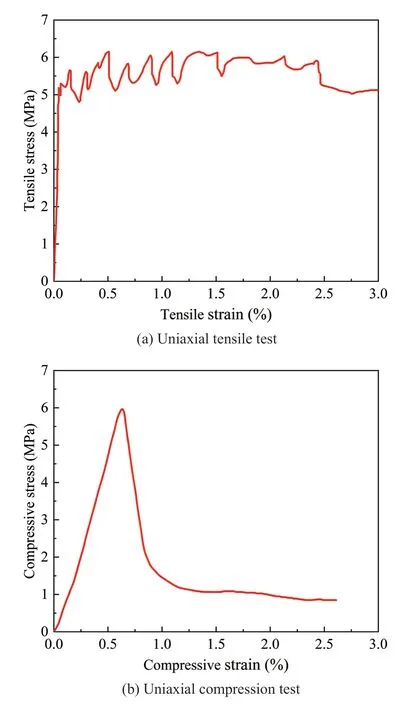
Fig.7 Stress-strain curves of uniaxial tensile/compression tests
2.3 Corroded steel bars mechanical properties
The marine environment is filled with a large number of chloride ions,and the bridge structures in it will be more or less eroded by them.Therefore,based on the structural material characteristics,the thickness of the cover and the site conditions,the time when the rebar begins to rust and the corrosion rate of the rebar can be estimated.Through Eqs.(8)-(20) (Lianget al.,2019,2020),the mechanical parameters of corroded reinforcement in the example bridge piers can be obtained.Then,the time-varying damage results in the durability of reinforcement bars in the FLC of the bridge pier can be obtained,as shown in Fig.8.
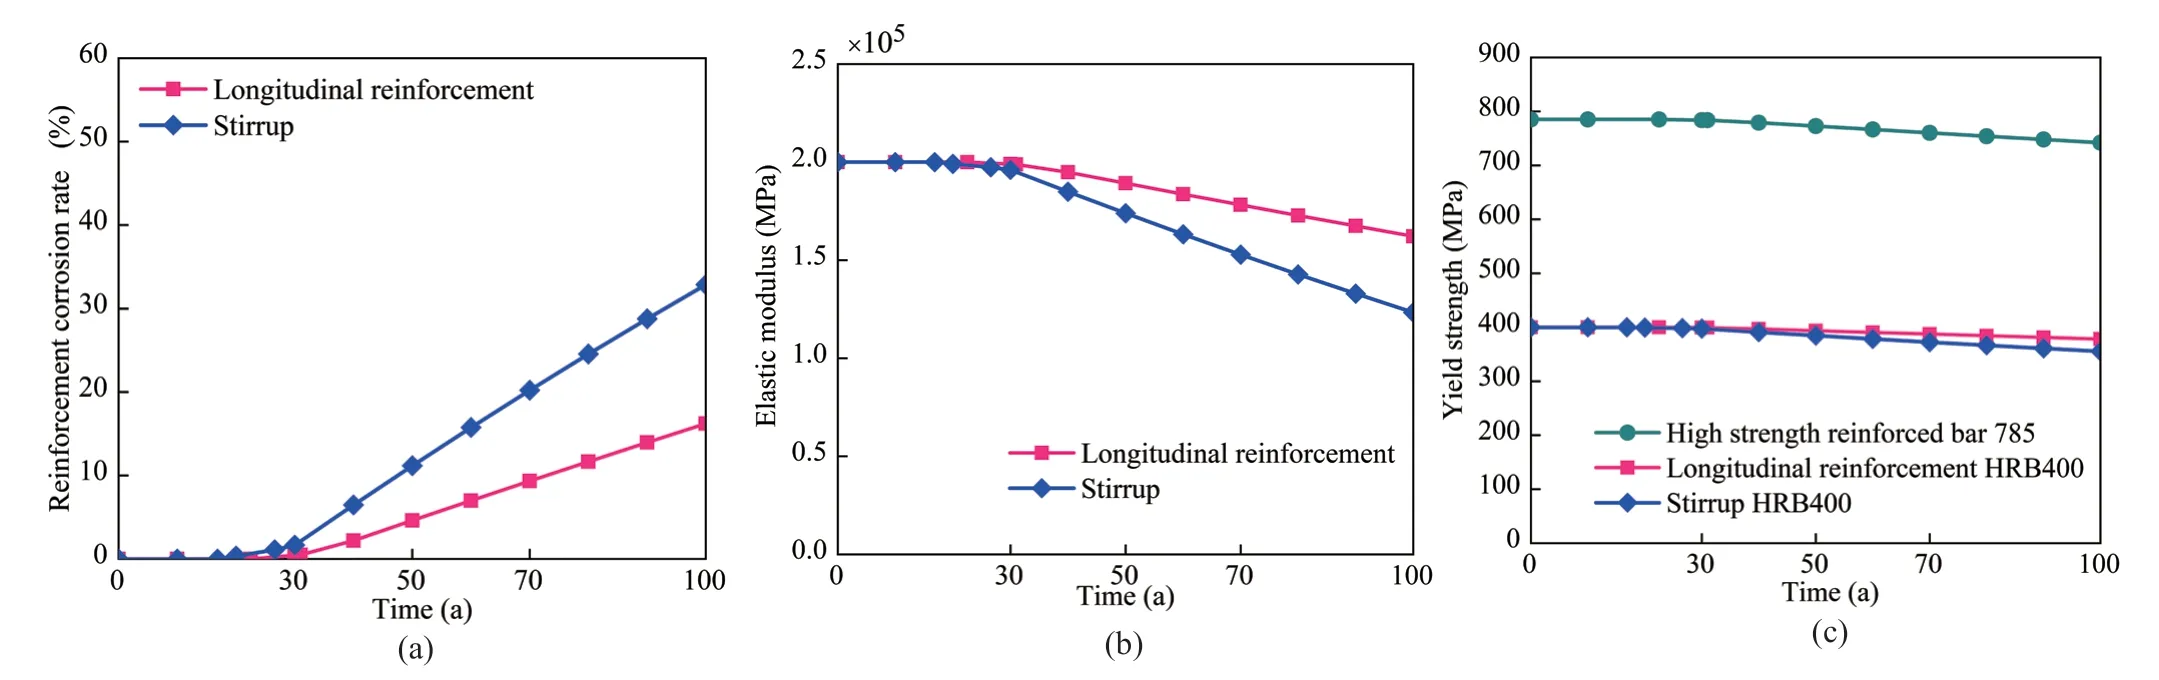
Fig.8 Time-varying damage to reinforcement bars durability: (a) reinforcement corrosion rate;(b) elastic modulus of reinforcement;and (c) yield strength of steel bars
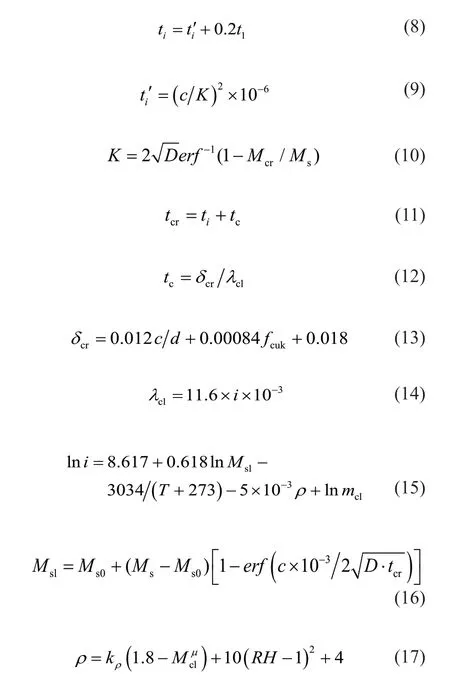
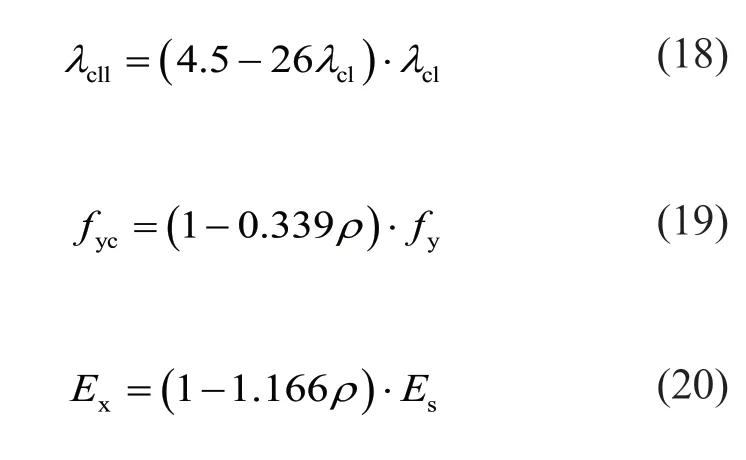
whereti(a) is the rust time of the rebar in the offshore environment.ti′ (a) is the rust time of the rebar without considering the chloride ion diffusion coefficient.t1(a) is the time for the chloride ions to reach a stable value on the surface of the concrete.c(mm) is the concrete cover thickness.K(mm) is the coefficient of chloride erosion.tcr(a) is the time that the concrete cover rust dilates and cracks.tc(a) is the time from the rebars rusting to the concrete cover dilating and cracking.δcr(mm) is the rebars critical rust depth when the concrete cover cracks.λcl(mm/a) is the rebar annual average rust rate before concrete cover cracking.d(mm) is the diameter of the rebar.fcuk(MPa) is the concrete compressive strength standard value.i(μA/cm2) is the rebar rust current density.Msl(kg/m3) is the concentration of chloride ion on the rebars surface.T(℃) is the ambient temperature of the structure.ρ(kΩ·cm) is the concrete resistivity.mclis the partial environmental impact coefficient.Ms0(kg/m3) is the amount of chloride ion already present in the concrete when it is prepared.Ms(kg/m3) is the chloride ion concentration on the concrete surface.Dis the effective chloride ion diffusion coefficient.kρis coefficient,Mclμ(kg/m3) is the mean concentration of chloride ion in the concrete cover.RHis the ambient relative humidity.λcll(mm/a) is the average annual rust rate of rebar after cracking of the concrete cover,whenλcll<λcl,takeλcll=1.8λcl.fycandExare the carbonized concrete yield strength and elastic modulus.fyandEsare the concrete initial yield strength and elastic modulus.
2.4 Test verification
2.4.1 Verification of repeated loading test of the RC column and reinforced ECC columns
The repeated loading test results of RC column and reinforced ECC (RE-i,i=1,2) columns in Zhanget al.(2019) were compared and analyzed.The schematic drawing of the specimen is shown in Fig.9.The column section size is 250 mm × 250 mm.The column is poured vertically over the foundation beam (length × width ×height: 450 mm × 450 mm × 1200 mm).The height of the column is 600 mm (475 mm),and the distance from the loading point to the top face of the foundation beam is 500 mm (375 mm).The reinforcement bars embedded in specimens are of grade HRB400,which has a nominal yield strength of 400 MPa.The diameters of the longitudinal reinforcement bars and stirrups are 22 mm and 8 mm,respectively.On the top of the column,the longitudinal reinforcement bars bend 135°,hooked with a length of 100 mm.The space between the stirrups of reinforced concrete columns and RE columns is 80 mm.The column adopts a 2% high-strength PVA fiber reinforced cement mortar.The compressive strength and the tensile strength of the column are 65.80 MPa and 5.38 MPa,respectively.The compressive strength of the ordinary concrete of the base is 68.70 MPa.The yield strength of the stirrup is 320 MPa,and the yield strength of the longitudinal reinforcement is 440 MPa.The pressure at the top of the column is 515.6 kN and set the axial compression ratio to 0.2.Related design parameters are shown in Table 1.The loading mode adopts load-displacement mixed loading.In the force control phase,the lateral load increment is 20 kN until the steel bar yields for the first time.After the specimen yields,it is loaded with a displacement control cycle.The displacement step length increment is 3 mm,where n is the displacement step length,and each displacement step repeats three cycles until the end of the test.The experiment was carried out at Xi′an University of Architecture and Technology.The loading mode is shown in Fig.10,and the failure modes of the columns are shown in Fig.11.
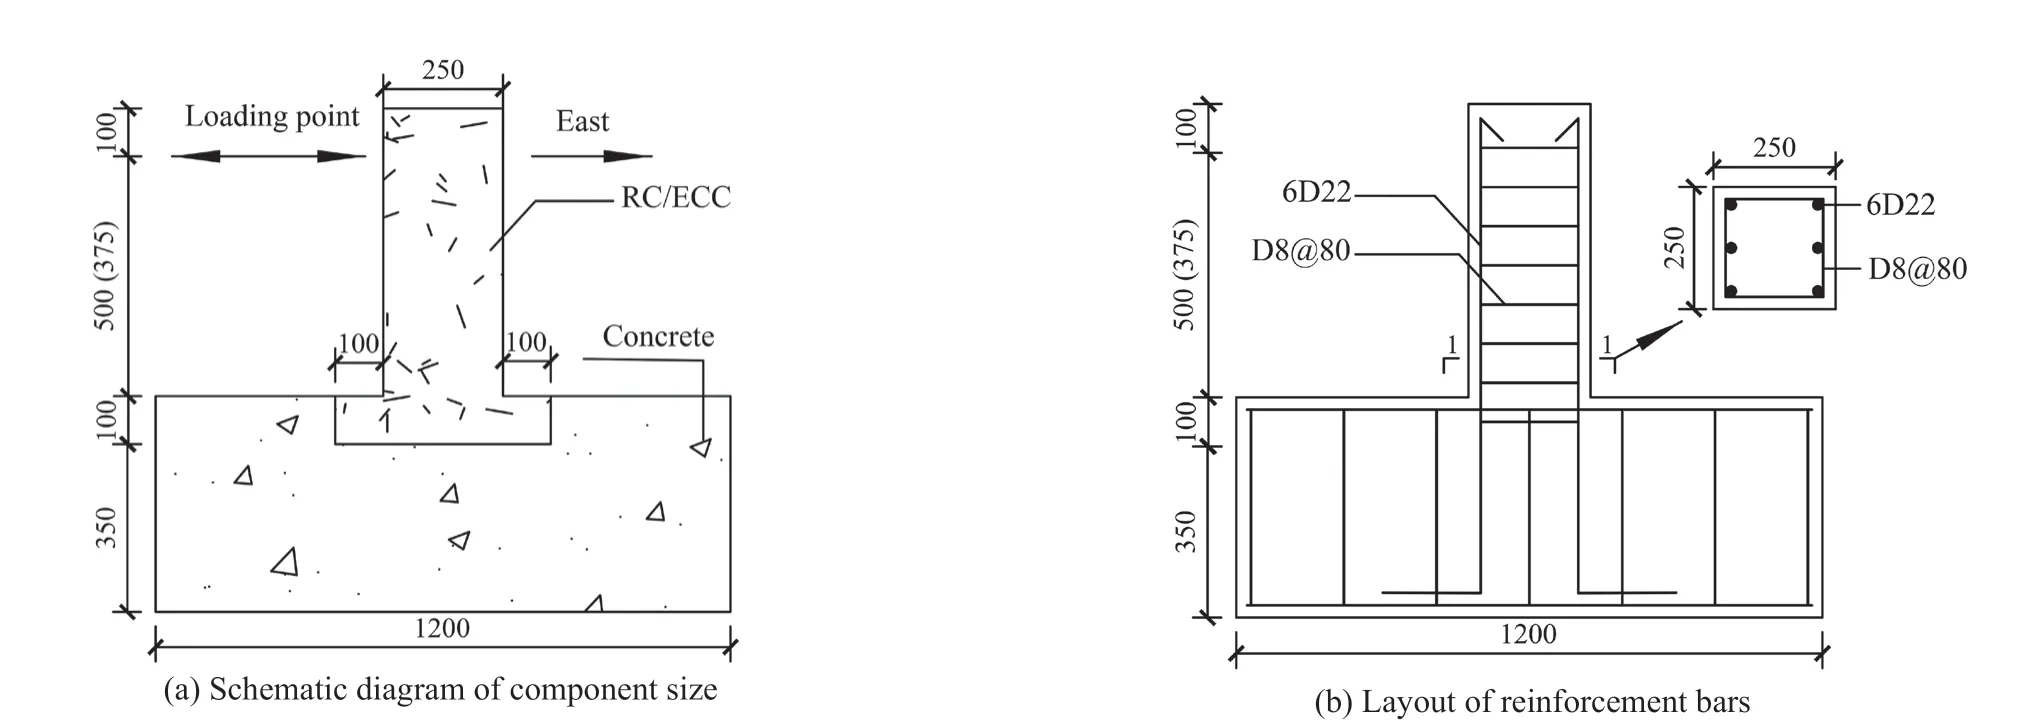
Fig.9 Schematic drawing of the specimen (unit: mm)
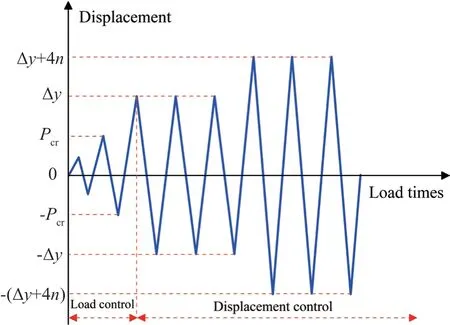
Fig.10 Loading mode

Fig.11 Final failure patterns

Table 1 Specimen parameters
In the modeling process,the ECC constitutive relationship adopts the ECC01 constitutive model,the concrete adopts the Concrete02 model,and the steel bar constitutive model adopts steel02 material constitutive.The element type adopts a displacement-based beamcolumn element.To verify the validity of the finite element model,the finite element simulation results are compared with the results of low-cycle repeated loading tests of RC column and RE columns (Zhanget al.,2019).The comparison between the numerical simulation values and the experimental values of the skeleton curve is shown in Fig.12.
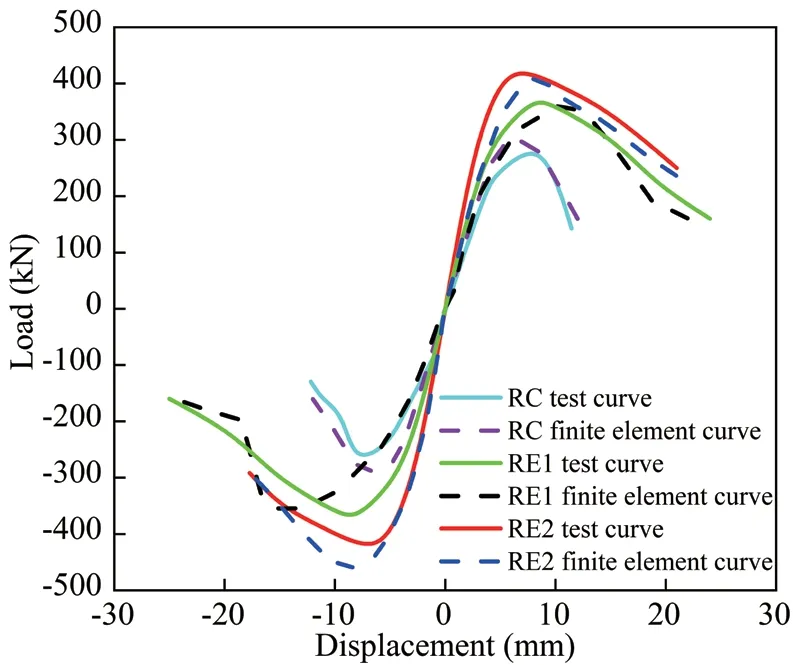
Fig.12 Skeleton curve comparison
Compared with the RC column,the ultimate load and failure load of specimens RE-1 and RE-2 are significantlyincreased,and the ductility is also increased.Adopting ECC instead of concrete can significantly improve the bearing capacity and ductility of members and further improve the anti-seismic property of the structure.Figure 12 shows that the numerical simulation value of the skeleton curve is in accord with the experimental value,which illustrates the feasibility of modelling methods.
2.4.2 Verification of low-cycle repeated loading test of corroded RC columns
The results of the repeated loading test of the RC column with durability damage in Xia (2014) were compared and analyzed.The schematic diagram of the specimen dimensions and reinforcement is shown in Fig.13.The RC column is made of C40 concrete,and the cover thickness is 20 mm.The axial compressive strength is 32.10 MPa,and the elastic modulus is 33092.40 MPa.The yield strength of the stirrup and longitudinal reinforcement is 390 MPa and 525 MPa,respectively,and the axial compression ratio is set as 0.4.The loading mode adopts a load-displacement mixed loading style,as shown in Fig.14,and the lateral load increment is 15 kN in the force control stage until the steel bar yields.A total of eight specimens were fabricated,and the relevant parameters are shown in Table 2.Among them,Z1 is the comparison specimen;Z2,Z3,and Z4 are the longitudinal reinforcement corrosion specimens;Z5-Z8 are the stirrup corrosion specimens.The test was completed in the civil engineering laboratory of Central South University.The final failure patterns of the Z1,Z2 and Z6 specimens are shown in Fig.15.
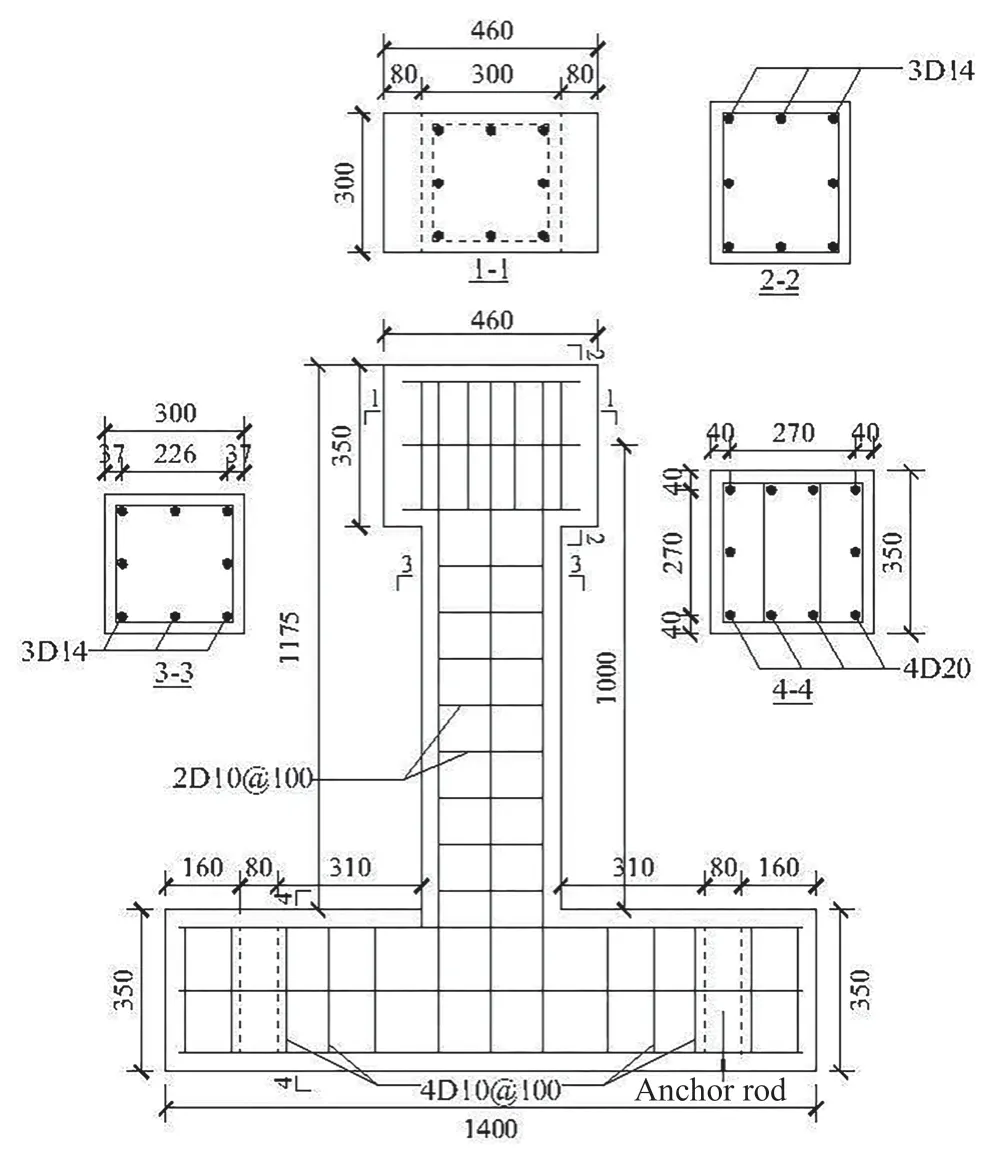
Fig.13 Reinforcement diagram of specimen size (unit: mm)
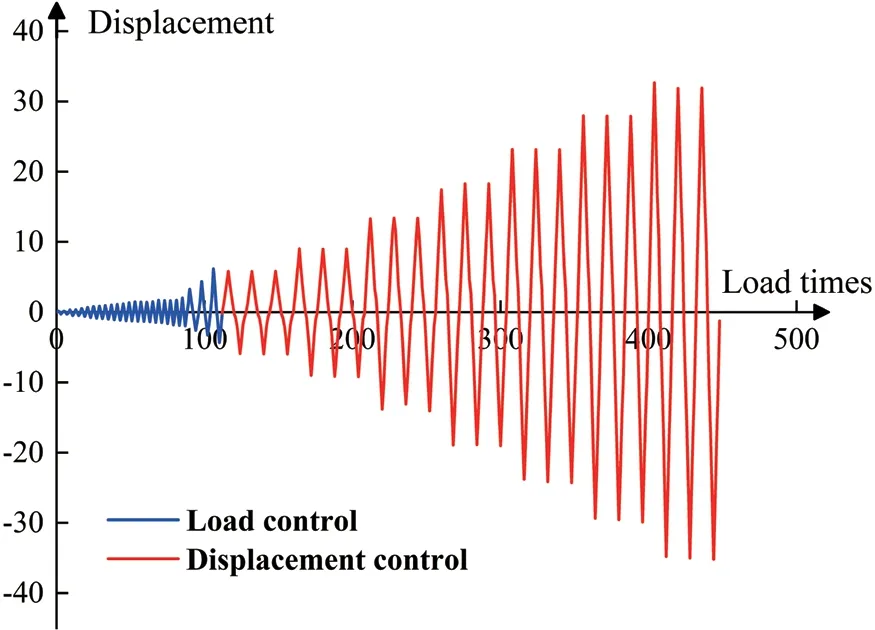
Fig.14 Loading mode

Fig.15 Test final failure patterns
In the modelling process,the concrete adopts the Concrete02 model.The steel bar constitutive model adopts steel02 material constitutive.The unit type adopts a displacement-based beam-column element.To certify the validity of the finite element model,the finite element simulation results are compared with the results of low-cycle loading tests of RC columns (Xia,2014).The comparison between the simulated value of the hysteresis curve and the experimental value is shown in Fig.16.
It can be seen from Fig.16 that the experimental value of the hysteretic curve is basically consistent with the simulated value.The reverse loading values of the hysteretic curve are basically consistent with the simulated values except for Z8,but there are some differences between the forward loading values and the simulated values,especially in the aspects of initial stiffness and ultimate bearing capacity.This point is also illustrated by the comparison between the experimental values of skeleton curves of some columns (Z1,Z2,and Z6) and the numerical simulation results,as shown in Fig.17.The main reasons for these differences are as follows: Firstly,compared with the finite element analysis method,the initial geometric deformation occurred during the actual loading of the test,resulting in the difference in initial stiffness.Secondly,there are some differences between the constitutive of the material obtained from the test and the finite element analysis method,which is mainly because the material in the model has no detailed damage.In contrast,the actual material has detailed damage.In addition,when the cover thickness of the plastic hinge area falls off in the tests,there will be slippage between the reinforcement bars and concrete,and the section is not in an ideal state,which will cause the ultimate bearing capacity of the finite element simulation to be larger than the test value.Of course,there is also the impact of fabrication errors of the specimen.In summary,the hysteresis curve of the finite element simulation can still be used for the simulation of the bridge pier mentioned above,and the analysis result is biased to safety.

Fig.16 Specimen finite element simulation and test hysteresis curve

Fig.17 Skeleton curves of some columns
3 Analysis of SV of piers
3.1 Selection of ground motion
According to conceptual design theory based on seismic performance,the target response spectrum of 7°fortification is generated according to the site conditions.Ten measured seismic actions fit for the bridge site are selected as the original seismic waves of nonlinear dynamic analysis of the pier in the database of Pacific Earthquake Engineering Research Center (PEER),and amplitude modulation generates 150 seismic waves.The selected natural seismic waves are shown in Table 3.
3.2 Determination of damage index
The damage index is not only a basis for seismic fragility analysis of structures but also an index for quantitative analysis of different damage levels of structures.Under seismic excitation,bridge piers usually tend to bend.In this study,the displacement ductility ratio proposed by Hwanget al.(2001) is adopted to define the damage state.According to this damage index,the HAZUS99 (1999) report divides the damage to the bridge pier into five grades: basically intact (DL-0),minor damage (DL-1),medium damage (DL-2),serious damage (DL-3) and complete collapse (DL-4),as shown in Table 4.
Based on theX-TRACT,according to the shape and size of the pier section,material characteristics,steel corrosion rate,axial compression ratio and other parameters,the bending moment-curvature curve of the pier section can be equivalent to the ideal elastic-plastic double broken line bending moment-curvature curve,as shown in Fig.18.From this,the calculation results of the pier damage index (curvature) with a service time of 0-year,30-year,50-year,70-year and 100-year can be obtained.The curvature damage indexes of bridge piers with a service life of 0 years are shown in Table 5.
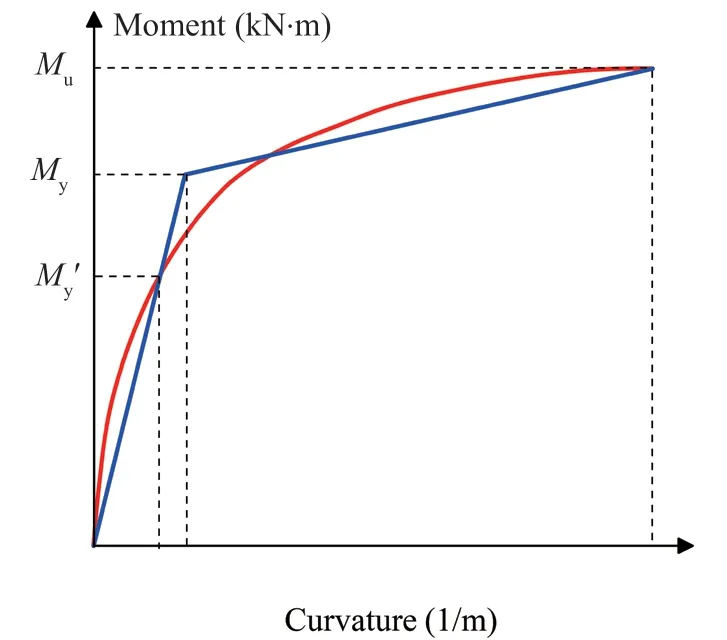
Fig.18 Equivalent M-φ curve
The example pier is a rigid frame pier in this study,sothe reverse bending point is assumed to be at the midpoint of the height of the pier.The calculation formula of the ductility ratio of the pier relative displacement is shown in Eq.(21) (Lianget al.,2020).Hence,the damage indexes of the piers under different damage levels can be obtained by Eq.(21),as shown in Table 6.
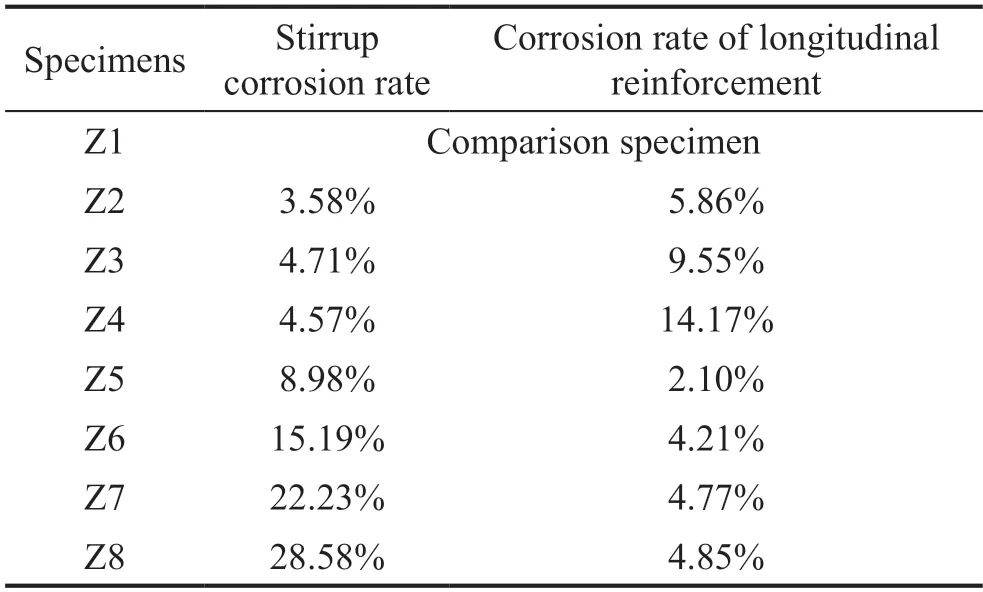
Table 2 Corrosion rate of reinforcements of specimens
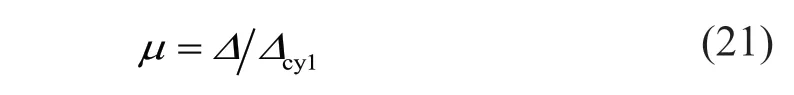
whereΔis the pier top relative displacement under earthquake excitation;andΔcy1is the pier top relative displacement when the longitudinal reinforcement first yields.
3.3 Analysis of fragility curves of piers
Based on the results of the nonlinear time-path analysis,a log-linear regression analysis was performed on 150 ground motion intensities of various piers and displacement ductility ratio data of corresponding seismic responses,as shown in Table 7.By substituting the probabilistic demand fitting formula into the SV formula as Eq.(22),the exceeding probability (EP)of each damage state under different ground vibration levels of bridge piers can be obtained.The SV curves of different damage levels (DL-i,i=1,2,3,4) are obtained,as shown in Fig.19.In addition,this study only takes the data of the control section at the bottom of the pier to obtain the time-varying SV of three piers to evaluate the anti-seismic property of the pier.
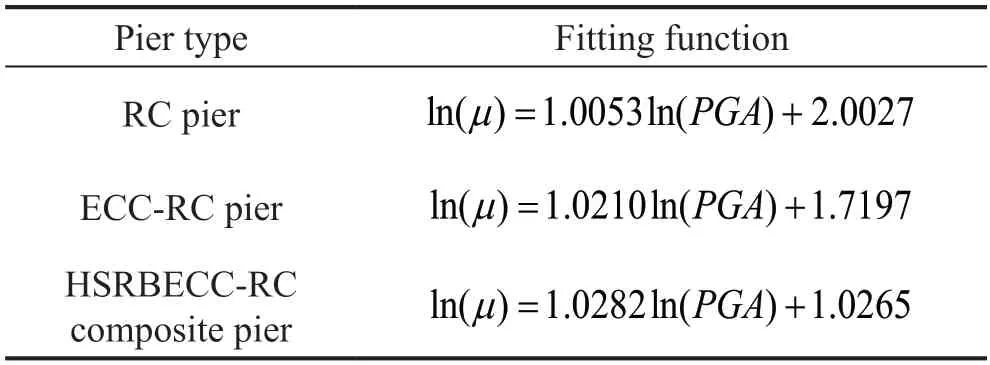
Table 7 Probability demand fitting formula for seismic response of different types of bridge piers
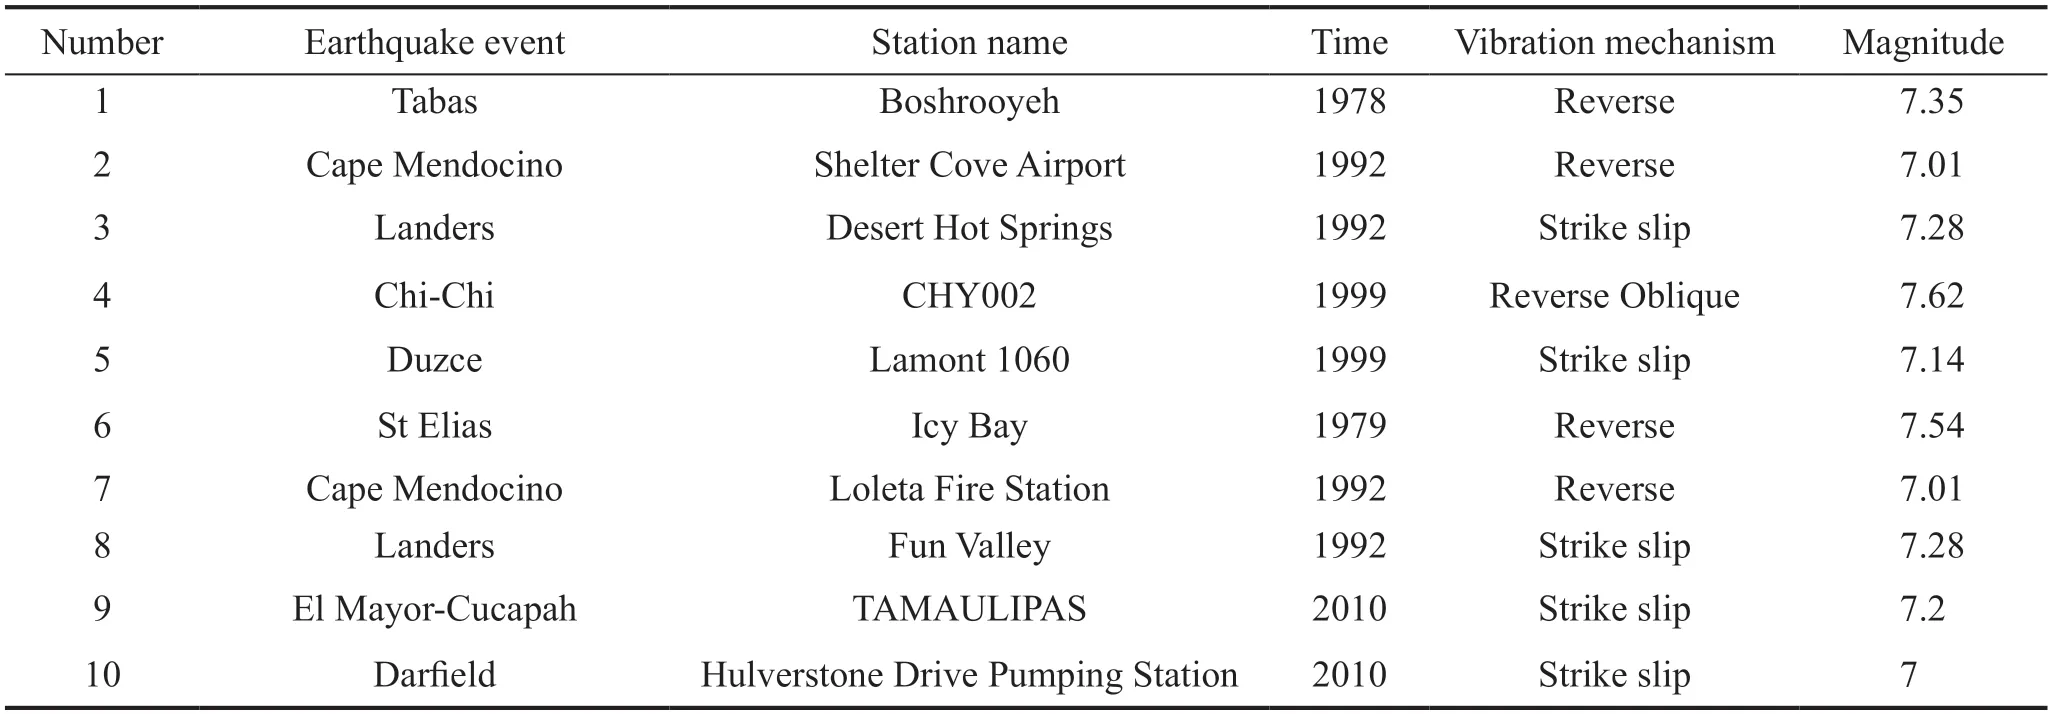
Table 3 Primitive seismic wave information

Table 4 Damage index of pier
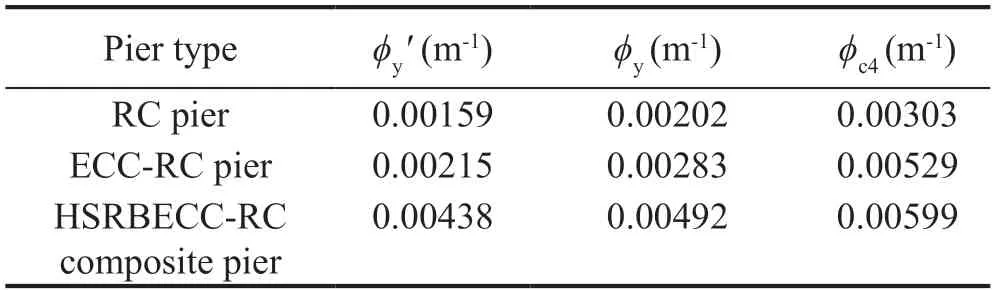
Table 5 Damage index of the bottom section of piers

Table 6 Pier damage index
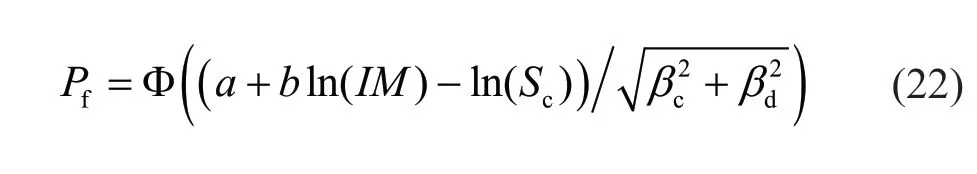
whereIMis the ground motion magnitude index,which characterizes the intensity of the earthquake.Scis the seismic capacity of the member.Φ(.) is the standard normal function.βcandβdare the logarithmic standard deviations of the seismic capacity and seismic demand,respectively.aandbare logarithmic fitting coefficients,which can be decided based on regression analysis.
Figure 19 shows the SV curves of the bottom control sections of three piers under the four damage levels.The EP of three piers under different damage levels gradually augmented with the PGA increase in the design period of 100 years.The EP of RC pier and ECC-RC composite pier under the DL-1 and DL-2 is slightly greater than that of the HSRBECC-RC composite pier.In the DL-3 and DL-4,the EP of RC pier and ECC-RC composite pier is obviously greater than that of the HSRBECC-RC composite pier.The above analysis shows that using ECC materials and HSRB to replace ordinary concrete and reinforcement bars in bridges can effectively improve the energy dissipation and ductility of the pier during earthquakes,which reduces the EP of the pier under four damage levels.
3.4 Evolution analysis of the exceedance probability of piers
The variation laws of the EP of various types of piers are separately drawn in a three-dimensional coordinate system that shows the variation law of EP along with the ground motion intensity and different types of piers under different damage levels when the bridge is completed,as shown in Fig.20.
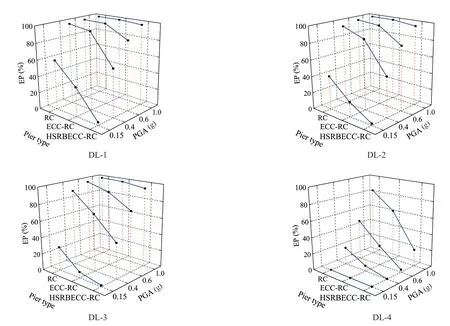
Fig.20 EP of the new piers at different levels of damage
Figure 20 shows that when the PGA is constant,the EP of the three piers gradually decreases as the damage levels increase,and with the increase in the and earthquake intensity,the EP of the piers under different damage levels also increases within the design life of the bridge pier in 100 years.The use of high-performance materials can significantly diminish the pier′s failure probability.Among them,the HSRBECC-RC composite pier has the largest reduction,followed by the ECC-RC composite pier and RC pier.Figure 21 presents a comparison of the RC pier,the variation law of the relative reduction percentage of the pier′s EP under different damage levels of the ECC-RC composite pier,and HSRBECCRC composite pier.It shows that when the PGA is constant,the relative reduction percentage of the pier′s EP is gradually enhanced as the damage conditions of the pier worsen in the FLC.When the damage level is the same,the relative reduction percentage of the pier′s EP gradually attenuates with the increase of PGA.When PGA ≤ 0.15 g,for the HSRBECC-RC composite pier,the relative reduction percentage of the pier′s EP is over 93.77%.The relative reduction percentage of the ECC-RC composite pier′s EP is over 40.71%.When PGA≥0.4 g,and the damage levels are DL-i(i=1,2 and 3),the relative reduction percentage of the pier′s EP does not significantly change.However,the change is more obvious when the damage level is DL-4.
4 Time-varying SV surface and curve analysis of bridge piers
4.1 Time-varying SV surfaces analysis
The time-varying SV surfaces of three piers under four damage levels are obtained through the SV analysis with the service life of 0,30,70 and 100 years.Furthermore,the SV surfaces of the control sections of three piers can be separately drawn in a threedimensional coordinate system that shows the variation law of the EP of piers along with the ground motion intensity and service time under different damage grades,as shown in Fig.22.
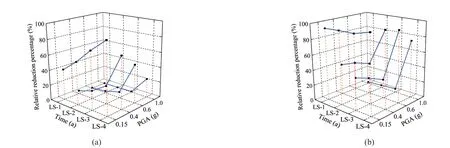
Fig.21 Compared with RC pier,the variation law of the EP of piers at different levels of damage: (a) ECC-RC composite pier;and(b) HSRBECC-RC composite pier
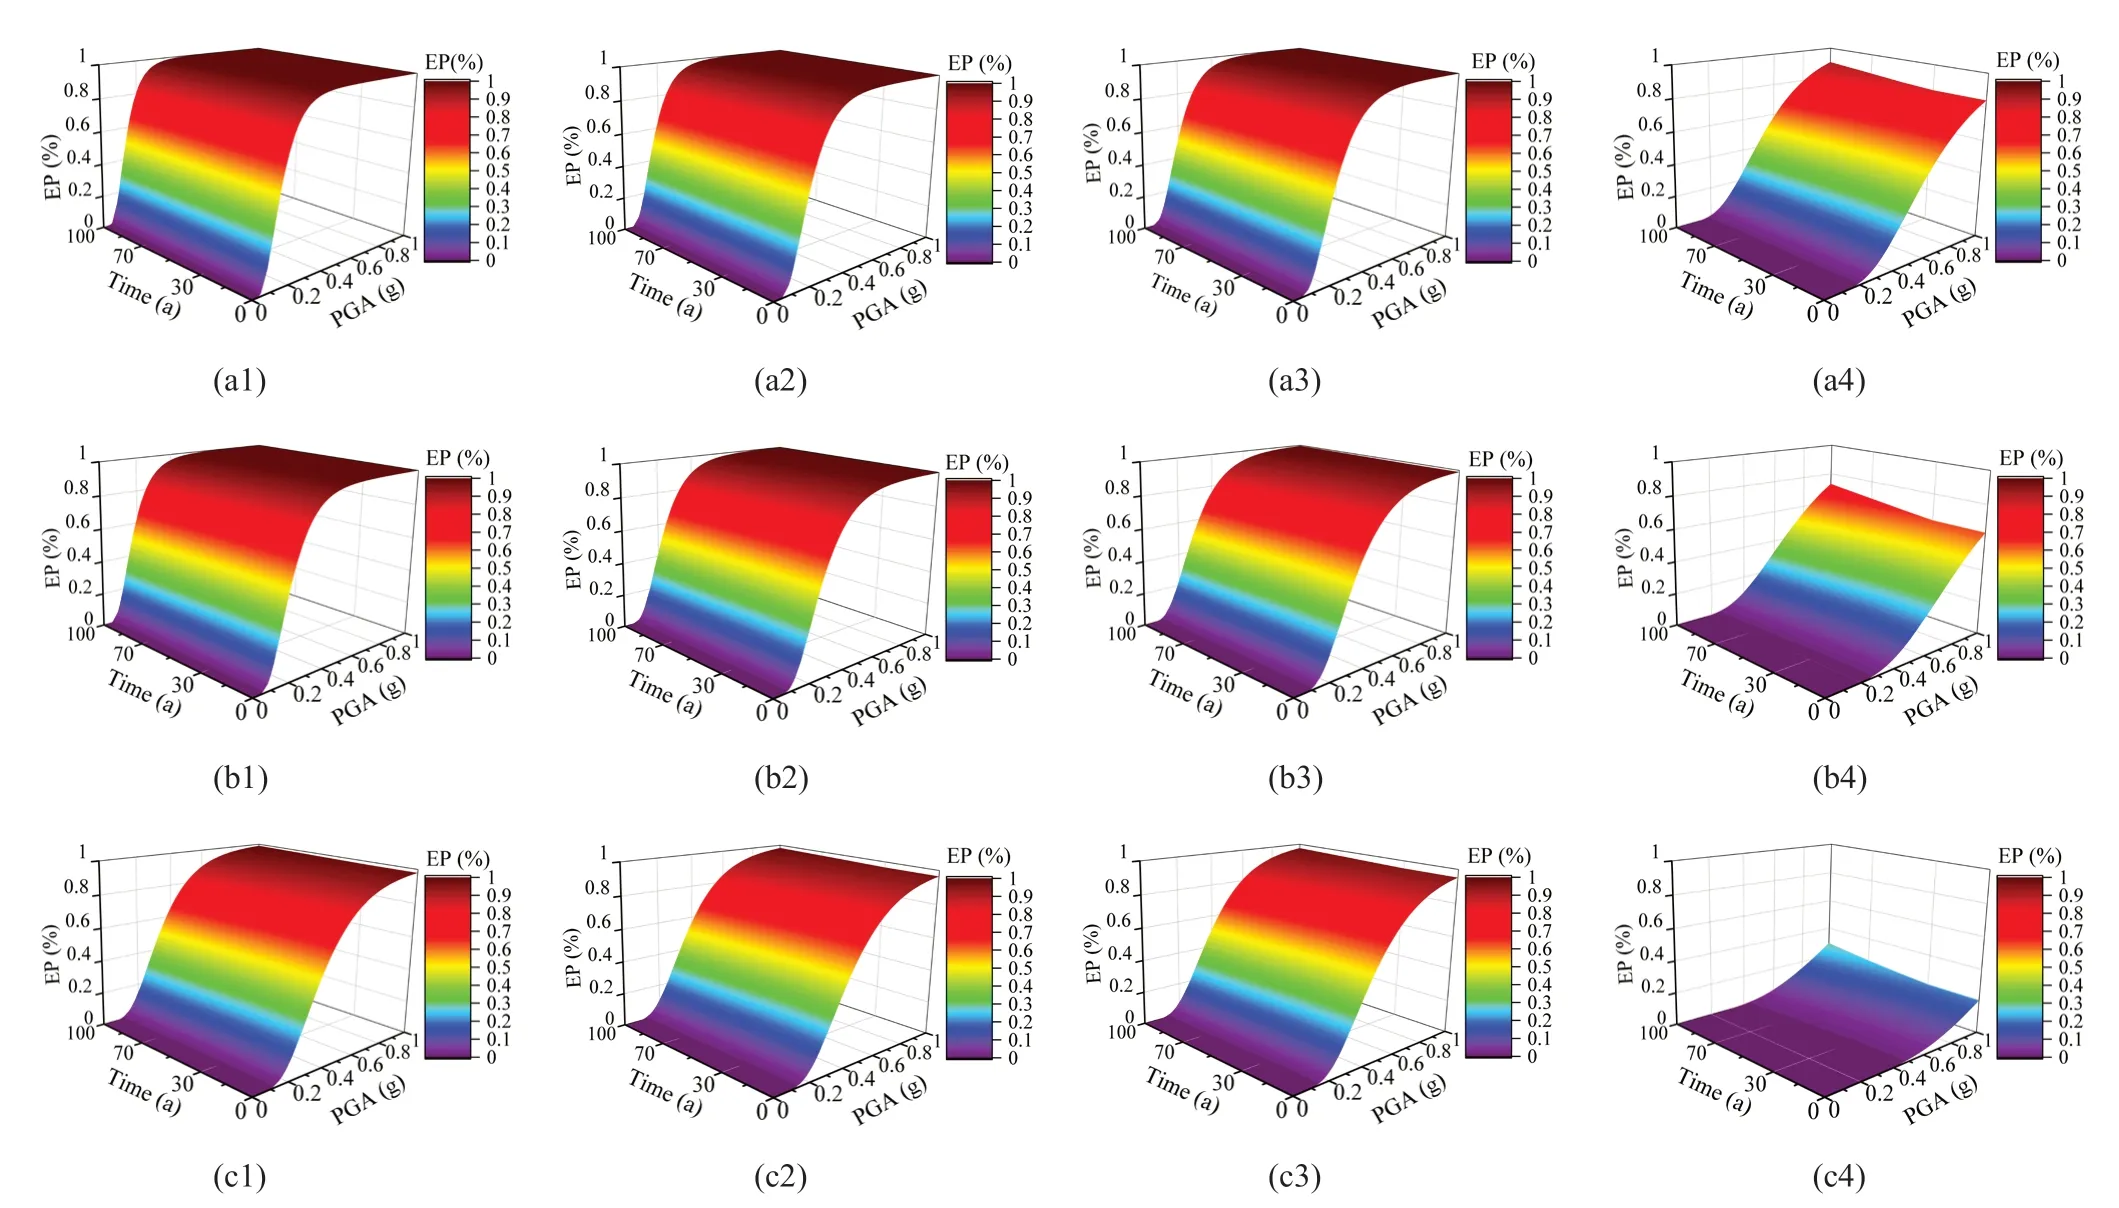
Fig.22 SV surfaces of different types of piers under different damage levels: (a) RC pier;(b) ECC-RC pier;and (c) HSRBECC-RC composite pier
Figure 22 shows that the SV surfaces of three piers under four damage levels increase along with the PGA and the service time.During the same time of service,the EP of the piers increases with the augmented PGA and the SV surfaces of the HSRBECC-RC composite pier is the lowest,the SV surfaces of the ECC-RC composite pier is the next,and the SV surfaces of the RC pier is the highest.The EP of the piers under four damage conditions in the prime 30-year is less than that in the anaphase 70-year that because the initial rust time of the hoop reinforcement and the longitudinal reinforcement is about the 16th and the 22th years,respectively,which shows that the corrosion of the steel bar is the primary factor affecting the anti-seismic property of bridge piers in service.The main reason is that the corrosion rate of the pier structure by chloride ion is deepened in the offshore environment,which leads to the attenuation of reinforcement strength,and concrete cracking.In addition,the bond-slip between reinforcement bars and concrete is increasingly more obvious,which lessens the synergistic effect of steel bars and concrete.Furthermore,the displacement of the top of the pier is further enhanced,and the seismic resistance of the structure is seriously weakened,which brings about further enlargement of the EP of piers.
4.2 Time-varying SV curve analysis of bridge piers
The time-varying SV curves of three piers with different service times under different damage levels are drawn in a two-dimensional Cartesian coordinate system to compare the time-varying SV evolution law of the three piers.The 0-year,30-year,50-year,70-year and 100-year EP of piers with PGA of 0.15 g,0.4 g,0.6 g and 1.0 g are shown in Fig.23.
Figure 23 shows that under seismic excitation,the EP of the piers increases with the service time and PGA under four damage levels.In the first thirty years,the time-varying SV curves of the piers are almost the same as that of the new bridge because the steel bars begin to corrode when it is nearly 30 years old.It is normal that the failure probability of the bridge pier in the FLC is not obvious at the initial service stage,especially when the PGA and damage state is low,as shown in Fig.23(ai),(bi),(ci) (i=1,2).For different types of bridge piers,the differences between the failure probabilities during their FLC are obvious.The HSRBECC-RC composite pier has the lowest damage probability,followed by ECCRC composite piers and RC piers.In addition,as the service time increases,the failure probability increases as the corrosion gradually enlarges,and the difference in failure probability of the piers is obvious in their FLC.In particular,when the PGA and damage degree are high,the difference in failure probability is more obvious,as shown in Fig.23(a4),(b4) and (c4).

Fig.23 Time-varying SV curves of bridge piers at different levels of damage: (a) RC pier;(b)ECC-RC pier;and (c) HSRBECC-RC composite pier
Figure 24 shows a comparison of the completed bridge,with the variation law of the relative EP of the three piers in DL-4 during different service periods.It shows that for high-performance material composite piers,when the PGA is constant,the relative EP of the piers gradually augments with the increase of service years.In specific service time,the relative EP of piers gradually damping with the enlargement of the PGA.Due to the small corrosion degree of reinforcement over the 30-year service period,the variation law of the relative EP of the pier does not significantly change and is below 2.08%.The variation of the relative EP of the high-performance material composite piers in service 100 years changed significantly and is above 15.41%.The above analysis shows that under the effect of chloride ion erosion in the offshore environment,the failure probability of bridge piers becomes greater with the increase of service years.The main reason is that in the offshore environment,the diameter and yield strength of rebars are obviously decreased by the deepening of the corrosion level.The concrete protective layer has spalled at this time,which makes the aseismic capacity of the pier obviously degenerate and increases the seismic hazard of the bridge pier in the later period of service,especially for DL-4.

Fig.24 Compared with the completed bridge,the variation law of the relative probability of exceeding of three piers in the DL-4:(a) RC pier;(b) ECC-RC composite pier;(c) HSRBECC-RC composite pier
5 Conclusion
In this study,based on the OpenSees system,the refined finite element analysis models of the RC pier,ECC-RC composite pier and HSRBECC-RC composite pier were established when the bridge was completed and over the service life of 30-year,50-year,70-year and 100-year,respectively.Considering the influence of material performance degradation caused by chloride ion erosion in the offshore environment,the nonlinear time-path dynamic analysis method was carried out to study the seismic capacity of HSRBECC-RC composite piers.Three conclusions can be drawn:
(1) The EP of the RC pier and ECC-RC composite pier under DL-1 and DL-2 is slightly greater than that of the HSRBECC-RC composite pier.In DL-3 and DL-4,the EP of RC pier and ECC-RC composite pier is obviously greater than that of the HSRBECC-RC composite pier.This means that using ECC materials and HSRB to replace ordinary concrete and reinforcement bars in bridges can effectively improve the energy dissipation and ductility of the pier during earthquakes,which attenuates the EP of the pier under four damage levels.
(2) Regardless of the state of damage,the EP of the HSRBECC-RC composite pier is the lowest,the ECC-RC composite pier is the next,and the RC pier is the highest.The decline of the EP of piers is primarily attributed to the ECC and HSRB applied in plastic hinge zones,which causes the energy dissipation and ductility of the piers to be enhanced.
(3) Considering the influence of material performance degradation caused by chloride ion erosion,the timevarying SV surfaces or curves of different piers under the four damage levels are enhanced along with the PGA and the service time in the offshore environment.Since the initial rusting time of the stirrups and longitudinal reinforcement of the pier is 16-years and 22-years,respectively,the EP of the pier in the first 30 years of service is very close to that of the new bridge in the four damage levels,but the EP of the pier increases significantly in the 70 and 100 years of service,which shows that corrosion of the steel bar is the primary factor affecting the anti-seismic property of the piers.In future aseismic design of offshore bridges,corrosion is an important problem that needs attention.
Acknowledgment
This work was supported by the National Natural Science Foundation of China (Grant No.51608488);China Postdoctoral Science Foundation (2020M672277);and the Scientific and Technological Project of Henan province,China (192102210185).
杂志排行

Earthquake Engineering and Engineering Vibration的其它文章
- Innovative mitigation method for buried pipelines crossing faults
- Reliability and sensitivity analysis of wedge stability in the abutments of an arch dam using artificial neural network
- Optimization of design parameters for controlled rocking steel braced dual-frames
- Seismic response of selective pallet racks isolated with friction pendulum bearing system
- Effects of timber infill walls on the seismic behavior of traditional Chinese timber frames
- Steel rings as seismic fuses for enhancing ductility of cross braced frames