Reliability and sensitivity analysis of wedge stability in the abutments of an arch dam using artificial neural network
2022-10-19HasanMostafaeiFarhadBehnamfarandMohammadAlembagheri
Hasan Mostafaei ,Farhad Behnamfar and Mohammad Alembagheri
1.Department of Civil Engineering,Isfahan University of Technology,Isfahan 84156-83111,Iran
2.Department of Civil and Environmental Engineering,Tarbiat Modares University,Tehran 11155-9313,Iran
Abstract: In this study,the seismic stability of arch dam abutments is investigated within the framework of the probabilistic method.A large concrete arch dam is considered with six wedges for each abutment.The seismic safety of the dam abutments is studied with quasi-static analysis for different hazard levels.The Londe limit equilibrium method is utilized to calculate the stability of the wedges in the abutments.Since the finite element method is time-consuming,the neural network is used as an alternative for calculating the wedge safety factor.For training the neural network,1000 random samples are generated and the dam response is calculated.The direction of applied acceleration is changed within 5-degree intervals to reveal the critical direction corresponding to the minimum safety factor.The Latin hypercube sampling (LHS) is employed for sample generation,and the safety level is determined with reliability analysis.Three sample numbers of 1000,2000 and 4000 are used to examine the average and standard deviation of the results.The global sensitivity analysis is used to identify the effects of random variables on the abutment stability.It is shown that friction,cohesion and uplift pressure have the most significant effects on the wedge stability variance.
Keywords: arch dam;seismic reliability;artificial neural network;Latin hypercube sampling;sensitivity analysis;wedge abutment
1 Introduction
The safe operation of concrete arch dams,as important and critical infrastructures,is of great concern due to their possible failure consequences (economic losses and potential loss of life) in the course of severe earthquake ground motions (Chen,2014;Panet al.,2015).The stability of an arch dam abutment is considered as one of the fundamental aspects to its stability.Several arch dams have been experiencing rock abutment instability throughout their life span,such as Malpasset,Vajont,Jinping I,Xiluodu,and Laxiwa (Liuet al.,2017;Londe,1987;Zhu and Sun,2013).
The stability of arch dam abutments is frequently investigated by using different deterministic approaches such as block theory (Goodman and Powell,2003),limit equilibrium analysis (Londe,1973;Mostafaeiet al.,2017a,2018;Mortazaviet al.,2021),and finite element method (Yuet al.,2005).However,since much uncertainty still exists about the earthquake and the structural parameters,the probabilistic risk assessment methods are preferred to quantify the effects of these parameters and support the decision-making process.To assess the risk-based probabilistic seismic stability analysis of an arch dam abutment,the instability scenarios must be identified,and then the conditional probability of these scenarios is predicted for different severity of earthquakes.
In recent years,different numerical approaches such as sensitivity and uncertainty analysis have been utilized by many researchers to quantify and qualify the effects of the various uncertainties on the seismic performance of concrete dams.Some of the works associated with the reliability analysis of dams are as follows.Sanjayet al.(Chauhan and Bowles,2004) evaluated the dam safety risk with uncertainty analysis in the framework of uncertainty analysis.They proposed some useful features for taking into account the effects of uncertainties in risk analysis results such as the confidence level associated with meeting tolerable risk guidelines.Seismic fragility of the Muhleberg dam was developed by Ghanaatet al.(2011) based on a nonlinear analysis with Latin hypercube simulation.The material random variables included elasticity modulus of concrete,concrete damping,elasticity modulus of rock,rock cohesion,and rock angle of friction.The log-normal distribution was allocated to random variables,except for the last two.They conducted a numerical study to compare the effects of epistemic plus aleatory uncertainties on the fragility curves with respect to only the epistemic one.Ganjiet al.(2019) investigated the seismic reliability of gravity dams by considering an inhomogeneous foundation.They studied the effect of the deconvolution process,number of samples,and foundation inhomogeneity.Also,their results showed that the exceedance probability obtained based on the first-order second-moment method (FOSM) was more flatted than those obtained according to the Latin hypercube sampling (LHS)method.Risk-based probabilistic thermal-stress analysis of a concrete arch dam was investigated by Soltaniet al.(2019) through three different reliability methods.Their results indicated that the highest and lowest exceedance probability of failure was provided by the LHS and FOSM methods,respectively.In another study,they conducted a reliability and variance-based sensitivity analysis of arch dams during construction and reservoir impoundment (Khaneghahiet al.,2019).The effects of random variables were determined on the response of the dam.Probabilistic safety assessment of a concrete arch was investigated by Pouraminianet al.(2019).In their research,the mechanical properties of concrete and normal water level were considered as random variables.Khiavi (2017) evaluated the seismic performance of a concrete gravity dam utilizing a probabilistic approach.Monte Carlo simulation was employed to investigate the influence of the elasticity modulus of concrete on the dam responses.Lianget al.(2019) investigated the seismic stability of concrete arch dam abutments by taking into account the effects of uncertainties associated with joints parameters.The uncertainty in the stability and damage detection in concrete gravity dams was studied by Narimanet al.(2019).Also,the effect of each parameter on the stability and damage detection of the Koyna dam models were detailed by using the first-order and total order sensitivity indices.Their results indicated that the reservoir height parameter was the most important parameter that had significant effects on the variation of the horizontal displacement of the dam crest.The results showed that the uncertainty quantification of material causes a decrease in decision making cost under the new conditions.
To the authors′ best knowledge,there is no work in the literature that delves into the seismic stability of arch dam abutments based on a reliability and sensitivity analysis.In this study,the seismic stability of arch dam abutments is studied within the uncertainty framework.Note that the mechanical properties of concrete,and rock,and the cohesion and friction of joints are assumed as random variables.To fulfill this goal,the Bakhtiari arch dam,with six wedges at each of its abutments,is chosen and a 3-D finite element model that includes the dam,reservoir,and foundation is developed.Obtaining the structure′s response from the finite element method is a time-consuming task;therefore,neural networks are employed as a surrogate to decrease the calculation time.For this purpose,1,000 cases are analyzed and the wedge safety factor determined.To train the neural network,90% of the data are used and the remaining are used for testing.The seismic stability reliability and sensitivity analysis of dam abutments is investigated through quasistatic analysis with design basis earthquake (DBE) and maximum credible earthquake (MCE) hazard levels.The effects of the wedge geometry,random variables,and number of samples are investigated.Thereafter,the probabilistic stability analysis of rock wedges in the abutments is investigated according to the LHS method.To investigate the number of samples,three different sets with 1,000,2,000,and 4,000 samples are separately generated by the LHS method.Note that simulations have been carried out.
2 Methodology
2.1 Londe method
The rock wedges are created by crossing joints,faults,cracks and fractures,which can significantly affect the seismic stability of arch dams during earthquakes (Zenzet al.,2012).The dam,foundation,reservoir,and the typical rock wedge and its supporting planes are shown in Fig.1.These planes are defined as sub-horizontal(P1),and sub-vertical planes (P2) and the grout curtain(P3),respectively.
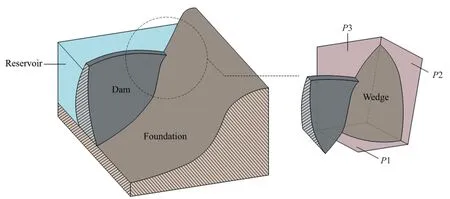
Fig.1 Dam-reservoir-foundation,wedge and its supporting planes (Mostafaei and Behnamfar,2019a)
To investigate the stability of rock wedges,their applied forces must first be identified.These forces are classified as static loads (the deadweight of the wedge(FW) and the uplift forces on the planes (FUp) and dynamic loads (inertia force of wedge (FEQ) and the thrust forces(FTH)).The results from the applied forces on the wedge can be expressed as follows (Londe,1973):
The deadweight can be expressed as follows:
wheremis the mass of the wedge.The uplift force on each plane can be determined by considering the water level,area of the plane and the performance of the grout curtain.
whereUi(i=1,2,3) is the total uplift force (in the absence of the grout curtain) on thei-th plane of the wedge with the unit normal vector havingli,mi,andni,as its components.Alsoiβis the coefficient of total uplift force oni-th plane of the wedge indicating the performance of the grout curtain.The inertia force of the wedge can be obtained as follows:

whereai(i=x,y,z) is the components of ground acceleration.In quasi-static analysis,the acceleration can be expressed in terms of the horizontal and vertical peak ground acceleration (i.e.,),the reduction factor (i.e.,) and the angle between the direction of considered horizontal excitation andx-direction (θ) as follows:

In order to obtain the thrust forces,a threedimensional finite element model of dam-foundationreservoir must be established.The thrust forces can be expressed in the vector form as follows:

To obtain the thrust forces,four different load cases are defined as:
· Case 1: dead weight+hydrostatic pressure.
· Case 2: unit acceleration inx-direction.
· Case 3: unit acceleration iny-direction.
· Case 4: unit acceleration inz-direction.
The thrust force vector can be written as the sum of its contributing load cases.

Substituting Eqs.(2),(3) and (8) into Eq.(1) the resultant force applied on the wedge can be written as:

By considering equilibrium equations,three corresponding reaction forces on the planesN1,N2,andN3can be written as:

Also,note that the planes are sole compressive.Strictly speaking,tensile normal force indicates that the planes detached from their supporting planes and the considered sliding mode is not true.As a consequence,four sliding modes can occur and are briefly described in the following:
If three reactions of planes are in compression and the wedge is not detached from any of its supporting planes,it means that the wedge is perfectly stable.
If two planes reactions are tensile and the third is compressive (the wedge is detached from two of its supporting planes).By neglecting the detached planes and resolving the equilibrium equations,the normal and shear forces on the third plane are calculated.Therefore,the safety factor of the wedge can be written as follows:
whereSFis the safety factor of the wedge andN,V,c,φandAare the normal force,shear force,cohesion,friction angle and area of the third plane,respectively.
If two planes reactions are compressive and the third is tensile (the wedge is detached from one of its supporting planes).By ignoring the opened plane and resolving the equilibrium equations,the normal forces on two planes and the shear force in the direction of the planes′ interface are calculated.Therefore,the safety factor of the wedge can be obtained as follows:

where subscriptsaandbdenote the two planes that are still in contact.
If reactions of three planes are tensile,the wedge is detached from all three of its supporting planes,which would result in instability.
2.2 Uncertainty and sensitivity analysis
The instability scenario can be expressed as limitstate inequality defined as (Khaneghahiet al.,2019):
whereψ(X),εandf(X) are the limit state function with the failure condition defined by the above inequality,threshold (decision variable) and the response of the model,respectively.In addition,Xis the random variables vector including materials,geometry,loads,etc.in the problem (McDonaldet al.,2005).Note to state thatψ(X)=0 identifies the instability threshold.The probability of occurrence of instability can be obtained as follows (Altarejos-Garcíaet al.,2012):
in whichP f[ψ(X) ≤ 0] andh(X) are probability of the instability occurrence and the joint probability density as a function of the random variables,respectively.The different types of probabilistic analysis are classified as the approximation and sampling methods which have disparate accuracy and computational cost.In approximation methods such as the first-order secondmoment method (FOSM),and first-order reliability method (FORM),the limit state function is linearized by the first-order and second-order of Taylor expansion at the design point,respectively,while in sampling method such as importance sampling,Monte Carlo simulation,and Latin hypercube sampling (LHS),the limit state function is obtained by high sampling frequency (McKayet al.,2000).
The sampling method is used to determine the probabilistic behavior of the structure.The surrogate model is used because solving the equations numerically is time consuming.Monte Carlo sampling (MCS) method is used for estimating the probability of a specific event,which is the result of a set of random input variables.The steps in MCS are:
a) assigning probabilistic distributions to random variables,
b) generating samples from the distributions,
c) running the simulation to determine the structure response,damage probability and assigning a distribution to the structure response.
The exceedance probability of failure,Pf,can be obtained as follows:

whereNfis the number at which the occurrence of the failure scenario is simulated andNrepresents the total number of simulations.The number of samples is important in estimating the average,standard deviation and damage probability of random variables.In the Monte Carlo analysis,more samples results in more accurate responses (Rajabiet al.,2015).For reliability analyses,if the failure probability is very small,the MCS method is not sufficient.As an alternative,the LHS method is chosen in this study,which is simpler and more efficient (Heltonet al.,2005;Helton and Davis,2003;Olssonet al.,2003).
The LHS is a variance reduction method,and it decreases the calculation process and increases the efficiency.Nis not known a priori for a given confidence level.To assure precise estimates in practical cases,Nis chosen to be much larger than the number of random variables.In the LHS method,each random variable is divided intoNequal probabilistic intervals,with each interval containing one analysis point.
The terms of reliability and sensitivity analysis generally appear together.Sensitivity analysis determines the relative importance of the model parameters.Quantitative statistical tests such as correlation analysis,regression analysis and variance-based methods can also be used.Previous studies (Archer,1997;Heltonet al.,2006;Oakley and O′Hagan,2004;Sobol,2001)proposed computing sensitivity measures in complex models and sampling-based systems.Using the concept of global sensitivity analysis,the following formula is applied:
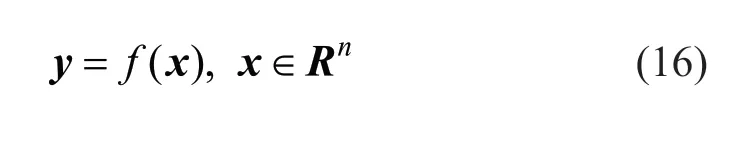
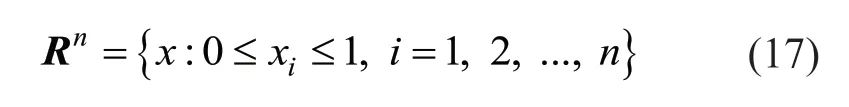
wherexis the input parameter matrix,f(x) denotes an arbitrary model,andyis the output vector.Then-dimensional unit cubeRnon which the input parameters are defined is given by:
It is assumed that the model function is square integrable.In the variance-based sensitivity method,the model output variance is affected by an input or a group of input parameters (Saltelliet al.,2010;Tian,2013).The following sensitivity indices (Sobol′s method) are employed to express the separate contributions of input parameter variances on the model variance.
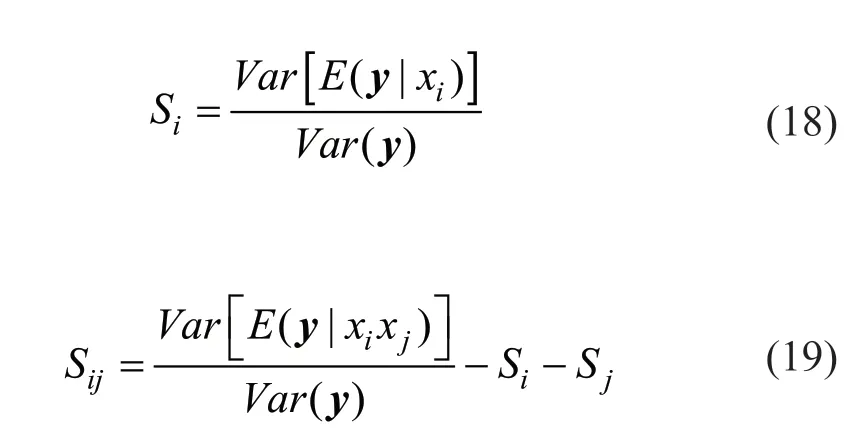
here,Varis the variance andEis the expectation.These indices are applicable to complex and arbitrary model functions.Sij(the second-order index) shows the model sensitivity towardix,xjinteractions (excluding their first-order effects) and also the higher order effects.The variable importance or the interaction of variables and its effect on the model response (Tian,2013) can be inferred from the indices.
The total mber of Sobol′s indices in a model withninput parameters is 2n-1 .Largernresults in higher computational cost.In order to lower the time of analysis for determining the interaction effects of input variables,the total sensitivity index of an inputixis introduced as:
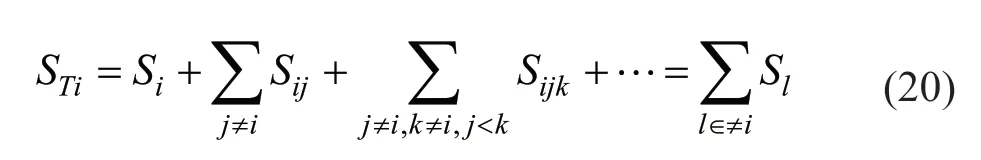
In this formula,all of the non-ordered subsets of indices with the indexiare defined by ≠i.Therefore,the sum of sensitivity indices withiin their index is written as.The Latin hypercube sampling-based simulation provides an estimate of the mentioned indices.
3 Description of the case study
The Bakhtiari dam is a double curvature arch dam located in the southwest of Iran (Mostafaei and Behnamfar,2019b).It is 325 m in height which makes it the highest double concrete arch dam in the world and the crest length is 468 m.The dam thicknesses are 5 m and 54 m in crest and base of the dam,respectively.The finite element model including dam-reservoir-foundation interaction is developed as shown in Fig.2.Mostafaeiet al.(2020) argued that the material nonlinearity did not have a significant effect on stability analysis of the abutment.Therefore,the linear behavior is presumed for all the materials used (foundation rock,water and concrete).The dam and its surrounding foundation are modeled by an eight-node brick isoparametric element(Mostafaei and Behnamfar,2021).Also,the acoustic elements are employed for the reservoir water modeling.The transmitting boundary condition is applied at the farends of the reservoir,and its bottom is assumed to obey a non-absorbing boundary condition (Du and Wang,2004).Dynamic fluid-structure interaction is modeled by means of the Eulerian-Lagrangian method.Additionally,the infinite elements are utilized at the bottom and lateral sides of the foundation to model the wave radiation (Liuet al.,2002;Mohammadnezhadet al.,2019).
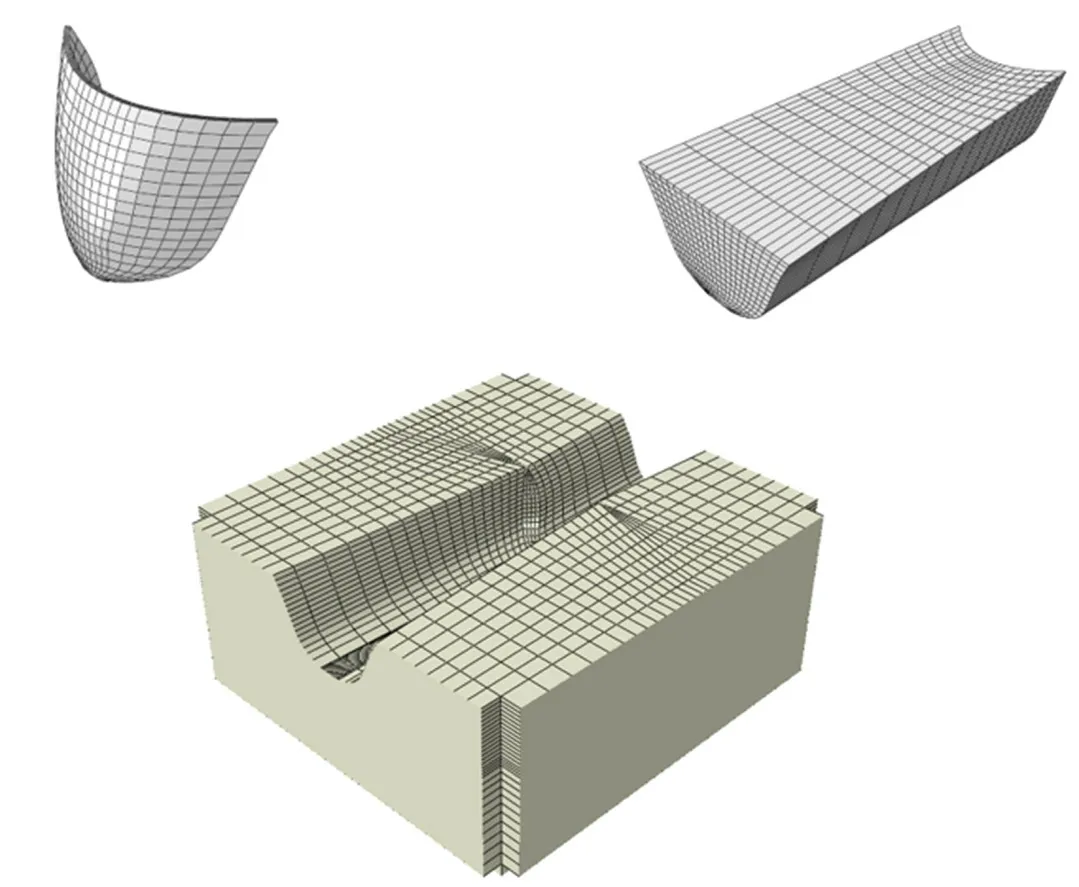
Fig.2 Finite element model for Bakhtiari dam including damfoundation-reservoir system
The damping ratio is considered to be equal to five percent of the critical damping for the dam and foundation material.Note that the joints and faults are not considered among the rock region in the finite element model.The commercial ABAQUS (2016) software is only used to calculate the thrust forces,and the response are utilized for the post processing stage performed by MATLAB.
3.1 Random variable
The uncertainty in models can be classified into two categories,epistemic and aleatoric.The uncertainties caused by a lack of knowledge is termed epistemic uncertainty.As opposed to this,the aleatoric uncertainty refers to uncertainty due to inherent randomness.Note that epistemic uncertainty is mainly utilized to consider the uncertainty in modeling parameters.The random variables chosen are listed in Table 1.Based on theαratio (Table 1),the elasticity modulus of foundation(Ef) is pertinent to the dam′s modulus (Ec) (Mostafaei and Behnamfar,2022).The uplift pressure on the grout curtain plane is considered to be in its full value,and those on the two other planes are considered to be a percentage of total uplift force called theβratio (Eq.(3)).Theβratio is related to the extent of imperfection presumed for the grout curtain and plays a key role in the stability of arch dam abutments (Mostafaeiet al.,2017b).Regarding the large uncertainties caused by the lack of data (Khaneghahiet al.,2019),the uniform distribution is utilized for the mentioned ratios (αand)β.Since the beta distribution is perfectly fitted with the available data,it has been exploited for the friction coefficient(Jimenez-Rodriguez and Sitar,2007;Mostafaeiet al.,2021),whereas the lognormal probability distribution has been allocated to other random variables (Khaneghahiet al.,2019).Surveys on rock slopes such as that conducted by Leeet al.(2012) highlights the usual variation range of cohesion COV within 10%-30% and the COV of friction angle ()φwithin 10%-20%.In addition,all random variables-excluding the cohesion and the friction angle-are supposed to be uncorrelated.And also,a negative value from-0.2 to-0.8 is probable for the coefficient of correlation between the friction and the cohesion (Wanget al.,2013).Table 2 demonstrates the correlation matrix between random variables in this work.
3.2 Wedges definition
The six joint surfaces intersecting at the Bakhtiari dam abutment mark out the abutment rock wedges.Table 3 lists the unit normal vectors of the planes probable to sliding.
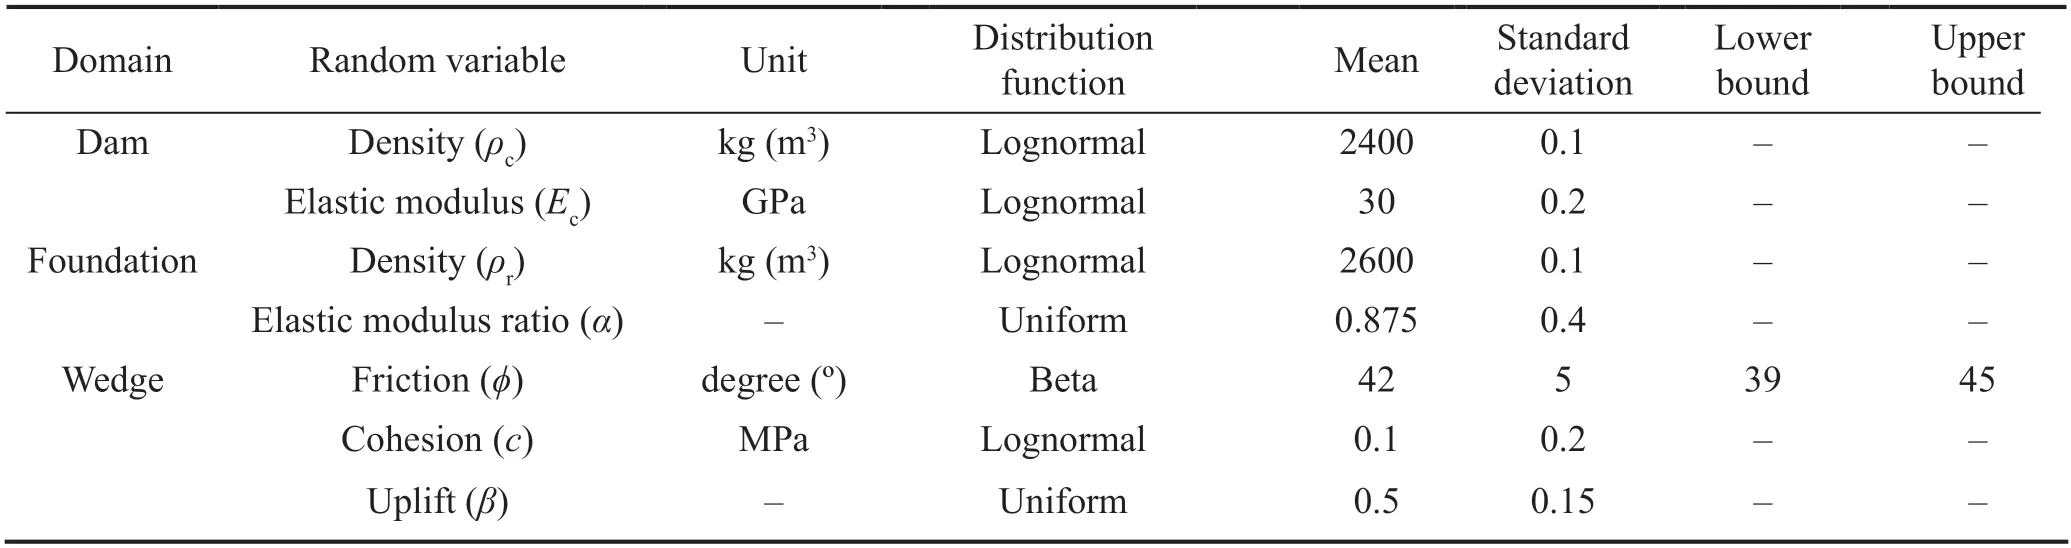
Table 1 Statistical distributions of selected random variable in abutment stability analysis
As shown in Fig.3,the investigation of stabilityanalysis of the dam′s abutments is carried out by the six chosen wedges at each abutment,which differ in the horizontal plane elevation.

Fig.3 Geometry of abutment wedges: (a) WL1 and WR1 at elevation 305 m;(b) WL2 and WR2 at elevation 275 m;(c) WL3 and WR3 at elevation 225 m;(d) WL4 and WR4 at elevation 185 m;(e) WL5 and WR5 at elevation 14 5 m;(f) WL6 and WR6 at elevation 85 m
Table 4 lists the geometry,and the total uplift force applied to these discontinuity planes.Note that the total uplift force on each plane can be obtained by the water level,geometry and area of the plane.
3.3 Seismic analysis
Concerning the probabilistic seismic hazard analysis of the Bakhtiari arch dam,the DBE and MCE peak ground acceleration are tabulated in Table 5.MCE is defined as the expected occurrence of the largest ground motions in the vicinity of the dam according to the seismic history and seismotectonic setup of the region.The DBE with a return period of 475 is used as the reference design earthquake of the structure.
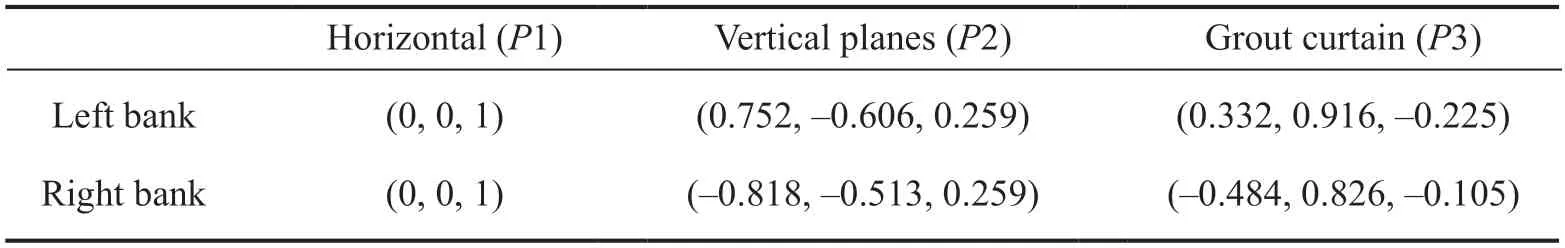
Table 3 Unit normal vectors of planes probable to sliding (Mostafaei et al.,2020)
Note that the horizontal and vertical reduction factor (i.e.,αH,αV) are specified as 2/3 and-2/9,respectively.Additionally,the variation range of the horizontal excitation direction (i.e.,angleθin Eq.(9))is presumed as intervals of 5 degrees within the 360 degrees.Therefore,for each hazard level,there would be 72 possible load combinations.Mostafaeiet al.(2017b)revealed that in pseudo-static analysis,the rotation of applied acceleration had a significant influence on the wedge stability.
3.4 Performance function
As previously stated,one of the most important aspects in the stability of arch dams is the abutment stability.The failure of concrete arch dams in the past indicated that the main cause of destruction in this typeof dam was the rock abutment instability.Hence,in this study,the performance functions are defined according to the instability in the abutments of the arch dam.The performance function can be expressed as follows:
whereψ(X),SFreqandSF(X) are the performance function according to stability,the required safety factor corresponding to hazard level and the response of the Londe method,respectively.It is particularly notable that the analysis of these wedges is based on a computed safety factor which exhibits either stability (ψ(X) ≥ 0) or instability (ψ(X) < 0).
3.5 Artificial neural network (ANN)
Artificial neural networks are widely utilized in various fields,particularly in structural engineering(Gerolymoset al.,2005;Kamatchiet al.,2010;Prabakaranet al.,2015;Ramezaniet al.,2018) and dams(De Granrutet al,2019;Hammidet al.,2018;Karimiet al,2010;Mata,2011;Prabakaranet al.,2015;Ramezaniet al.,2018;Seyedashrafet al.,2017;Stojanovicet al.,2016).Neural networks are a data mining system inspired by the brain neural connections in which the small processors perform parallel to each other in a network to solve problems.The key step is extracting the hidden pattern with data mining.The system is made of many connected neurons as computing elements that work together to solve the problem.The neural network structure is given in Fig.4.

Fig.4 Structures of a neural network and a single processing unit
This model comprises the input,output and hidden layers,each having several neurons.The number of neurons in the hidden layer affects the accuracy of the artificial neural network.Using fewer or more than an optimal number of neurons results in low accuracy and over training,respectively.The relationship between the input (xj),output (yP) for a processing element can be written as (Seyedashrafet al.,2017):
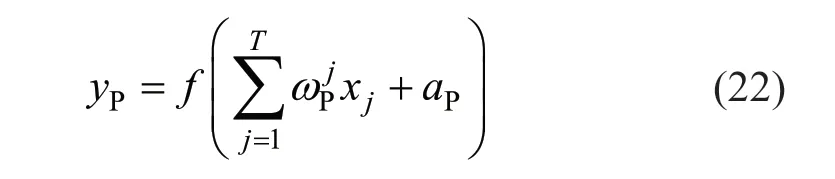
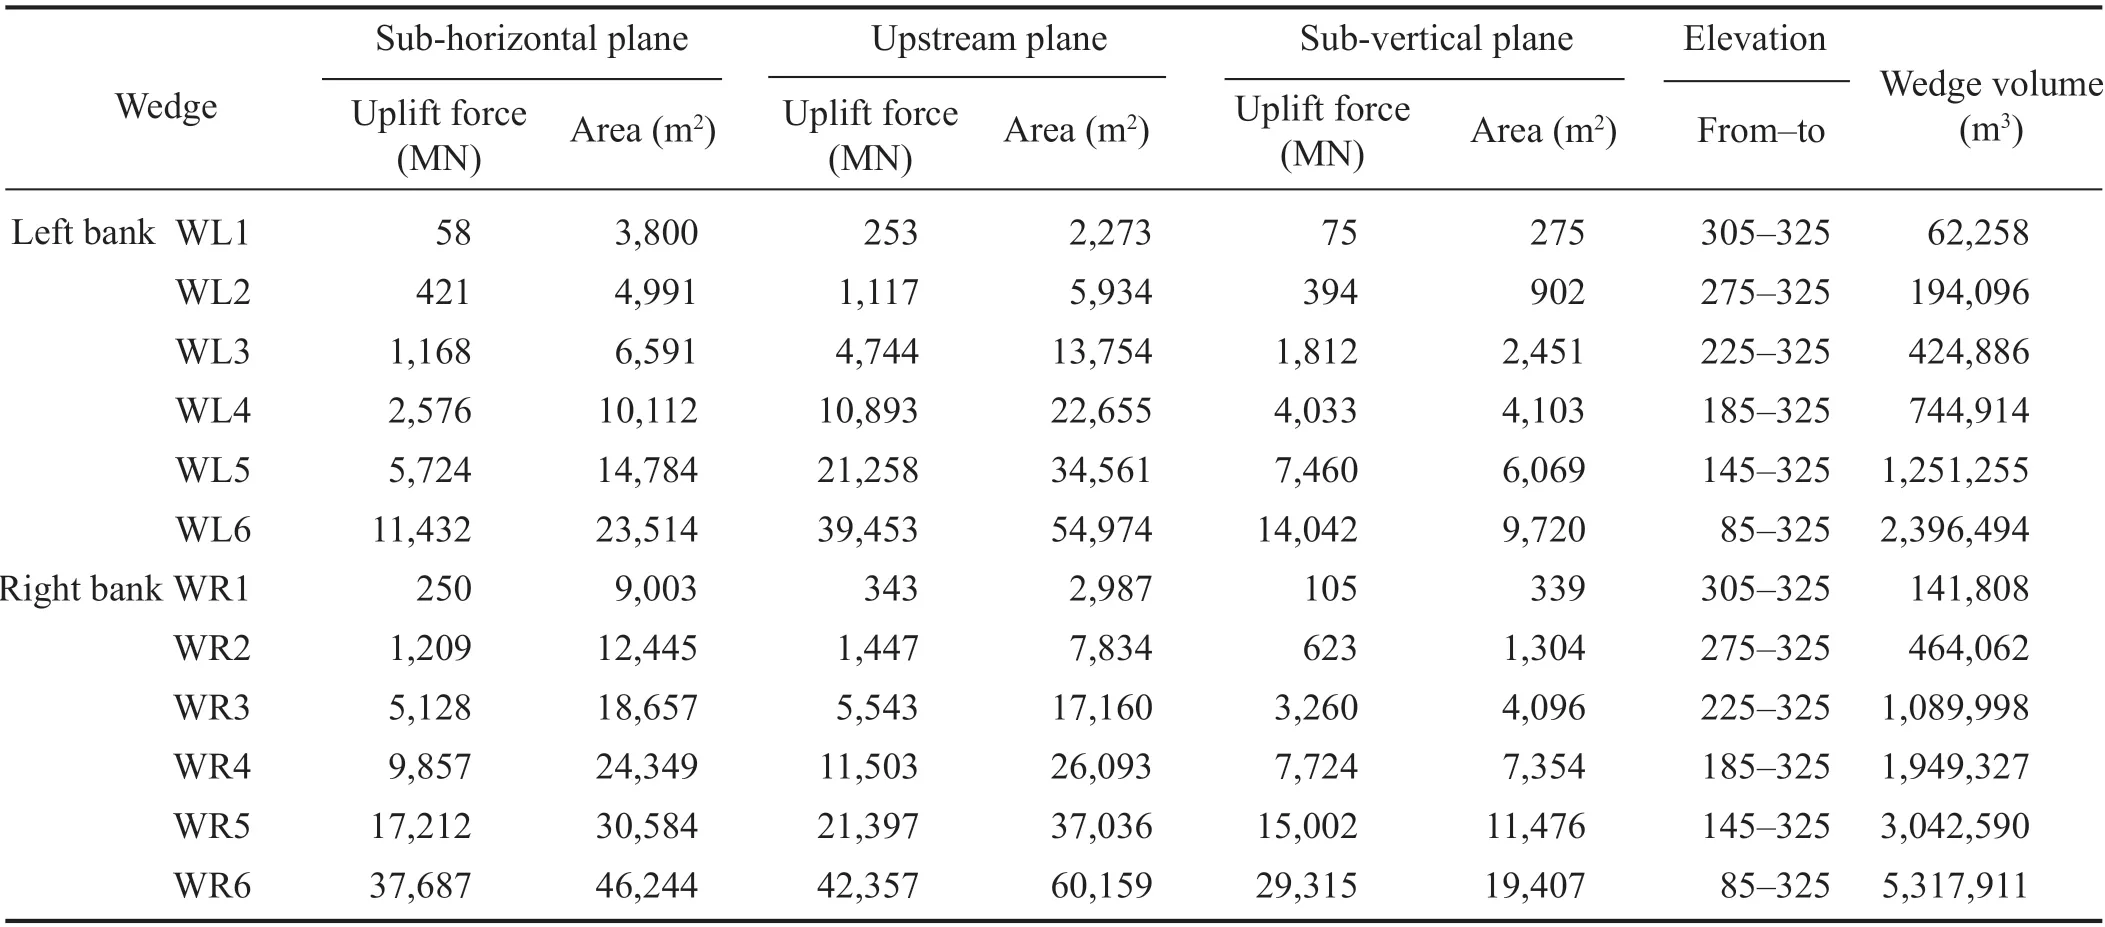
Table 4 Geometry and total uplift forces of discontinuity planes (Mostafaei et al.,2020)
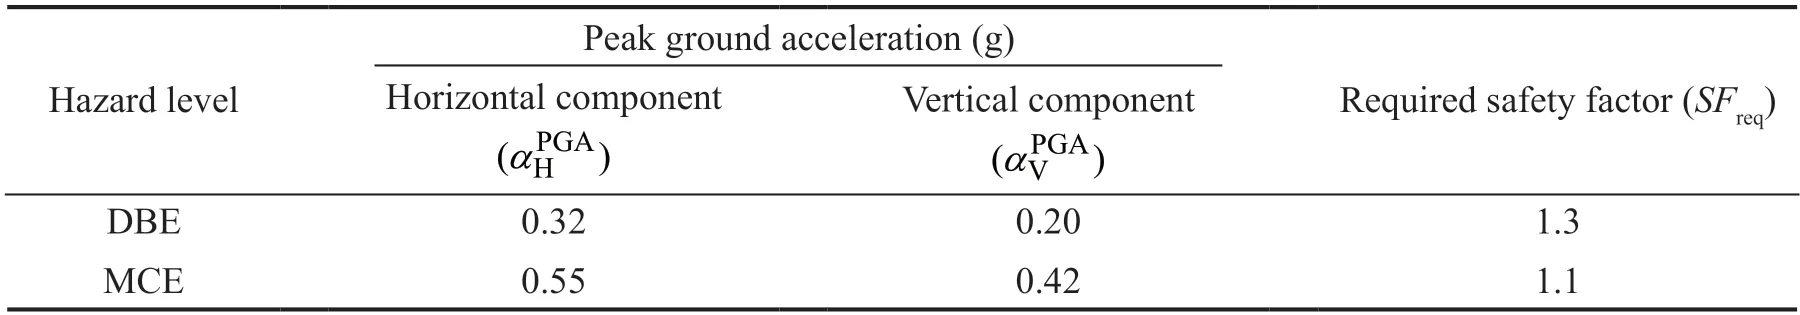
Table 5 Pseudo-static accelerations for different hazard levels (Mostafaei et al.,2020)
The network training is initiated using two hidden layers with tangent-sigmoid (tan-sig) activation function.The first and second hidden layers have six and one neurons,respectively.The partitioning is 90%training data and 10% testing data,randomly chosen from the input data.The mean squared error is used for performance assessment.Figure 5 shows the regression test and trained data.
The selection of training data is random,and the performance is assessed in each step (epoch).The ultimate neural network has eight neurons in the input layer and one neuron in the output.The neural network error is 1.3%.According to Fig.6,the model performance is 0.0012959,after which the training is over and the final ANN model is obtained.
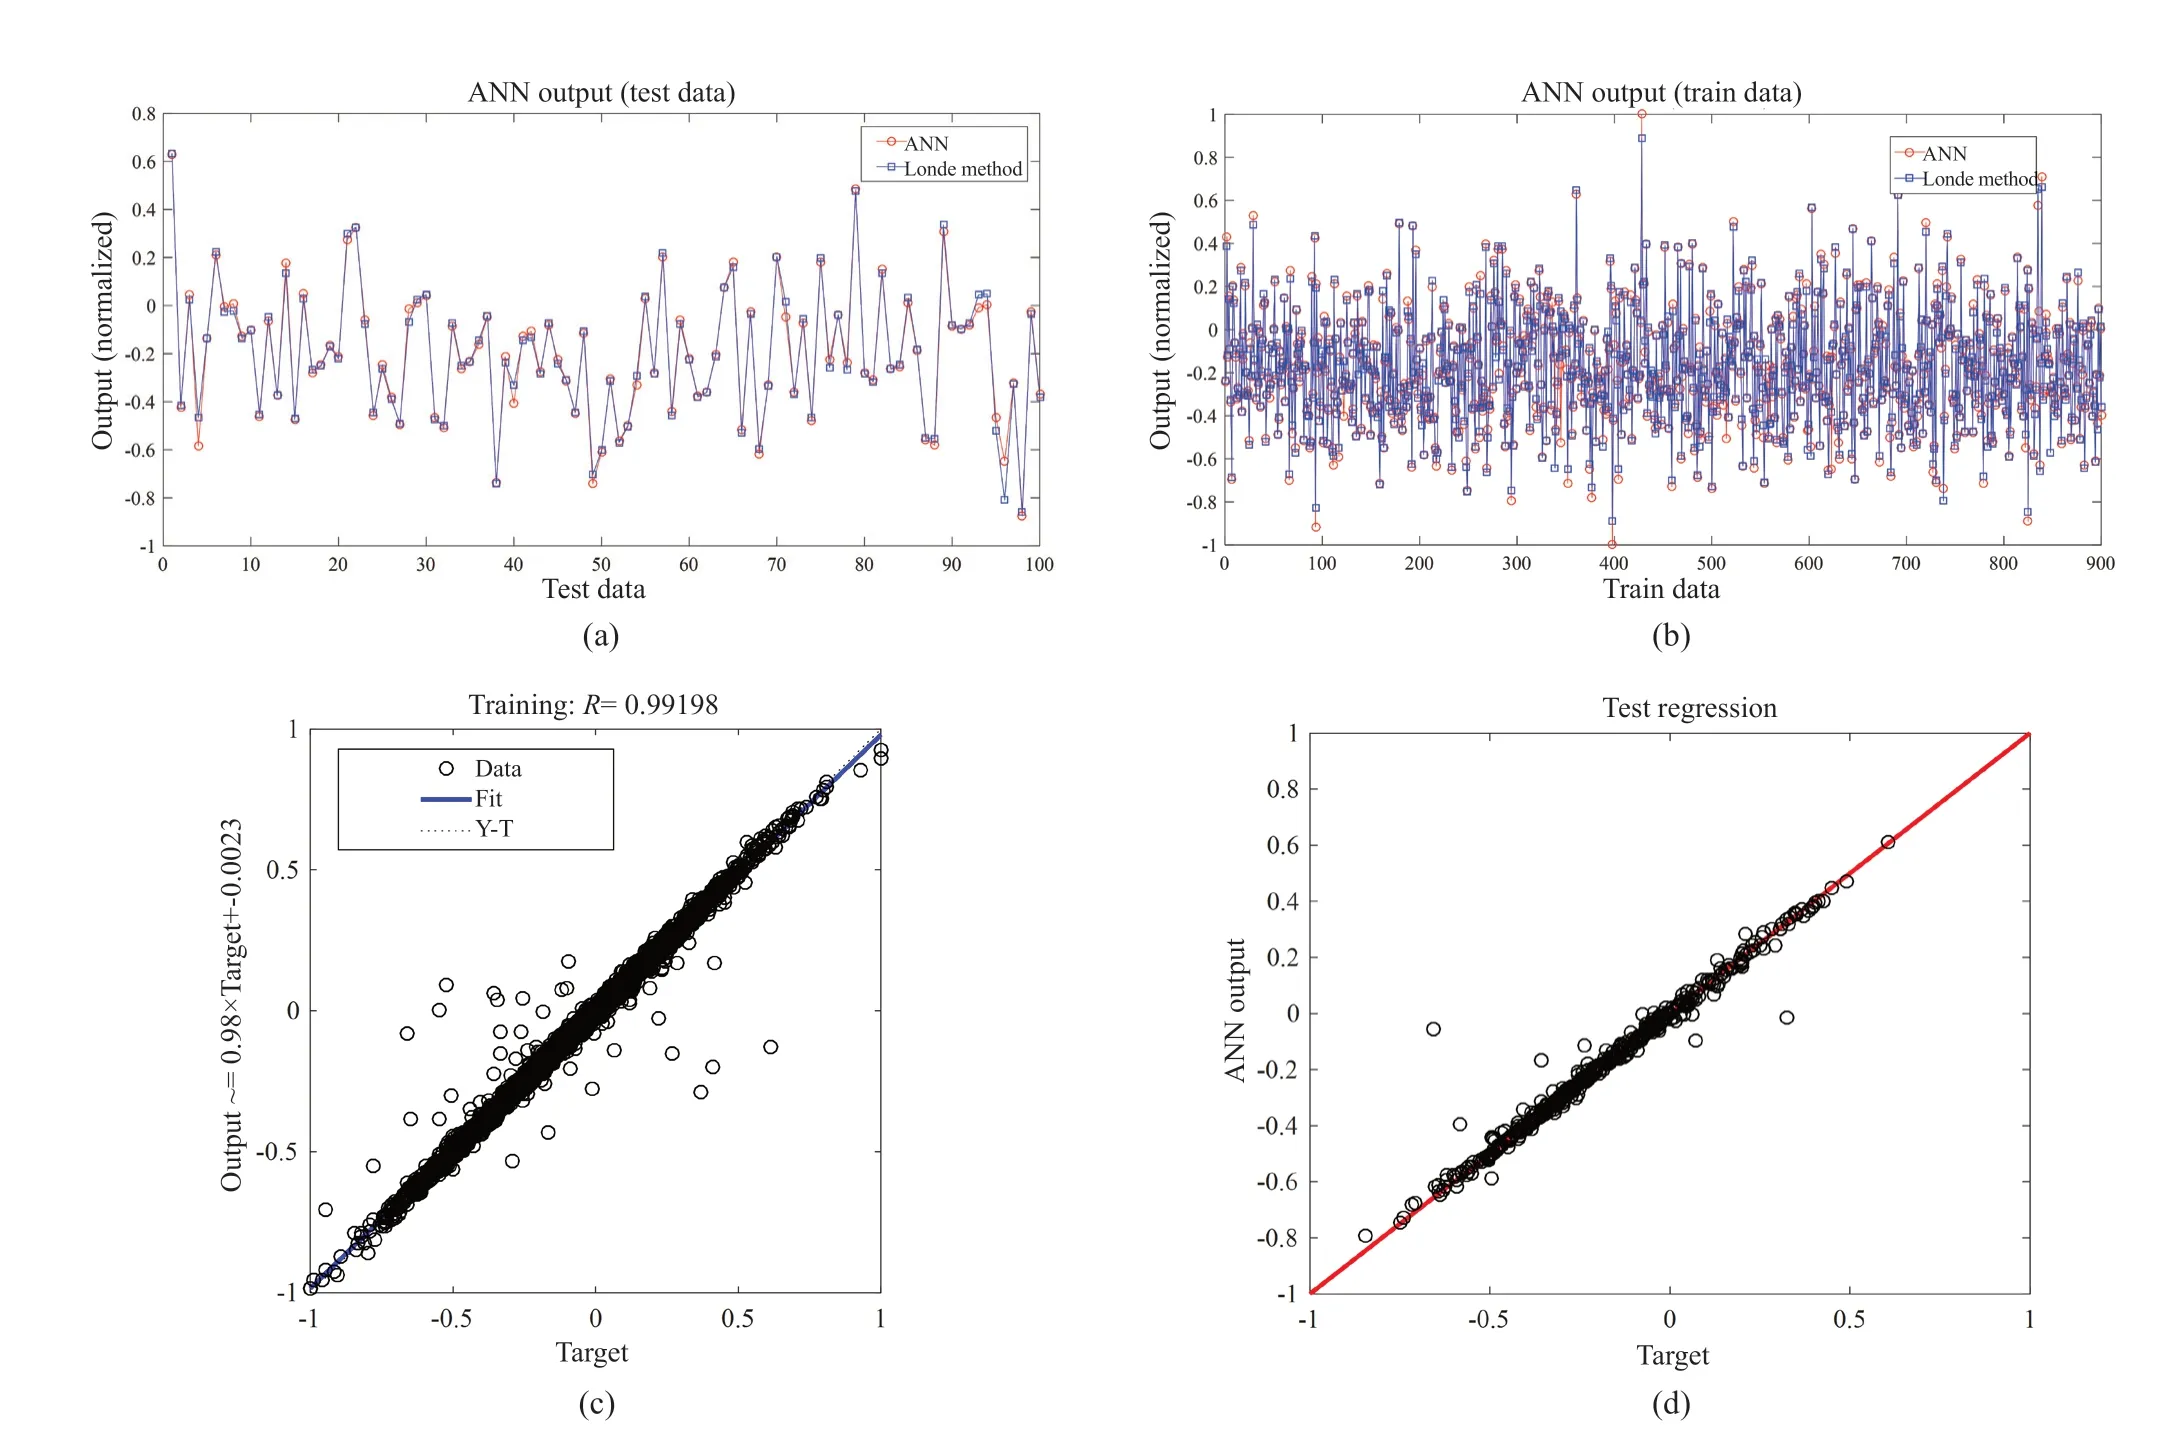
Fig.5 Comparison of Londe method and ANN results for training and testing data: (a) train data;(b) test data;(c) train regression;(d) test regression
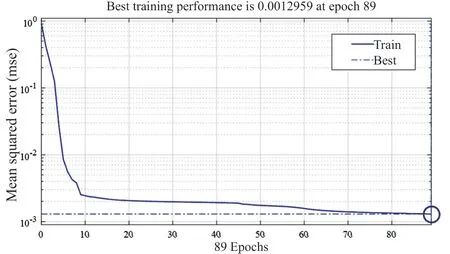
Fig.6 Validation performance value
4 Probabilistic analysis results
In this section,the results from considering the modeling uncertainties and quantifying their effect on the stability of arch dam abutments using LHS methods are presented.A sensitivity analysis is then conducted to identify the critical input factors and their interactive effects on the stability variance.
4.1 LHS
As reported earlier,with regard to the LHS method,although the definition of sample size (N) is not given to determine the confidence level,there are some formulae proposed for many types of usages (Iman,2008;Melchers,1999).For example,the following simple formula is suggested by Brodinget al.(1964):

In this formula,Cland0Rare the confidence level and the desired reliability.On the presumption of reasonable values in dam engineering (Cl=98%,R0=0.999) and also on the basis of the given formula,nearly 4000 samples are needed.In spite of this formula′s adjustment to the number of Monte-Carlo samples,it could be exploited as the first attempt of the LHS method.Therefore,in the following discussion,the LHS method is employed to evaluate the number of samples,which yields three disparate simulated collections of 1,000,2,000 and 4,000 through sampling the modeling parameters in Table 1.
The exceedance probability of the safety factor limitstate function considering the threshold value ofSFreq=1.3 are tabulated in Table 6 for all the wedges.
As can be seen from this table,the difference between the exceedance probability increases as the PGA increases.The results reveal that the maximum difference between the estimatedPfvalues for all the wedges is up to 1.3% for the defined performance function at the DBE hazard level,while this value is 93.4% at the MCE hazard level.Moreover,the location of the bedrock plane ()1Pplays a key role in the stability of arch dam abutments,and its effects are more significant in severe earthquakes.The histograms of the minimum safety factor of the wedges for the three sample sets caused by the DBE,and MCE hazard levels are shown in Fig.7.
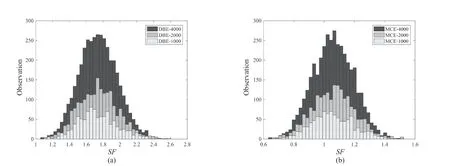
Fig.7 Histograms of minimum safety factors of wedges for three sets of samples due to different hazard levels: (a) DBE;(b) MCE
Normal,lognormal,gamma,Weibul,and logisticdistributions are fitted and theP-values are obtained.TheP-value is the probability of a null hypothesis.If theP-value is smaller than the significance level,then the distribution is not normal.P-values for various sample sets and hazard levels are given in Table 7.
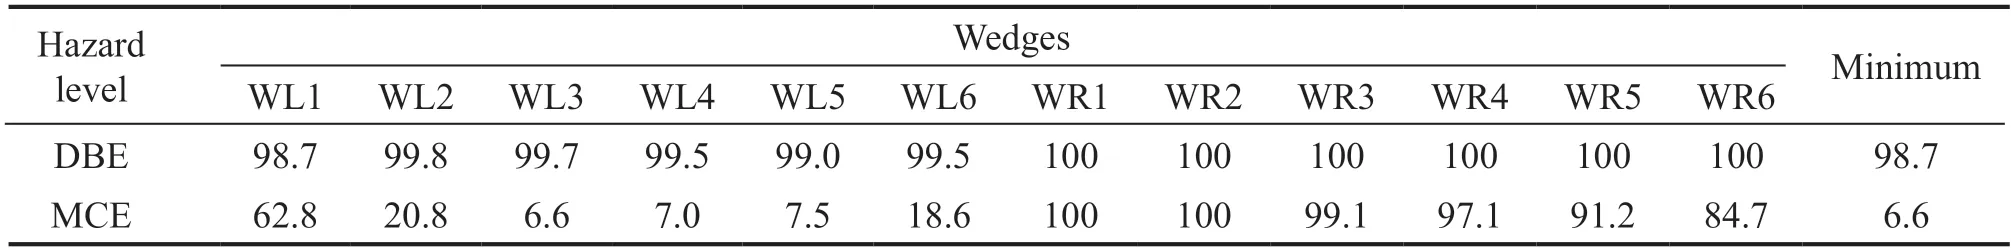
Table 6 Exceedance probability of safety factor limit-state function for threshold value of SFreq=1.3 for all wedges
Based on DBE hazard levels,normal distribution is not fitted to DBE because theP-value is less than 0.05 for all three cases (N=1,000,2,000,4,000).The transformation methods of Box-Cox and Johnson are used to make the distributions normal,giving a p-value of 0.065 and 0.531 forN=1,000.The Johnson method is therefore used to transform the data into normal distribution.
ForN=4,000,theP-value is also increased,therefore Johnson′s method is used as it has a greaterP-value than the Box-Cox method in all cases.For MCE hazard level outputs withN=1,000,normal distribution cannot be used,but increasing the sample numbers toN=2,000 orN=4,000 makes it possible to meaningfully fit the normal distribution to the data.Therefore,normal distribution is the appropriate distribution in case of highN.For MCE data,the Box-Cox transformation is better for converting to normal distribution in both small and largeNvalues.
ForP=1,000 results,the log-normal distribution can be fitted to data with aP-value higher than 0.05;however,increasing the sample numbers would decrease theP-value.Therefore,this distribution is not suitable for MCE data.
The output (mean and the standard deviation)of distributions is given in Table 8.Since the PGA is increased,the lower mean responses are typically recorded.The mean responses are 1.732 and 1.054 considering DBE safety factor and MCE forN=1,000.Also,an increase in the earthquake severity decreases the standard deviations.For DBE and MCE,the safety factor variations are 0.230,and 0.139,respectively.Increasing the earthquake PGA leads to a narrower distribution and the variation of the safety factor is higher.
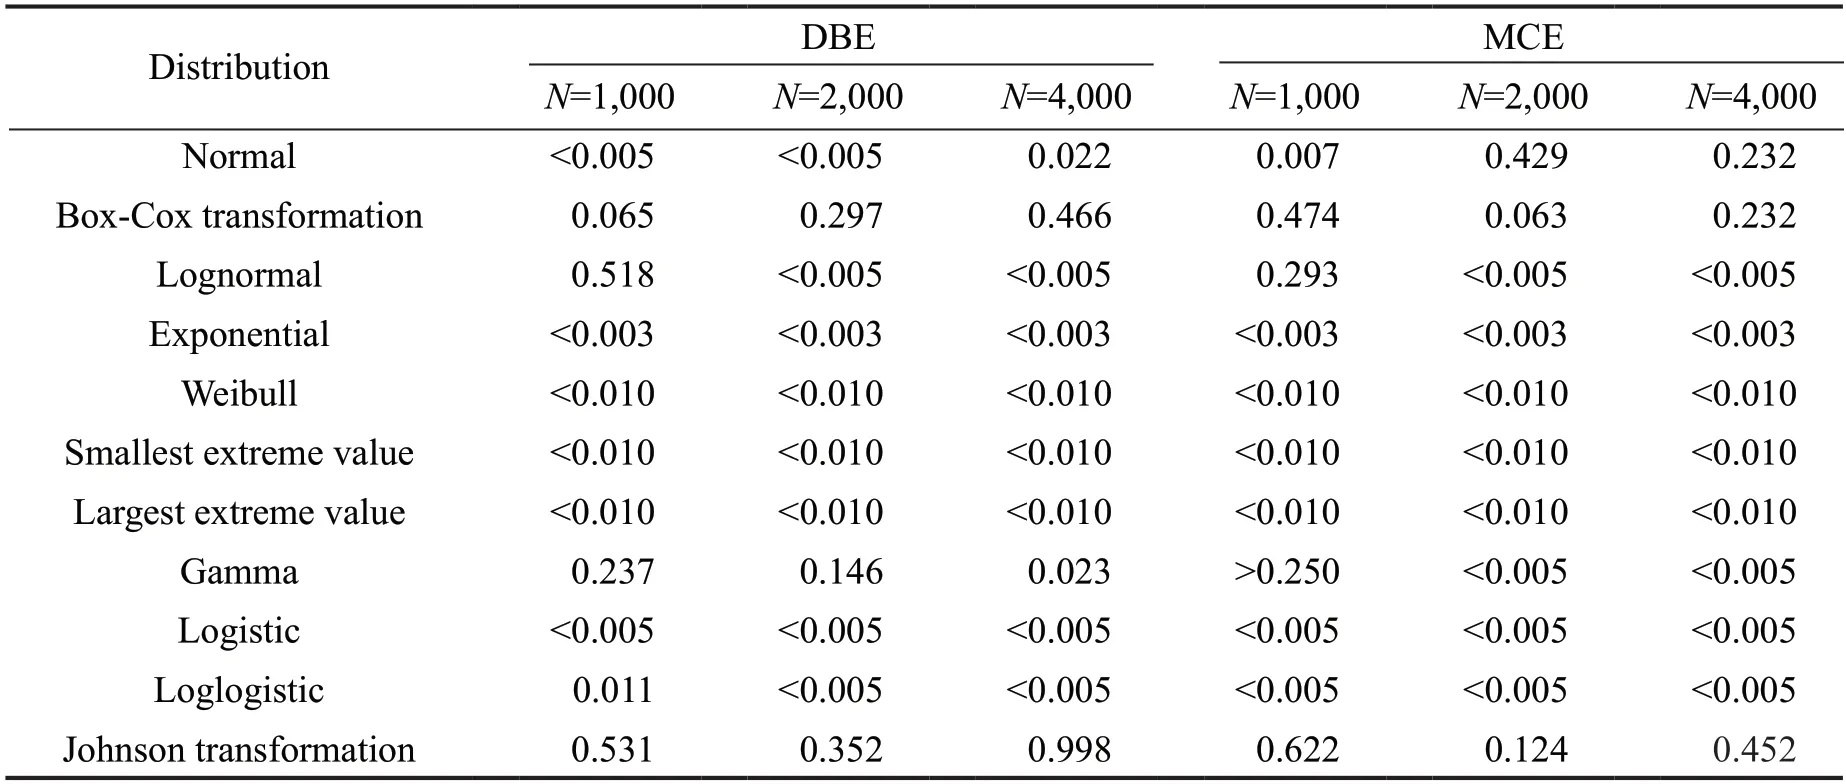
Table 7 Distribution identification for different sample sets and hazard levels
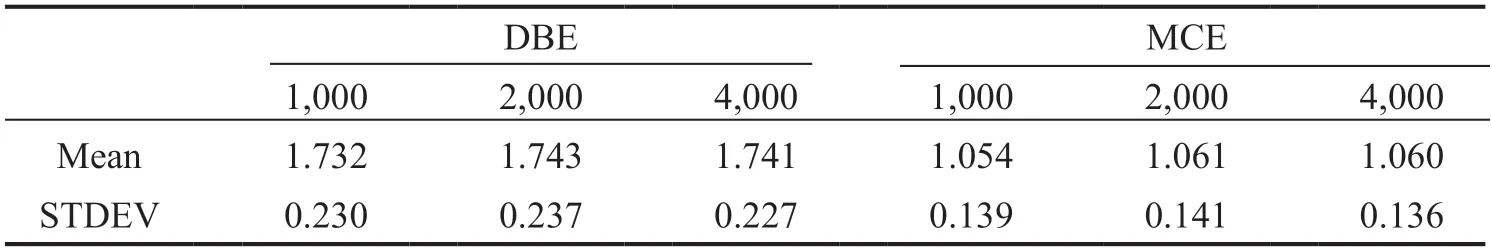
Table 8 Mean and standard deviation of distribution fits on output histograms
More information about the sources of uncertainty affecting the stability of arch dam abutments is beneficial for obtaining better accuracy in calculations.
Based on the histograms provided in Fig.7,exceedance probability of the limit-states (Pf) is obtained for diverse instability threshold values in Fig.8.The figure shows that the exceedance probability curves are similar regardless ofN.For the performance function,since the approximate calculated value ofPfis identical for each threshold level,the simulations number decreased,which reduced the computational costs.For higher PGA,left-shift of the exceedance probability occurs,which shows higher failure probability.
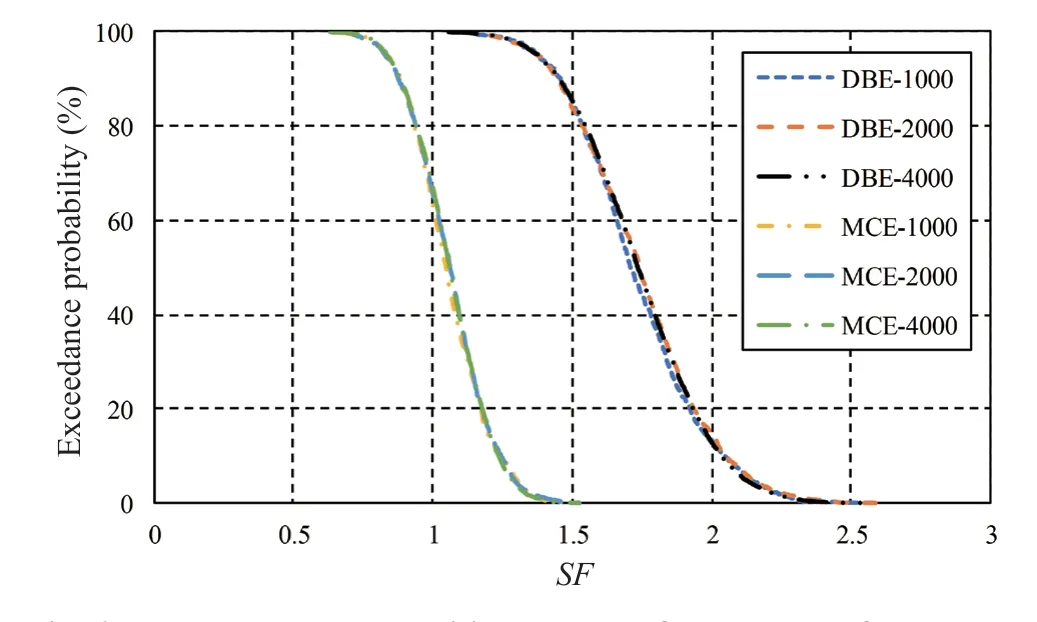
Fig.8 Exceedance probability curves of three sets of samples for different hazard levels
For example,considering a threshold value of 1.1,the exceedance probabilities would be 75% and 35%for the DBE and MCE,respectively.This threshold is a common value of the required safety factor of abutments.
4.2 Sensitivity analysis
The variance-based sensitivity methods are utilized to delve into the effect of random variables on the limitstate function.Note that these sensitivity methods arebased upon the first-order and total order sensitivity indices for different hazard levels,as shown in Fig.9.
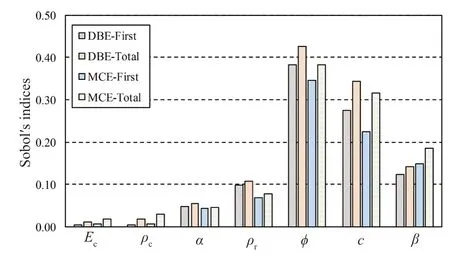
Fig.9 Sensitivity indices for different hazard levels
The DBE sensitivity analysis outcomes make it clear that with respect to both first-order and total effect indices,φ,β,andcparameters are the most important and on the contrary,the concrete mechanical properties do not have any importance.It can be concluded that the interaction between the variables does not impact their relative importance since there are no discrepancies in their ranking according to first-order and total-order indices.In addition,it is inferred from Sobol′s indices that for the MCE hazard level,the parameters ofφ,β,andcare the effective parameters.With regard to both the first-order and total-order indexes,the peripheral joint friction angle is assumed as the most important parameter.In addition,the variance of the responses is not affected by the elastic modulus of concrete.Moreover,the comparison between Sobol′s coefficients for a variety of hazard levels shows that as the earthquake severity increases,the importance of the parameters remains constant,but their level of effectiveness slightly decreases.
5 Conclusions
In this study,the performance of dam abutments subjected to different hazard levels was investigated by considering the uncertainty of the model properties and the loading conditions.As a case study,the Bakhtiari arch dam and its rock foundation were modeled with the finite element method.The Londe limit equilibrium method was used to calculate the stability of the wedges in the abutments.Given that these analyses were timeconsuming,neural networks were trained as a surrogate model to reduce the calculation time of the structural response.To train the neural network,a set of 1,000 data was generated randomly.Subsequently,the minimum wedge safety factor was calculated.The horizontal acceleration was applied in 5° intervals to find the critical direction of seismic loads and the minimum safety factors.Moreover,to obtain the thrust forces,four different load cases were defined.
The random variables consist of material characteristics of the concrete,the rock,the uplift pressure,and also the friction and cohesion coefficients of the joints.To calculate the exceedance probability of the limit-state function and the effect of random variables on the response variance,reliability and sensitivity analyses were carried out.In the uncertainty framework,LHS and variance-based sensitivity analysis were used.
The exceedance probability was significantly affected by the sub-horizontal plane location.The right part is considerably larger than the left part;therefore,the left part was at greater risk of damage.The wedge weight acts as a resistant factor against instability.
Through the LHS method,three sets including 1,000,2,000 and 4,000 samples were generated to study the effect of the number of samples.For allNvalues,the same distribution with similar parameters was fitted and similar seismic exceedance probability curves were obtained.As a result,N=1,000 was used.When the structure is subjected to a strong earthquake,a lower response mean and variation coefficient could be obtained.The Box-Cox transformation was used to change DBE and MCE data into normally distributed data (with an acceptableP-value).
In addition to the exceedance probability,the Sobol′s indices were calculated to determine the importance of variables based on their effect on wedge stability variance.For DBE,the planes′ mechanical characteristics and the uplift pressure coefficient ()βhad high importance while concrete and rock masses had low importance.The other random variables had a negligible effect and could be removed from the analysis.SiandSTifollow very similar trends.For the MCE hazard levels,the variables in order of high to low importance wereφ,β,andc;whileφwas the most important variable.
杂志排行

Earthquake Engineering and Engineering Vibration的其它文章
- Innovative mitigation method for buried pipelines crossing faults
- Study on time-varying seismic vulnerability and analysis of ECC-RC composite piers using high strength reinforcement bars in offshore environment
- Optimization of design parameters for controlled rocking steel braced dual-frames
- Seismic response of selective pallet racks isolated with friction pendulum bearing system
- Effects of timber infill walls on the seismic behavior of traditional Chinese timber frames
- Steel rings as seismic fuses for enhancing ductility of cross braced frames