Effects of timber infill walls on the seismic behavior of traditional Chinese timber frames
2022-10-19XieQifangZhangBaozhuangLiShengyingWuFanfanandYangHuifeng
Xie Qifang ,Zhang Baozhuang ,Li Shengying ,Wu Fanfan and Yang Huifeng
1.Key Laboratory of Earthquake Engineering and Engineering Vibration,Institute of Engineering Mechanics,China Earthquake Administration,Harbin 150080,China
2.School of Civil Engineering,Xi’an University of Architecture and Technology,Xi′an 710055,China
3.China Coal Xi′an Design Engineering Co.,Ltd.,Xi′an 710055,China
4.College of Civil Engineering,Nanjing Tech University,Nanjing 211816,China
Abstract: This study investigates the enhanced effect of timber infill walls on the seismic behavior of traditional Chinese timber frames.Two 1/2 scaled traditional Chinese timber infill walls (TIWs),two 1/2 scaled timber frames with timber infill walls (TFTIWs) and one 1/2 scaled timber frame (TF) were fabricated and tested under low-cyclic reversed loading.The failure modes,strength,stiffness,and energy consumption capacity of the TIWs and the TFTIWs were obtained,and the effects of the TIWs on the seismic performance of the TFTIWs were investigated.The results showed that the TIWs can increase the stiffness and ultimate bearing capacity of the TF,up to 60% and 80%,respectively.The strength degradation coefficient of the TFTIWs was slightly higher than that of the TF when the inter-story drift ratio exceeded 0.02 rad,and the TIWs helped to mitigate the strength degradation of the TFTIWs.It was also found that the TFTIWs had a higher cumulative energy dissipation when compared with the TF (up to a 60% increase),indicating the TIWs had reasonably good energy dissipation capacity.When the TIWs generated a solid contribution to the carrying capacity and energy dissipation of the TF,the lateral drift thresholds were 1/100 and 1/43 of the column height,respectively.Furthermore,the TIWs and TFTIWs presented a good ductility,and the TIW could effectively reduce the pull-out amount of the tenon from the mortise of the TF;however,the TIWs had little influence on the stiffness degradation level or improvement of the ductility of the TF.
Keywords: traditional Chinese timber frame;timber infill wall;mortise-tenon joint;cyclic loading test;seismic behavior
1 Introduction
Timber structures have been extensively used throughout the world,especially in China,Korea,Canada,Japan,the United States and Northern Europe(Bedonet al.,2015;Brancoet al.,2012),due to the wide availability of wood material,the ease of erection and the low cost of construction.In addition,they also demonstrated superior seismic performance in recent major earthquakes such as in Turkey in 1999,Greece in 2003,China in 2008 (Wang,2008),Haiti in 2010,China in 2013 and 2014 (Sunet al.,2014),where they have often sustained little damage (Vieux-Champagneet al.,2014;Huanget al.,2018;Chenet al.,2016b).This evidence of the earthquake resistant behavior of timber structures has attracted interest in its mechanical behavior.Many researchers have studied the aseismic mechanism of traditional timber frames (Liet al.,2015;Menget al.,2018;Huanget al.,2017;Xieet al.,2018b,2019c,2020),and have found that the timber frame(TF) had a good energy consumption and deformation capacity.
In China,traditional timber frames are constructed using a special method: (1) the connectors between beams and columns are mortise and tenon joints (M&T joints) without nails or dowels;and (2) the column footings are located directly on cornerstones without fasteners.A typical traditional Chinese timber-frame building is shown in Fig.1.The seismic behavior of the M&T joints,the column footing joints and the traditional timber frames has been extensively researched by experimental tests (Liet al.,2015;Menget al.,2018;Xieet al.,2018a,2019c,2020;Huanget al.,2017;Panget al.,2011;Liet al.,2016,2020;Chenet al.,2016a;Maet al.,2020;Heet al.,2017;Leeet al.,2009;Zhangetal.,2022b) and numerical analysis (Guanet al.,2008;Hajdarevićet al.,2014;Chunet al.,2017;Xieet al.,2018b,2021;Lukicet al.,2018;Zhanget al.,2022a).However,the effects of the infill walls were ignored in these studies.The survey by Caimi (2014) showed that timber frame structures with infill walls were widely distributed throughout the world,especially in seismicprone areas,and were also used in traditional Chinese timber frame structures.Figure 2 shows some traditional timber frame structures with infill walls.

Fig.1 Typical traditional Chinese timber-frame building (Xie et al.,2019c)
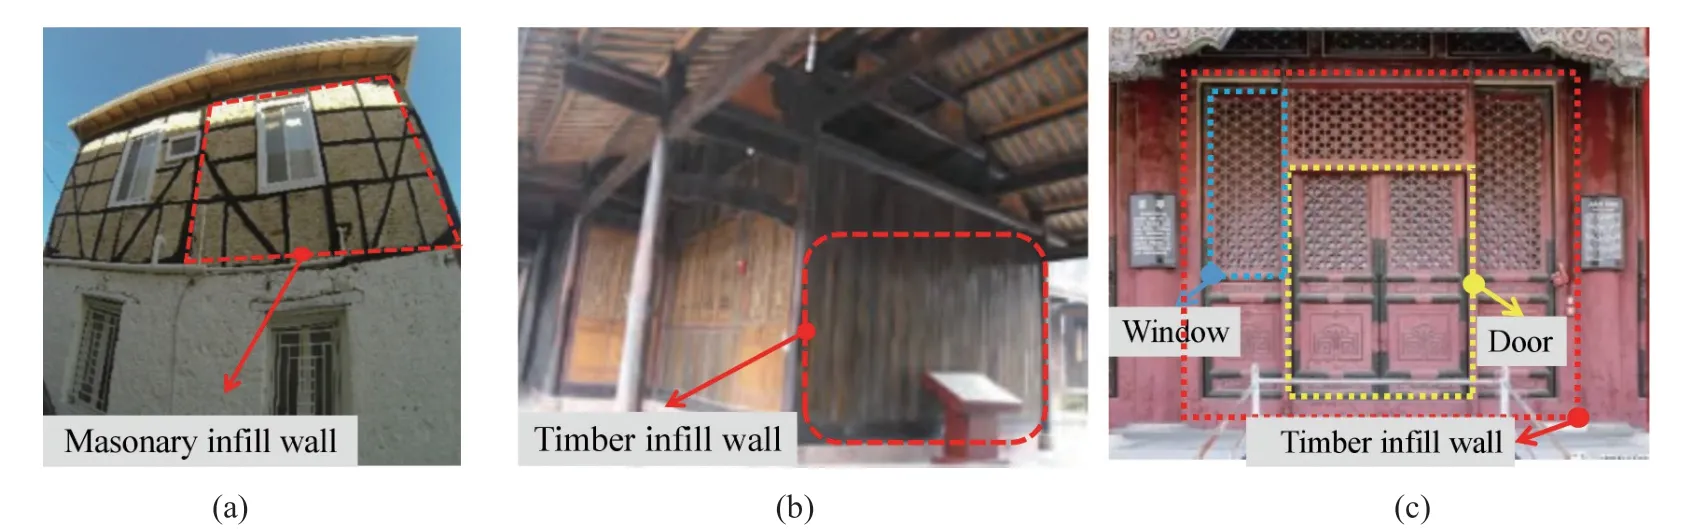
Fig.2 Traditional timber frame structures with infill walls: (a) masonry infill wall;(b) timber infill wall and (c) timber infill wall with doors and windows
In recent years,the influence of the infill walls on the seismic behavior of timber frames has drawn the attention of many researchers.Many scholars have carried out experimental studies for different types of timber frames with masonry infill walls (Ferreiraet al.,2014;Polettiet al.,2014;Ruggieriet al.,2013;Xieet al.,2019a;Brancoet al.,2014;Dutuet al.,2015).The results showed that masonry infilled walls played a role in the improvement of the load carrying capacity,secant stiffness and energy consumption of timber frames,which should be given more attention,and that the infill walls had a significant influence on the aseismic behavior of the structure.Furthermore,the contributions of stone infilled walls(Vieux-Champagneet al.,2014;Aliet al.,2012),and earth (mud) infill walls (Hsuet al.,2009) on the aseismic behavior of timber frames have also been investigated and studied,and similar conclusions were found.
However,timber infill walls (TIWs,Figs.2(b)and 2(c)) have existed for several centuries in ancient Chinese timber structures,and have been regarded as nonstructural components;therefore,few researchers have focused on ancient Chinese timber frames with timber infill walls (TFTIWs) to date.Huanget al.(2018)conducted experiments on three types of four full-scale single story two-bay Chuan-Dou type timber frames subjected to cyclic reciprocating loading tests,which proved that the load bearing capacity and stiffness of the Chuan-Dou type of bare frame can be enhanced by infilling wattle and daub panels or light frame wood shear wall panels.Crayssacet al.(2018) and Songet al.(2018) investigated the lateral behavior of ancient timber frames with timber panel infills and found that it could significantly improve the seismic performance of the timber frame.Therefore,it is important to study the effect of timber infill walls on the seismic behavior of timber frames,which is needed to evaluate the seismic performance of traditional wooden structures.
In this study,two different types of timber infill walls and three ancient Chinese timber frames with different timber infills (no infill,infill with two different forms of timber infill walls) were tested under low-cycle reversed loading.The effects and influence laws of timber infill walls on the seismic behavior of traditional Chinese timber frames,with respect to the failure modes,hysteretic behavior,strength,stiffness,and energy dissipation capacity,were investigated.
2 Experimental program
2.1 Wood properties
Pinus sylvestriswas used to fabricate the five halfsize scale specimens,which is the wood often used in traditional Chinese timber structures.The material properties of the wood were tested in accordance with the Chinese National Standard GB 1927-1943-1991:Physical and mechanical tests of wood (CRIWI 1992)(1991).The averaged wood properties are presented in Table 1.The moisture content and the dried density of specimens were 11.22% and 0.52 g/cm3,respectively.

Table 1 Material properties of wood
2.2 Specimens fabrication
The five half-size scale specimens were fabricated based on a prototype of the Xi′an Bell Tower in China(Fig.3).Among them,the TIW was composed of“Threshold” “Jamb” “Qunban” and “Zhongmo”.The“Threshold” can be divided from top to bottom into“Upper threshold” (3620×120×90 mm3),“Middle threshold” (3620×120×90 mm3),and “Lower threshold”(3620×120×75 mm3).The “Jamb” can be divided from outside to inside into “Outer jamb” (2505×120×75 mm3)and “Inner jamb” (2505×120×105 mm3).The threshold and jamb were connected by the straight tenon or the cross tenon,Qunban was fixed by Zhongmo and the groove of the lower threshold,and the depth of the groove was 20 mm.The two types of timber infill walls were uniform in size,3620 mm in length and 2505 mm in height;however,the door and window openings had a different layout.One was mainly simplified from window openings,which was identified by TIW-w,and the other was mainly simplified from the door opening,which was identified by TIW-d;the influence of window decorations was not considered in the two models,as shown in Fig.4.
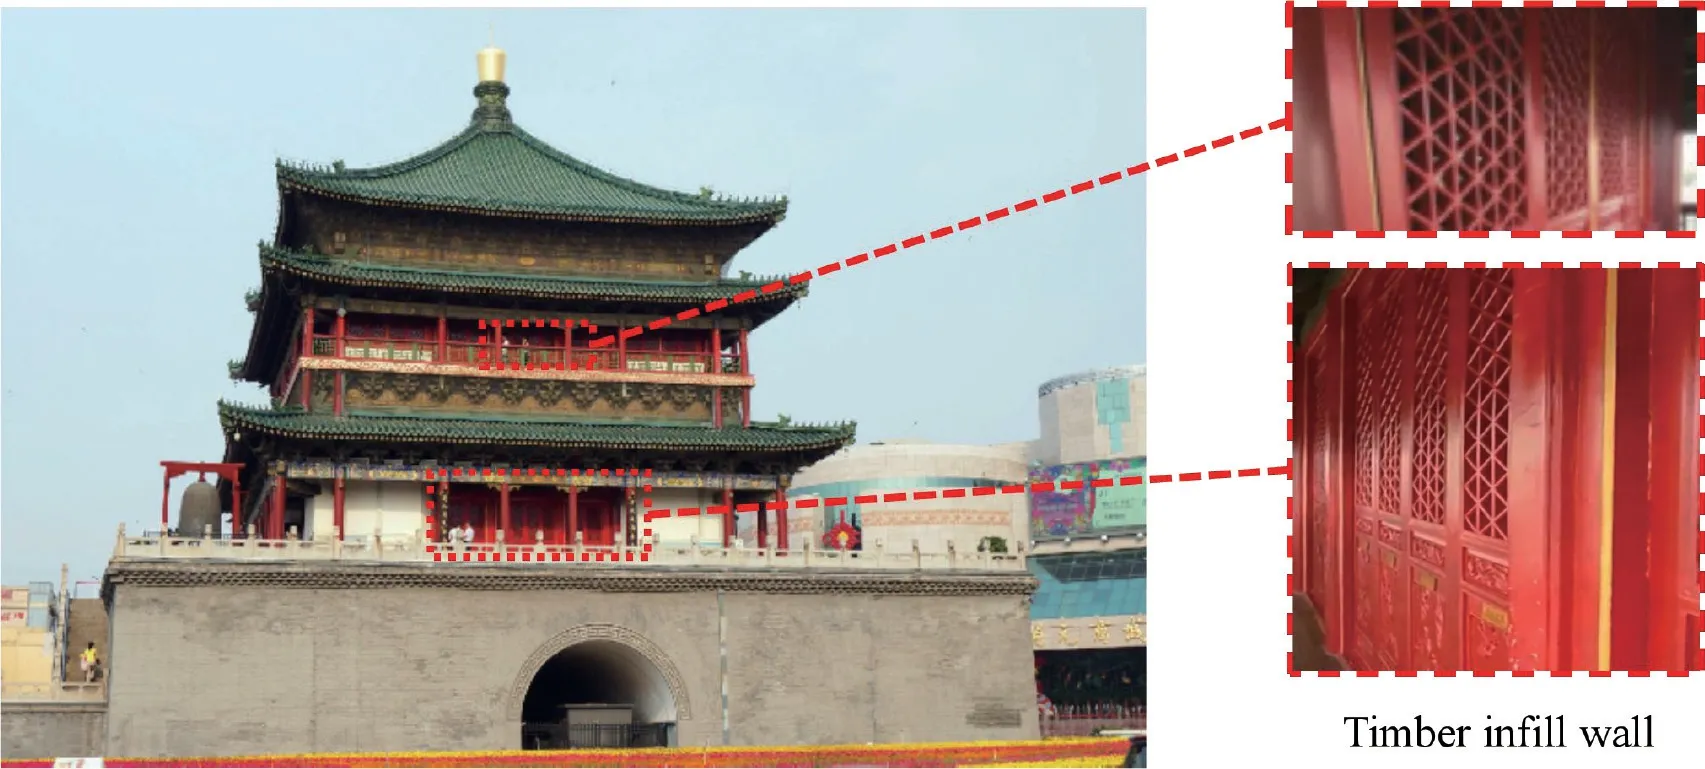
Fig.3 Xi′an Bell Tower

Fig.4 Enlarged view and layout of TIWs: (a) specimen TIW-w;and (b) specimen TIW-d (mm)
Each timber frame had a 3920 mm span and 2680 mm height,which consisted of a main beam(4220×350×150 mm3) and two columns with circular sections (300 mm in diameter) connected by a straight M&T joint (300×75×350 mm3),and columns with protruding pins were embedded in the holes (also called sea eye,the diameter and height are equal to 90 mm3) of the cornerstones (300×400×90 mm3) (Xieet al.,2019b).All specimens were placed on a 5520×400×200 mm3rectangular steel beam.Specimen TF was a bare timber frame without timber infill walls,specimen TFTIW-w was composed of TF and TIW with window openings,and specimen TFTIW-d consisted of TF and TIW with door openings,where TF and TIW were connected by Zaixiao (20×20×100 mm3).The sliding pin groove was located between the outer jamb and the timber column.The layout and the main dimensions of the specimens are shown in Fig.5.

Fig.5 Enlarged view and layout of TFTIWs: (a) specimen TF;(b) specimen TFTIW-w;and (c) specimen TFTIW-d (mm)
2.3 Testing and measuring schemes
All five specimens were tested in the structural and seismic laboratory at Xi′an University of Architecture and Technology in Shaanxi Province,China.The testsetup of the specimens is illustrated in Fig.6.The steel beam was fixed to the ground by pressing a beam fixed transversely by a steel bolt at each end.The cornerstones were fixed by the angle steel.Each side of the timber beam center installed two steel beams with four rollers to avoid out-of-plane instability of the specimens.The two columns were connected through four steel tie bars to maintain synchronization of motion of the two columns,which were flush with the beam height and evenly distributed on both sides of the beam and fixed by two steel plates.The steel plates at both ends of the specimens were placed on steel brackets fastened on the columns.The distance between the steel plates and the specimens was 50 mm,which was convenient for tenon pulling.An electro-hydraulic serve loading system,with a displacement range and loading capacity of ± 250 mm and 500 kN,respectively,was used to apply the cyclic loading.The hydraulic actuator and the steel plate were connected by a hinge to avoid the effect of the bending moment generated by the gravity of the actuator.The vertical load was applied to the load-sharing beam by a hydraulic loading system through spherical hinges.The top of the columns was wrapped by the steel column caps to avoid stress concentration of the top surfaces of the column.Furthermore,for the simulation of the boundary condition of TIW during loading,the semirigid joints of the timber frame,such as the M&T joint and column base joint,became hinge joints through a series of manual processing.
The layout of displacement measurement points for the specimen is illustrated in Fig.6.The testing contents included: (1) the force (F) and displacement(D1) controlled by the horizontal actuator;(2) the lateral displacement of frame (D2,D3) and the lateral displacement of TIW (D22);(3) the amount of pulling out of tenon from mortise (D4-D7);(4) the uplift of column bases (D8-D11);(5) relative dislocation between TIW and TF (D12-D16);(6) relative displacement between Zhongmo,Qunban and outer frame (D17,D18),the deflection upward of Zhongmo (D19-D21).Note that the measurement scheme of TIW is different from that of TFTIW,in which the relative displacement of the beam and column was not tested.
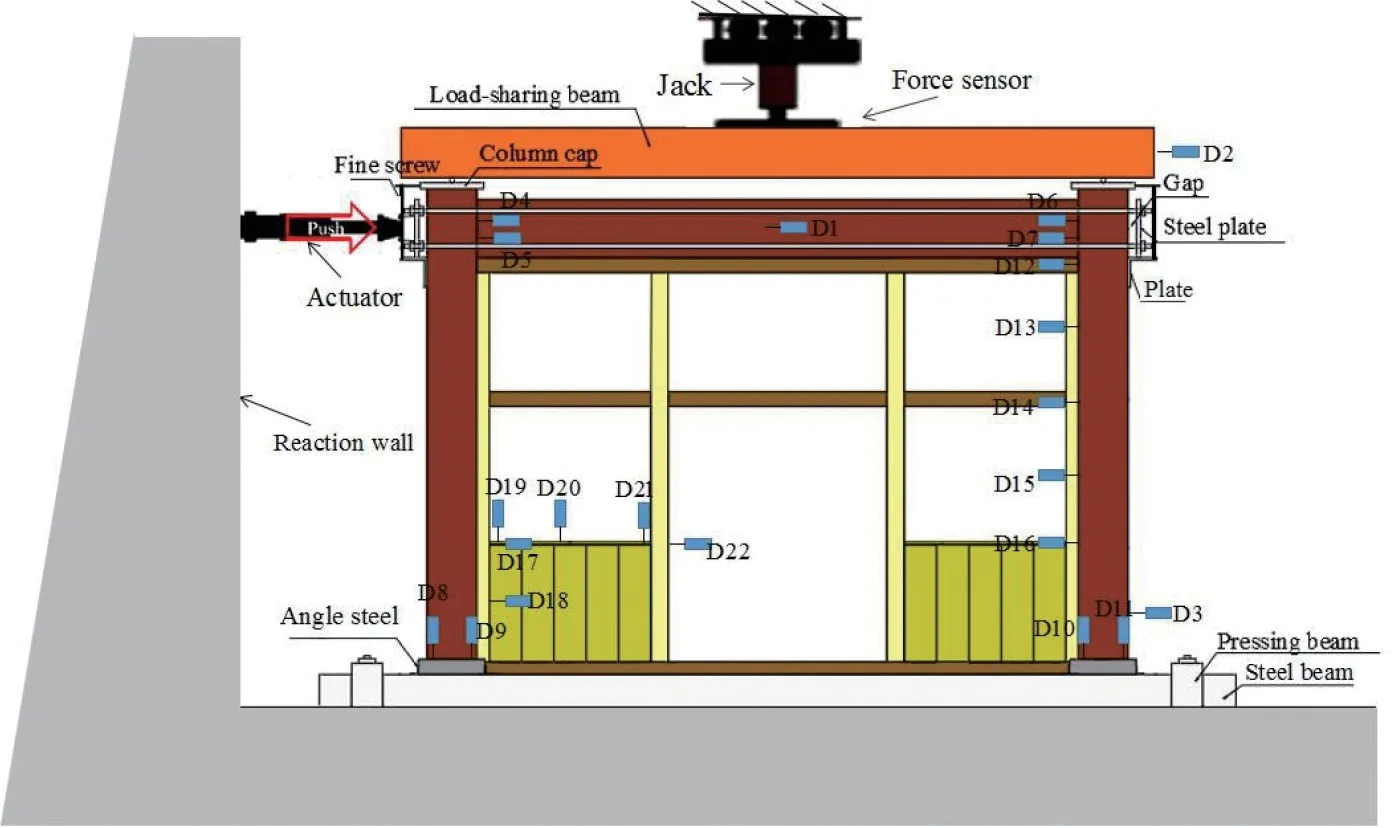
Fig.6 Test setup and layout of displacement sensors
2.4 Loading protocol
The total vertical loads applied were 150 kN,and the loads at each loading point of the column were 75 kN,which were used to simulate the gravity loads from the upper floors of the Bell Tower (Fig.3).The horizontal cyclic load was applied by the displacement control in accordance with Development of a Testing Protocol for Timber Frame Structures (Krawinkler,2001);the loading procedure curve is illustrated in Fig.7.A displacement with an amplitude of 0.05Δwas applied in the first six cycles to check whether the loading equipment and measuring devices were in good condition.Then,six initial loading cycles with an amplitude of 0.05Δwere implemented,followed by the subsequent amplitude of the cycle composed of the primary cycle and the trailing cycles (amplitude of cycle equal to 75% of the primary cycles).Determination of the reference displacementΔ=90 mm was in accordance with GB 50165-92:Technical Code for Maintenance and Strengthening of Ancient Timber Buildings (1992),which provided that the ultimate drift ratio of the timber structure was 1/30 under a rare earthquake.
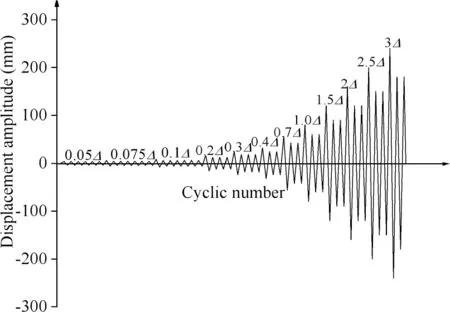
Fig.7 Low-cyclic reversed loading protocol
3 Experimental results
3.1 General observations and failure modes
3.1.1 Timber infill wall
Specimen TIW-w was loaded to the trailing cycle 1.125Δafter the primary cycle 1.5Δ(the lateral displacement angle was greater than 1/40) when it was considered as failed with a sharp decrease in bearing capacity.When the lateral displacement reached 0.3Δ,a small “squeak” sound was emitted due to the squeeze between the elements in the infill wall.Except that the cracks at both ends of Zhongmo started to appear due to the dislocation of the Qunban elements.Cross tenon and mortise also suffered from extrusion deformation and the occurrence of cracks.Shear failure occurred at the edge of the lower threshold mortise and the end of the upper threshold and extrusion deformation occurred at the end of the tenon of the frame,resulting from the mutual squeeze and rotation between mortise and tenon,as shown in Figs.8(a)-8(d).
Specimen TIW-d was loaded to the trailing cycle 0.525Δafter the primary cycle 0.7Δ(the lateral displacement angle was greater than 1/40) when it was deemed as destroyed with a sufficient resistance loss.The test observations of specimen TIW-d were almost consistent with those of specimen TIW-w;the only difference was that the extrusion failure at both ends of the Zhongmo and transverse cracks with a width of up to 4 mm and a length of up to 20 cm were observed due to mutual dislocation between the Qunban elements in TIW-d,as illustrated in Fig.8(e)-8(g).
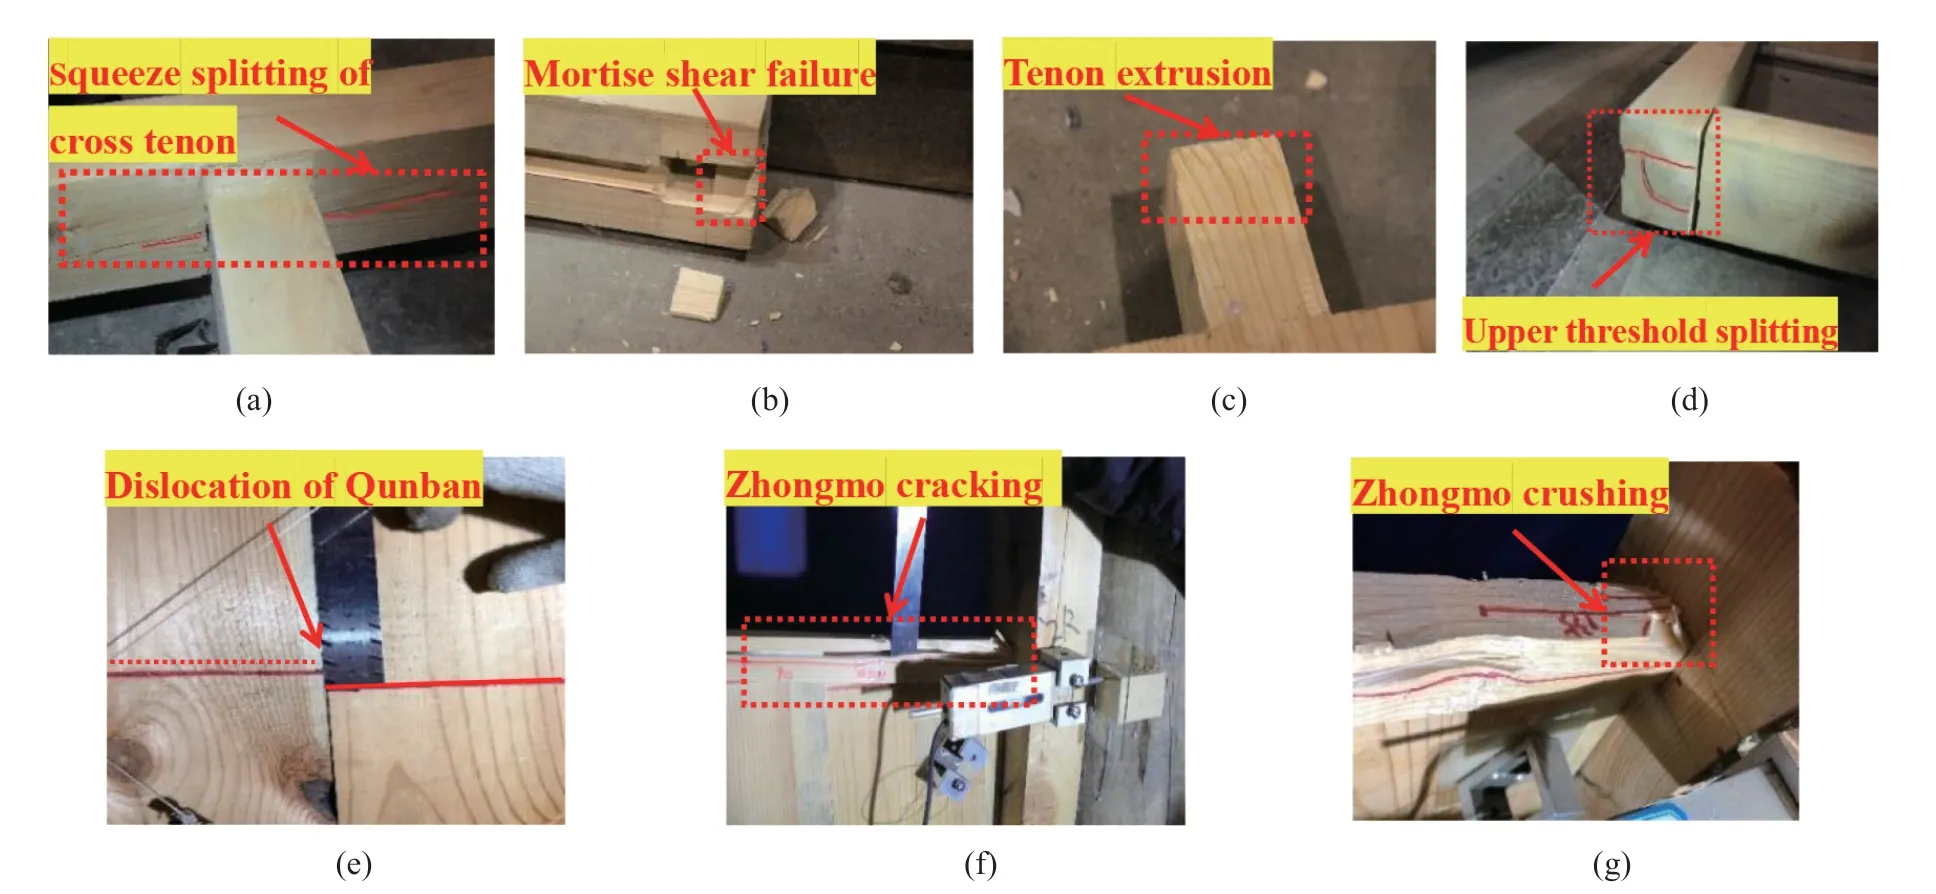
Fig.8 Typical failure modes of TIWs
3.1.2 Timber frame with timber infill wall
Specimen TF was loaded up to the trailing cycle 1.875Δafter the primary cycle 2.5Δ(the lateral displacement angle was greater than 1/15) when it was deemed as destroyed with negative bearing capacity.The column and beam did not suffer obvious damage except the deformation of the M&T joints.The deformation state of specimen TF at displacement of 2.5Δis shown in Fig.9(d).Due to the initial clearance between the M&T joints,the M&T connections did not sustain load at the early loading phase.When the horizontal displacement was loaded up to 0.15Δ,a small “squeak” sound was emitted,indicating the M&T connections of specimen TF were under loading and squeezed each other.When the lateral displacement reached 0.7Δ,the splitting sound of the timber fiber increased gradually as a result of the extrusion and friction between the mortise and tenon,the tenon started to be pulled out from the mortise and the obvious compression,and the upper and lower edges of the mortise appeared to split due to a large relative rotation between the beam and the columns of specimen TF,as shown in Figs.9(a)-9(b);and the failure mode of the bare timber frame was consistent with the results obtained by Liet al.(2018).Furthermore,due to the mutual rotation and extrusion between the pipe foot mortise at the bottom of the column and the mortise of the column foundation,the column root was raised nearly 20 mm,as shown in Fig.9(c).
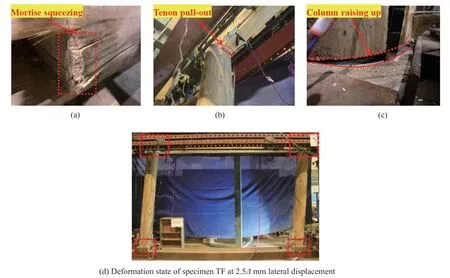
Fig.9 Failure modes and the maximum deformation state of specimen TF
Specimen TFTIW-w and TFTIW-d were also loaded up to the trailing cycle 1.875Δafter the primary cycle 2.5Δ(the lateral displacement angle was greater than 1/15).The deformation state of specimens TFTIW-w and TFTIW-d at a displacement of 2.5Δis shown in Figs.10(j) and 10(k),respectively.At the early stage of lateral loading,the TFTIW did not have a large deformation response due to the gap between the TIW and the TF (Fig.10(a)).With the increasing displacement,a loud squeak sound was made due to the squeeze and slip between the TIW and the TF.The Zhongmo suffered from slight uplift due to the dislocation of the Qunban elements,causing extrusion deformation between the Zhongmo and the lower threshold.When the lateral displacement of the specimen TFTIW-w reached 1.875Δ,the Qunban element of the TIW suffered from obvious dislocation up to 8 mm (Fig.10(b)).Both ends of the Zhongmo were seriously damaged due to bending and shear deformation,in which the width of transverse cracks could be up to 5-6 mm and could be up to 100 mm in length.Obvious extrusion and destruction was observed between the Zhongmo and the outer and inner jamb as well as the cross joint consisting of the outer and inner jamb and the middle threshold (Fig.10(c)),and the same failure location was found in the work of Aliet al.(2012) and Meireleset al.(2012).However,for the specimen TFTIW-d,the two ends of Zhongmo suffered more serious extrusion and damage compared with specimen TFTIW-w (Fig.10(d)).This difference is because the existence of the cross tenon slows down the damage of specimen TFTIW-w.When loading to a larger displacement for specimens TFTIW-w and TFTIW-d,for brevity,the identical failure phenomena are as follows.The planting pin was subjected to irrecoverable shear deformation due to the out of plane warping and bulging of the TIW (Fig.10(e)).The loading state of the outer and inner jamb was converted from the compression state to compression-bending state.The tenons that pulled out from the mortise of the timber frame were not restored to their original position due to the contact between the M&T,which caused them to simultaneously pull out at both ends of the timber beam (Fig.10(f)).At the same time,cracks appeared at the upper threshold edge due to the interaction between TIW and the TF(Fig.10(g)).Furthermore,the bottom of the column and inner frame were raised (Figs.10(h) and 10(i)).Typical failure modes of specimens TFTIW-w and TFTIW-w are shown in Fig.10.
3.2 Hysteretic curves
3.2.1 Timber infill wall
The hysteretic curves of TIW are shown in Fig.11.Note that the hysteretic curve obtained does not consider theP-Δeffect.From a holistic point of view,the hysteretic curves of TIW exhibited a “Z” pattern,demonstrating the successive slippage features between the contact surfaces of components in timber infill walls.At the early stage of loading,the hysteresis curve showed a plump spindle shape,the hysteresis loop was small and the deformation of the structure could be restored after the removal of the loading,showing that the structure was in the elastic stage.As the lateral displacement increased,the joints of the TIW gradually squeezed each other,and the slipping friction force was gradually increased,which led to irreversible deformation and the nonlinear increase of the slope of the hysteresis curve,indicating the structure was in the elastic-plastic stage.Along with the continued increase of lateral displacement,the slope of the curve slowed down due to the accumulation of irreversible ductile deformation between the joints.When the control displacement of specimen TIW-w and specimen TIW-d reached 63 mm and 18 mm,respectively,the slope of the curve began to slow down and decreased gradually.
Furthermore,due to neglecting the grille function(door and window openings) in TIW,the opening rate of specimens TIW-w and TIW-d was 0.645 and 0.588,respectively,which can be considered approximately equal.However,the hysteretic loop of specimen TIW-w was comparatively more plump than that of specimen TIW-d.This result is due to the fact that the arrangement of joints and openings as well as the height of Qunban were different.Furthermore,it was found that the maximum lateral displacement of TIW-d was relatively smaller than that of TIW-w,which is mainly occurred due to the existence of the middle threshold of TIW-w,which increased the resistance to deformation of the TIW.
3.2.2 Timber frame with timber infill wall
The hysteretic curves of the three TFTIWs are shown in Fig.12.It can be seen that the hysteretic curves of TFTIWs were all reversed “Z” shape,which indicated that there was obvious slipping characteristics between the components.The hysteretic loops were antisymmetric for all specimens,especially for specimen TFTIW-d.When compared with that of TF,the hysteretic loops of specimens TFTIW-w and TFTIW-d were more plump;similar phenomena were also presented in Vieux-Champagne′s study (Vieux-Champagneet al.,2014).This phenomenon is due to the accumulation of ductile deformation at the joint of the TIW,which increases the energy dissipation of TFTIW.

Fig.12 Hysteretic curves of TFTIWs: (a) specimen TF;(b) specimen TFTIW-w;and (c) specimen TFTIW-d
Figure 12(a) shows the hysteresis curves of specimen TF.When the loading magnitude was less than about 10 mm,the hysteretic loop demonstrated a full spindle shape.When the lateral displacement was in the range of 10-50 mm,the hysteresis loop developed a bow shape.When the displacement magnitude exceeded 50 mm,the hysteretic loop became the “Z” pattern.The hysteresis loops demonstrated a pinching effect for any relatively larger displacement,which was mainly due to the accumulation of ductile deformation at the M&T joint,demonstrating the degradation of the energy dissipation.
The hysteretic curves of specimens TFTIW-w and TFTIW-d are shown in Figs.12(b) and 12(c).At the early stage of lateral displacement,the hysteresis loop was plump and fusiform.When the horizontal displacement exceeded 40 mm,the hysteresis loop changed from fusiform to a “Z” shape and illustrated a significant pinch effect due to the damage of components in the TIW and plastic deformation between the joints.The overall shape of the hysteretic curves obtained for TFTIW was in agreement with the findings of Vieux-Champagneet al.(2014),Huanget al.(2018) and Crayssacet al.(2018).
4 Discussion of the effect of the timber infill wall
4.1 Effects of timber infill wall on hysteretic performance
To investigate the effects of TIW on the hysteretic behavior of TFTIW,the envelope curves of TFTIW and TIW are shown in Fig.13.It can be seen from Fig.13(c)that the carrying and deformation capacity of TIW-w were obviously better than that of TIW-d,which can be explained as: the rigidity of the structure was increased by the middle threshold in TIW-w,ensuring the integrity and stability of the whole structure,therefore,TIW-w can bear higher loads than TIW-d.As illustrated in Figs.13(a) and 13(b),when the horizontal displacement exceeded 135 mm,the loading capacity of specimen TF decreased as the displacement increased;however,as the carrying capacity of specimens TFTIW-w and TFTIW-d gradually increased,a similar phenomenon also was found in a traditional timber structure with infill walls by Crayssacet al.(2018) and Huanget al.(2018).One primary reason for this is that the TIW increased the lateral stiffness of the TF.Compared with specimen TF,specimens TFTIW-w and TFTIW-d had higher bearing capacity and better deformation capacity (shown in Fig.13(d)),which means that TIW had a significant enhancement to the bearing and deformation capacity of TF and improved its seismic behavior.It can also be seen from Figs.13(a) and 13(b) that the superposition value of the bearing capacity of specimen TIW and TF was consistent with that of specimen TFTIW under positive displacement;however,there is a difference under the negative displacement,which is due to the initial defects such as wood splitting as well as errors in fabrication and installation.
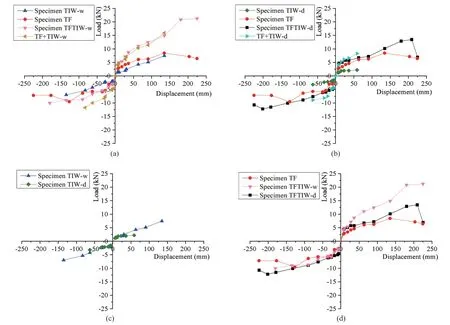
Fig.13 Envelop curves of specimen TIW and specimen TFTIW: (a) specimen TIW-w and TFTIW-w;(b) specimen TIW-d and TFTIW-d;(c) specimen TIW-w and TIW-d;and (d) specimen TFTIW-w and TFTIW-d
In this study,the yield point of the envelop curve was considered as a critical parameter,which was determined approximately by the deformation rate method (Liet al.,2015).The deformation rate method is presented in the Fig.14.The yield point identified by point “y” is the point with the maximum curvature.The peak point “p”and the ultimate point “u” represent maximum load and ultimate load,respectively,which were directly obtained from the envelop curves.
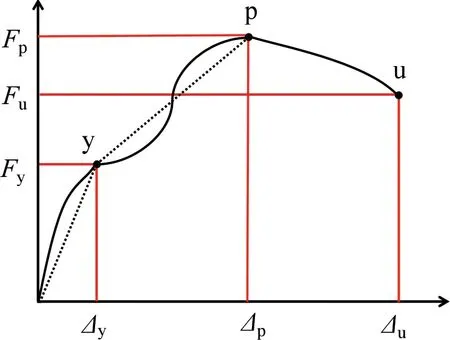
Fig.14 Deformation rate method
After the yield point and the ultimate point were determined,the ductility of timber structure can be determined by the ductility coefficient,which is as follows:
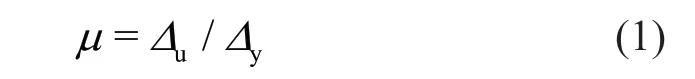
whereΔuandΔyare the horizontal displacements corresponding to the bearing capacity of yield and ultimate,FyandFu,respectively.
The experimental results of the loading capacity of yield,peak and ultimate,and the corresponding horizontal displacements,as well as the ductility index of the five specimens are shown in Table 2.The yield displacement of the TIW and the TFTIW was about 6 mm and 9 mm,respectively.The initial stiffness between specimens TIW-w and TIW-d had little difference;however,the initial stiffness of specimen TFTIW-w and specimen TFTIW-d was remarkably larger than that of specimen TF,indicating that TIW had a noteworthy influence on the initial stiffness of the TF,which was consistent with the results studied by Vieux-Champagneet al.(2014),Huanget al.(2018) and Crayssacet al.(2018).The comparison of initial stiffness from these tests are listed in Table 3.It can also be seen from Table 2 that the ductility ratio of the TIW and the TFTIW changed in the range of 9.13-22.06 and 24.44-25.16,respectively,demonstrating all the specimens had reasonably good ductility.The mean value of the positive and negative ductility coefficient of specimen TIW-d is the smallest(μ=9.92),which is 0.46 times that of specimen TIW-w.However,the ductility coefficient of TFTIW and the TF had little difference,which indicated that different forms of TIWs had little effect on the ductility of TFTIWs.
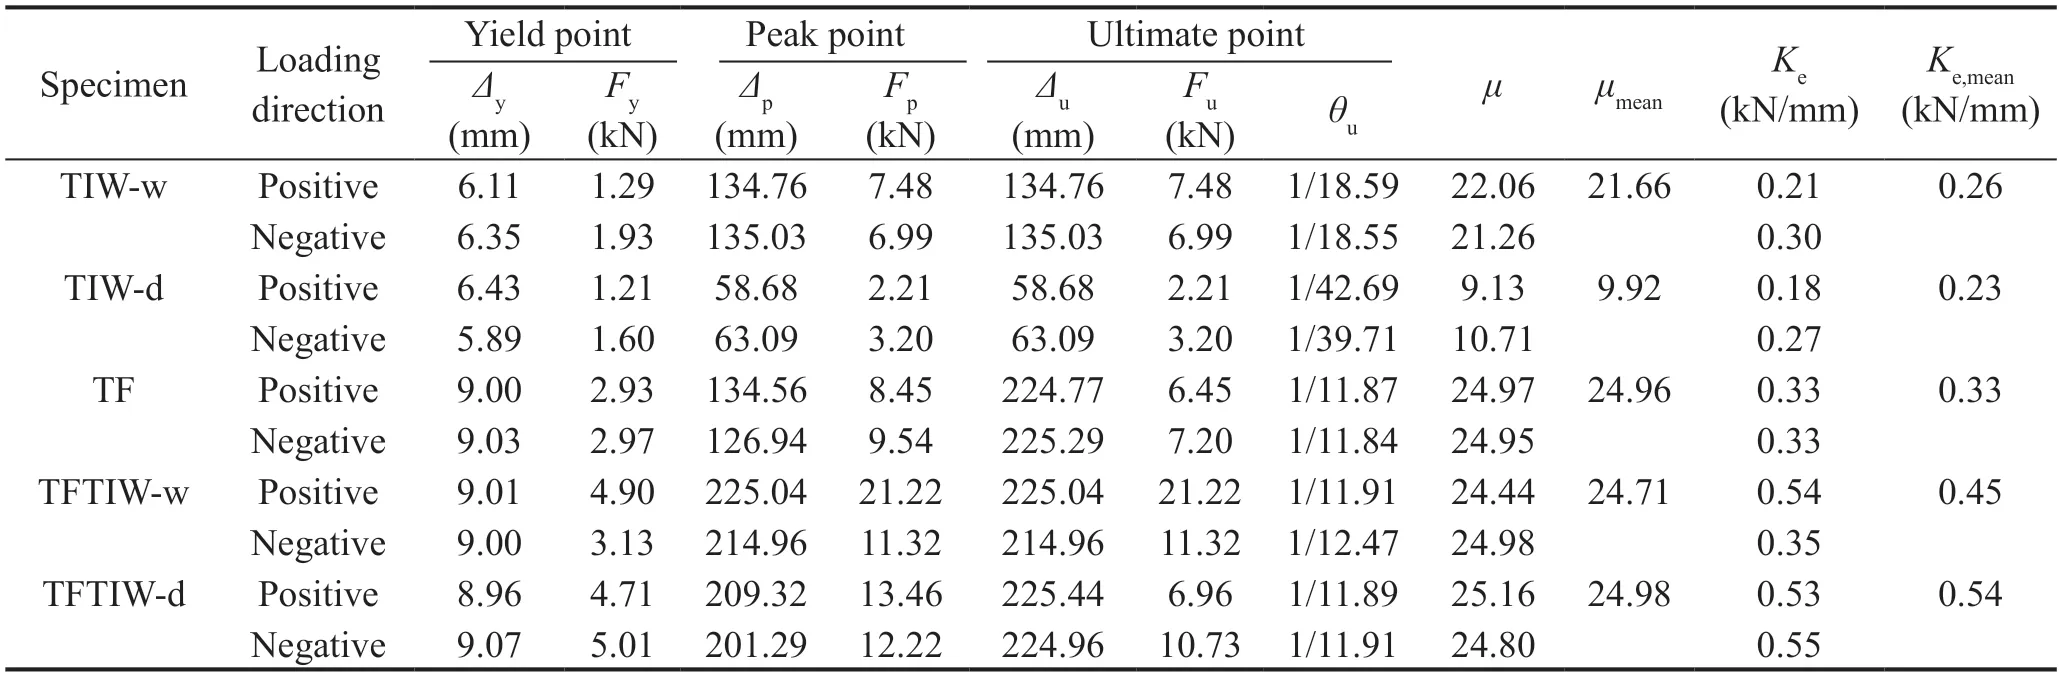
Table 2 Strength and stiffness and ductility coefficient of test specimens

Table 3 Comparison of initial stiffness of ancient wooden frames
To further quantify the influence of TIW on the hysteretic performance of TFTIW,the ratios of mechanical parameters of the specimen TFTIW to those of the specimen TF are presented in Fig.15,from which the ratios,such as the yield,peak,ultimate loading capacity and initial stiffness,can be found.For specimen TFTIW-w,as illustrated in Fig 15(a),the increase ratios of the yield load and the peak load can reach 36%and 81%,respectively,and the ultimate load of the specimen TFTIW-w was also significantly affected by the TIW with a maximum increase ratio of about 138%.Furthermore,the initial stiffness can also be increased up to 36% due to the existence of the infill wall.For specimen TFTIW-d,as shown in Fig 15(b),the yield load and the peak capacity can increase by up to 65% and 43%,respectively,when compared to that of specimen TF.The ultimate load was remarkably improved by TIW and the increase ratio reached 30%,and the initial stiffness of specimen TFTIW-d can be increased up to 64% due to the existence of the infill wall.Throughthe above analyses,it can be found that the TIW can remarkably increase the bearing capacity and the initial stiffness of the TF.Furthermore,there is a significant difference in the increase ratios of the ultimate load between specimens TFTIW-w and TFTIW-d,where the ultimate load of the specimen TFTIW-w was increased to 108% of that of the specimen TFTIW-d.This can be explained as follows: specimen TIW-w can bear higher load and more damage than specimen TIW-d under the ultimate state due to the existence and contribution of the cross tenon in specimen TIW-w.
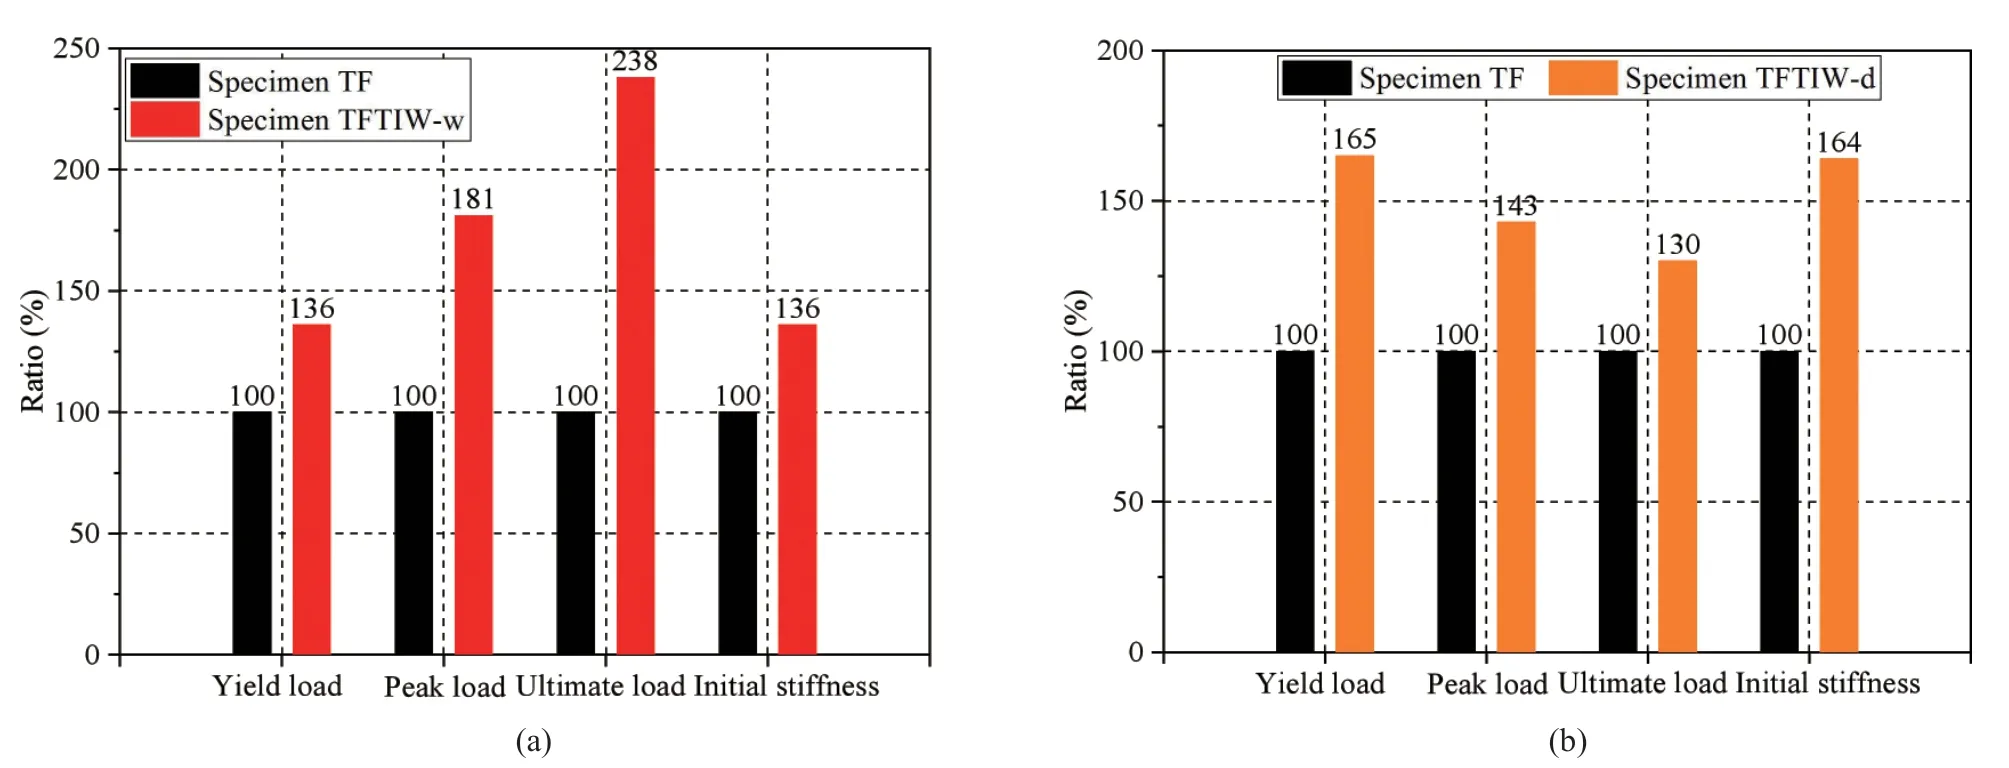
Fig.15 Ratios of mechanical parameters of specimen TFTIW to those of specimen TF: (a) specimen TF and TFTIW-w;and(b) specimen TF and TFTIW-d
To separately analyze the effect and contribution laws of TIW on the bearing capacity of TFTIW during the loading process,the contributing carrying capacity(Fc) and loading displacement (D) curves for the TIW-w and TIW-d were obtained based on the skeleton curves presented in Fig.13(d),as shown in Fig.16,in which the bearing capacity of the specimens was taken as the average values of the absolute values of the positive and negative bearing capacity.The bearing capacity contribution of the TIW increased gradually as the loading displacement increased.It can also be concluded that the TIW began to make a substantial contribution to the bearing capacity of the TFTIW when the loading displacement approached 27 mm or 1/100 of the column height,and this contribution continued almost linearly until the severe deformation and crush damage failures of the TIW.In addition,based on the results illustrated in Fig.16,the relationships between carrying capacity contribution and loading displacement of two types of TIW were fitted linearly,which can be expressed as Eqs.(2) and (3),respectively,where the determination coefficientR2was 0.9739 and 0.9331,respectively,indicating that the proposed formulae can accurately reflect the contribution laws of the TIW to the bearing capacity of the TF during the loading process.
Fig.16 Contribution of specimen TIW on bearing capacity of TFTIW

whereFcis the bearing capacity contribution for TIW,which amounts to the difference between the carrying capacity of TFTIW and that of TF,andDstands for the loading displacement.
4.2 Effects of the timber infill wall on stiffness degradation
To analyze the degradation behavior of lateral stiffness for TFTIW and TIW,the secant stiffness of the load-displacement hysteresis loops was computed for each major cycle consistent with JGJ 101-2015:Specification for Seismic Test of Buildings (2015),where the secant stiffness can be calculated according to Eq.(4):
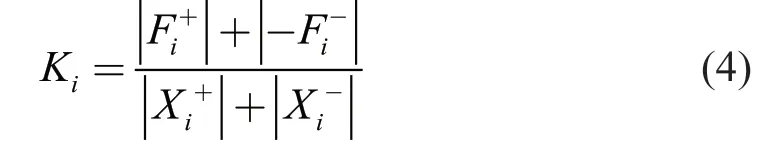
A comparison of stiffness degradation curves of all the tested specimens is shown in Fig.17.It is clear from Fig.17 that the stiffness of all the specimens gradually decreased as the amplitude of the cycle increased.As shown in Fig.17(a),with the increase of the lateral displacement,the degree of decline of the stiffness in TIW-d was obviously greater than that in TIW-w.The stiffness of TIW decreased drastically in earlier stages;one possible reason for this is that the TIW was squeezed with beams and columns resulting in irreversible extrusion deformations at contact surfaces.As shown in Fig.17(b),at the first primary loading cycle,the stiffness of specimens TFTIW-w and TFTIW-d was 0.52 kN/mm are 0.62 kN/mm,respectively,which was larger than that of specimen TF (0.39 kN/mm).This was mainly due to the contribution of the TIW on the initial stiffness of TF.The initial stiffness of specimen TIW-w was obviously greater than that of specimen TIW-d,in which the difference was 0.03 kN/mm (see Fig.17(a)).However,the stiffness of specimen TFTIW-w was less than that of specimen TFTIW-d,which may be attributed to the errors caused by manual manufacturing and installation of components as well as the discreteness of wood.When the lateral displacement increased from 6.75 mm (0.075Δ)to 27 mm (0.2Δ),the stiffness of all the specimens decreased drastically due to the accumulation of damage and plastic deformation between the components,where the overall stiffness of the specimen TFTIW-d decreased by 66%.When the amplitude of the cycle was larger than 90 mm (1Δ),the lateral stiffness of specimens TFTIW-w and TF was maintained at 0.08 kN/mm and 0.04 kN/mm,respectively,while the secant stiffness of specimen TFTIW-d gradually declined from 0.09 kN/mm to 0.04 kN/mm,as shown in Fig.17(b),indicating that TIW had little influence on the residual stiffness of TFTIW when loading to a relatively large displacement.
To study the influence of the TIW on the degree of stiffness degradation of the TFTIW during the loading process,based on the stiffness degradation curve shown in Fig.17,the degradation factors of the stiffnessλiof the specimens are defined as:

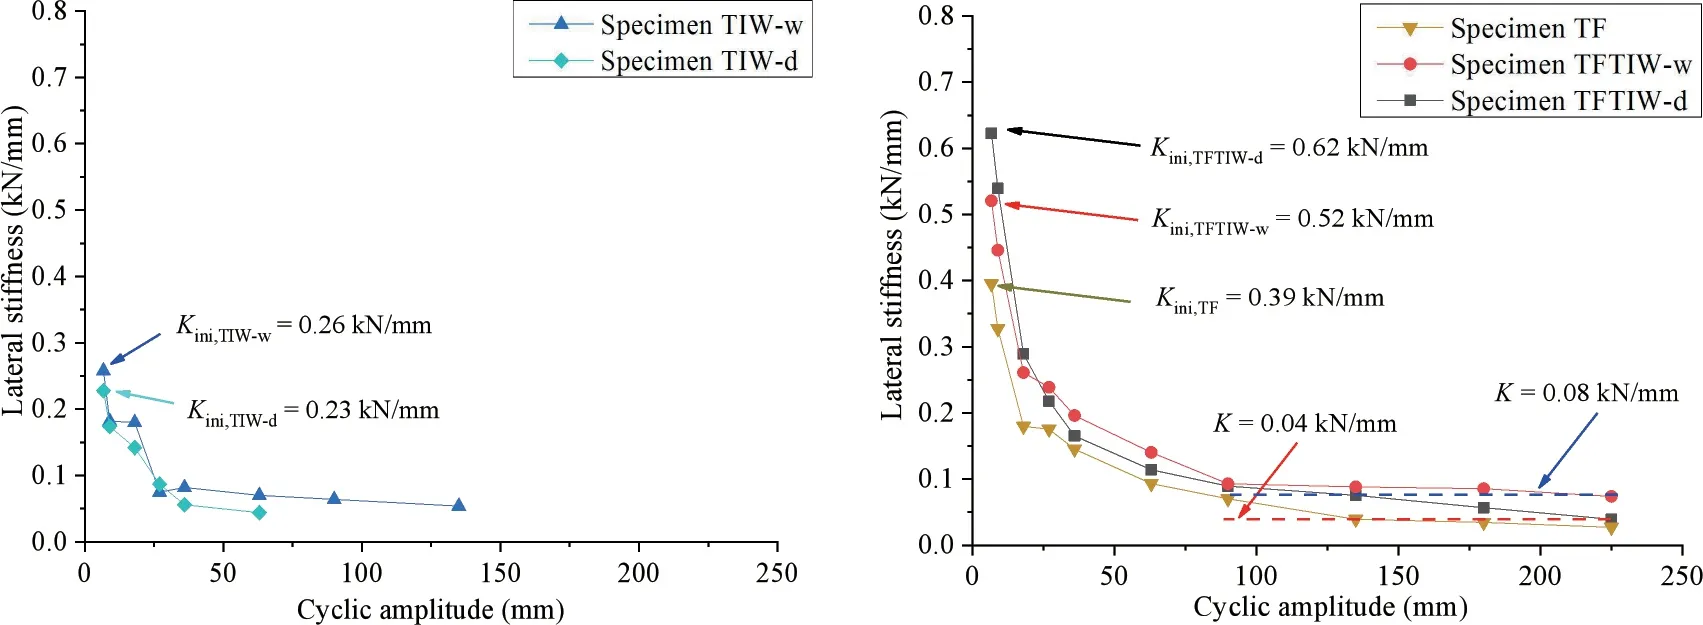
Fig.17 Stiffness degradation curve of tested specimens: (a) specimen TIW-w and TIW-d;and (b) specimen TF and TFTIW
whereK0is the initial stiffness at the first primary amplitude of cycle;Kis the stiffness of the trailing amplitude of cycle;andiis the specimen TF,TFTIW-w,TFTIW-d,respectively.
Figure 18 illustrates the stiffness deterioration factors of the tested specimens.It can be clearly noted that the degradation amplitude of the stiffness of the three specimens was generally consistent,indicating the TIW had little influence on the stiffness degradation level of the TFTIW during loading process.While some differences can also be observed from Fig.18,the degradation factors of the stiffness basically maintained at a constant (λTFTIW-d=λTF=0.90,λTFTIW-w=0.85) under the large deformation,where the degradation rate of the stiffness of TFTIW-w was less than that of TFTIW-d,one primary reason is that TIW-w,compared with TIW-d,had a more complex structure feature (the middle threshold and the vertical frame formed a cross joint),with higher overall stiffness characteristics,especially,whose role was more fully played in the case of large deformation.

Fig.18 Stiffness degradation factor curves of specimen TF and TFTIW
To separately analyze the effect and the contribution laws of TIW on the stiffness of TFTIW during the loading process,the contributing stiffness (kc) and loading displacement (D) curves for the TIW-w and TIW-d were obtained based on the stiffness degradation curves presented in Fig.17(b),as shown in Fig.19.It is clear that the stiffness contribution of the TIW dramatically degraded when the loading displacement was increased from zero to 63 mm or 1/43 of the column height.When the loading displacement was greater than 63 mm,the amount of the stiffness contribution tended to moderate.This is due to repeated extrusion and friction between the joints of the TIW,which made the critical components of TIW suffer irreversible plastic deformation,resulting in a loss of the stiffness contribution.It can also be seen that the variation law of stiffness contribution of TIW was consistent with those of stiffness in pure TIWs as shown in Fig.17(a).Furthermore,based on the results illustrated in Fig.19,the relationships between stiffness contribution and loading displacement of two types of TIWs were fitted nonlinearly,which can be expressed as Eqs.(6) and (7),respectively,where the determination coefficientR2was 0.9554 and 0.9913,respectively,which showed that the proposed formulae can accurately reflect the contribution laws of the TIW to the stiffness of the TF during the loading process.
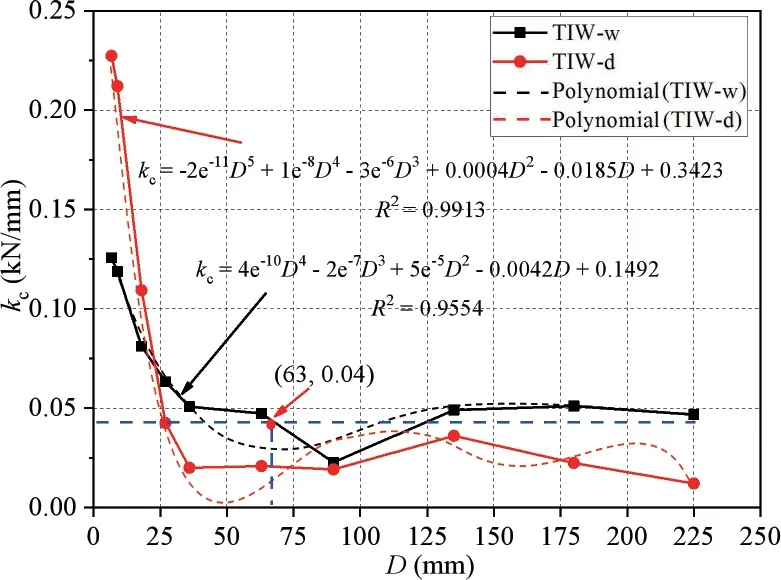
Fig.19 Contribution of specimen TIW on stiffness of TFTIW
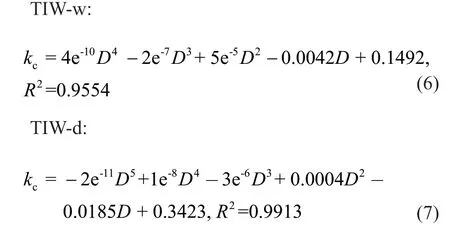
wherekcis the contribution of stiffness for TIW,which is equal to the difference between the stiffness of TFTIW and that of TF,andDrepresents the loading displacement.
4.3 Effects of the timber infill wall on strength degradation
Under the action of reciprocating loads,the damage to the structural members and connections continuously accumulates,which leads to the strength deterioration corresponding to the strength decline resulting from successive cycles for a given displacement.According to JGJ 101-2015 (2015),the strength deterioration factorφi,jis defined as:

whereXiis 75% of the corresponding primary cycle,is positive (negative) load defined at the maximum displacement,Xi,of thejth trailing cycle of theith primary cycle;is positive(negative) load,atXi,ofith primary cycle;iis the primary cycle;andjis the trailing cycle,which can be up to 6.
The relationship curves between the strength degradation rate and number of trailing cycles for TFTIW and TIW are presented in Fig.20,where the overall strength degradation factor of TFTIW was obviously higher than that of TIW.Furthermore,the strength degradation coefficient of the tested specimens,on the whole,showed a downward trend due to the continuous accumulation of plastic deformation and mutual extrusion between the components during reversed loading.When the number of subsequent cycles was less than 20 (0.7Δ) or 1/38 of the column height,the strength degradation coefficient of TIW and TFTIW was close and maintained at about 0.7 and 0.75,respectively,indicating that the TIWs and the M&T joints have similar resistance to cumulative failure.With the increase of the number of subsequent cycles (larger than 20),the strength degradation coefficient of TIW and TFTIW decreased drastically.This phenomenon can be explained as follows: under large cycle amplitude,the M&T joints incur irrecoverable compressive plastic deformation perpendicular to the wood grain direction,and simultaneously lose tightness.In addition,the serious splits and damage between components in the TIW weakened the overall strength of the specimens.The degree of decline of TIW was higher than that of TFTIW,because the TIW as well as the interaction between TIW and TF contributed to the strength of the TFTIW under large deformation.In addition,it was found that the strength degradation coefficient of two types of TFTIW was slightly higher than that of TF(Fig.20(b)),indicating that the existence of TIW can slow down the strength degradation of TFTIW.In the high cycle amplitudes,the strength degree of decline of specimen TIW-w was lower than that of specimen TIW-d (Fig.20(a)),which is primarily induced by the contribution of the middle threshold and cross tenon joint in specimen TIW-w.

Fig.20 Strength degradation curve of TFTIW and TIW: (a) specimen TIW-w and TIW-d;and (b) specimen TF and TFTIW
4.4 Effects of timber infill wall on energy consumption
The amount of dissipated energy in a structure is a critical parameter in the evaluation of its seismic behavior,and is determined by calculating the accumulated area of hysteretic loops (Crayssacet al.,2018).The energy consumption curves of the tested specimens are illustrated in Figs.21 and 22.
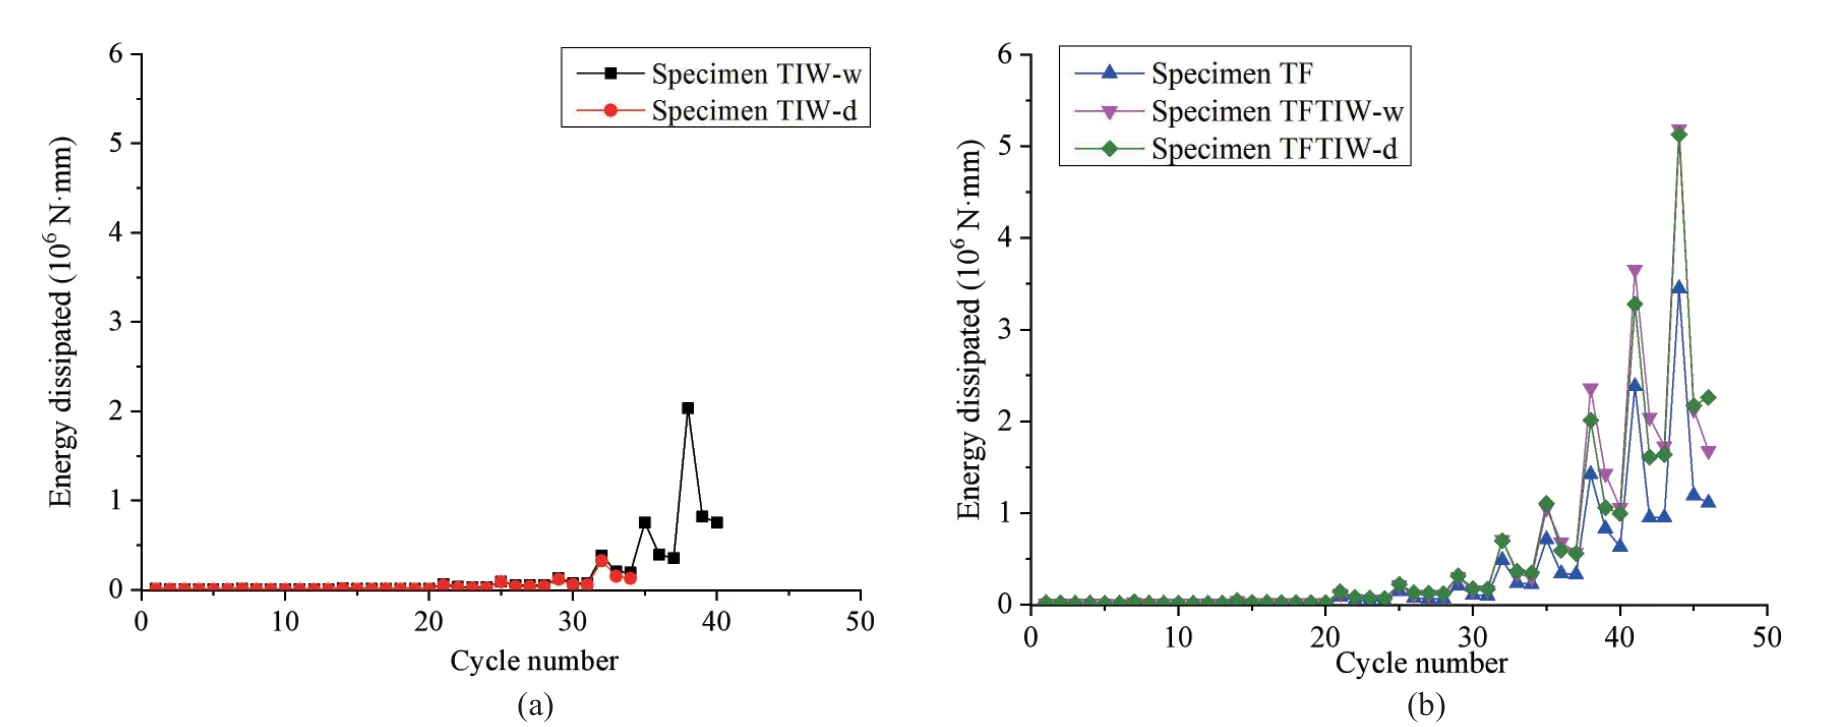
Fig.21 Comparisons of energy dissipation curves of each hysteresis cycle: (a) specimen TIW-w and TIW-d;and (b) specimen TF and TFTIW
As shown in Figs.21(a) and 21(b),it can be seen that the amount of energy dissipation at each loading cycle for all the specimens was not significantly different when the number of cycles ranged from 1 to 22.When the number of cycles was larger than 22,the difference between the energy dissipation of each specimen was more prominent due to accumulation of the nonlinear damage between M&T joints and members.In addition,the major cycles always consumed more energy than the subsequent cycles.As illustrated in Fig.22(a),when compared to specimen TIW-d,the cumulative energy contribution rate of specimen TIW-w in each level of the cycle is larger.These findings can be explained as follows: the construction of specimen TIW-w included a middle threshold,are compared to specimen TIW-d,during the cycle of loading,the continuous plastic deformation of the cross tenon as well as the serious damage and split of the joints all played a vital role in the energy consumption of the TIW,while the results investigated by Vieux-Champagneet al.(2014) found that the dissipated energy was almost exclusively due to the deformation of joints rather than to infill damage.In addition,it was clear from Fig.22(b) that the cumulative energy consumption of the specimens increased as the loading cycle increased.When the loading cycle was larger than 22,the difference of the cumulative energy consumption between the TF and the TFTIW became larger,indicating TIW played a more and more important role in cumulative energy consumption.
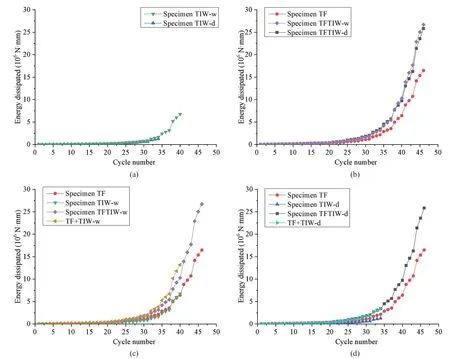
Fig.22 Comparisons of cumulative energy consumption curves of specimens: (a) specimen TIW-w and TIW-d;(b) specimen TF and TFTIW;(c) specimen TIW-w and TFTIW-w;and (d) specimen TIW-d and TFTIW-d
When the specimens were loaded to the maximum number of cycles,it can be seen that the cumulative energy dissipation of specimens TFTIW-w and TFTIW-d was very close and approximate to 2.6×10⁷N·mm,while the cumulative energy dissipation of specimen TF was 1.6×10⁷N·mm,and the cumulative energy consumption of TFTIW was about 1.6 times than that of TF,in which the proportion of energy dissipation of the TF as well as the TIW was about 62% and 38%,respectively,indicating that the TIW had a vital role in the process of cumulative energy consumption of the TFIW and significantly increased the energy consumption.Therefore,the role of TIW in energy dissipation of timber frame structures cannot be ignored.As shown in Figs.22(c) and 22(d),in addition to the above phenomena,it can also be found that the cumulative energy consumption of TF was obviously less than that of TFTIW,while the total cumulative energy consumption of TIW and TF was consistent with that of TFTIW,indicating that TIW significantly enhanced the total energy dissipation of TFTIW due to the irreversible cumulative damage and deformation between members in TIW.
To separately analyze the effect and the contribution laws of TIW on the energy dissipated by TFTIW during the loading process,based on the energy consumption curves shown in Fig.22(b),the contributing energy (Ec)and cycle number (N) curves for the TIW-w and TIW-d were obtained,as shown in Fig.23.It is observed that the energy dissipation contribution of the TIW slowly increased when the cycle number varied in the range of zero to 32 (or 1/43 of the column height).When the cycle number was greater than 32,the energy dissipation contribution of TIW sharply increased and had a significant effect on the energy consumption of the structure,which can be explained as follows: the repeated extrusion and friction between the joints of TIW dissipated a lot of energy.Similarly,based on the data shown in Fig.23,the relationships between the energy dissipation contribution and cycle number of two types of TIWs were nonlinearly fitted,which can be described as Eqs.(9) and (10),respectively,where the determination coefficientR2was 0.9949 and 0.9955,respectively.This illustrates that the proposed formulas can correctly reveal the contribution laws of the TIW to the energy dissipation of the TF during the loading process.

Fig.23 Contribution of specimen TIW on energy dissipated of TFTIW
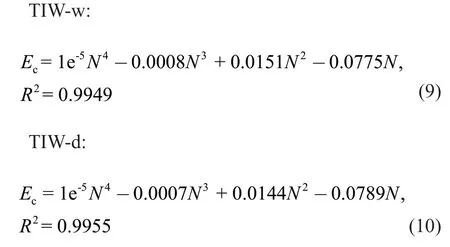
whereEcstands for the contribution of energy dissipated for TIW,which is equivalent to the difference between the energy dissipation of TFTIW and that of TF,andNrepresents the cycle number.
4.5 Effect of timber infill wall on tenon pull-out
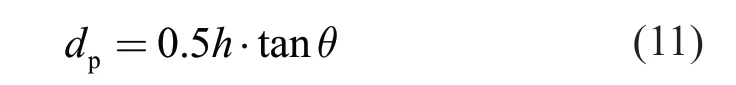
To assess the effect of TIW on the tenon pull-out,the amount of tenon pullingdpcan be defined as a linear function related to the tenon heighthand the rotationθ,based on the study carried out by Xieet al.(2019a),as shown in Eq.(11) and Fig.24.
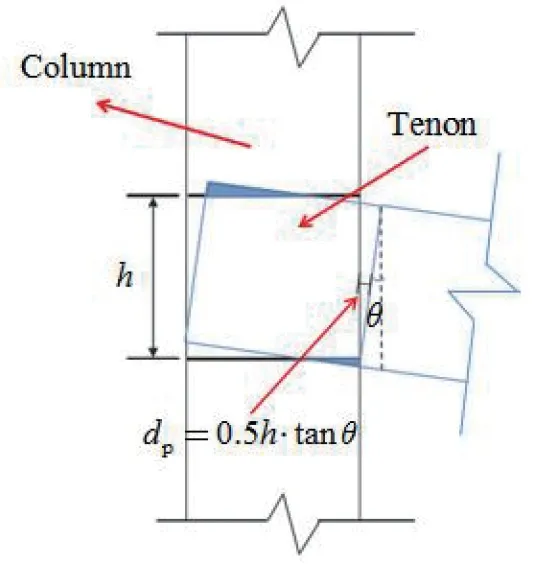
Fig.24 Simplified calculation model for tenon pull-out
A comparison of the tenon pulling between specimen TF and Eq.(11) is illustrated in Fig.25.It can be seen that the results of specimen TF show good agreement with the theoretical calculation results.In addition,based on the test results,the relationship between the amount of tenon pull-out and the loading displacement of specimen TFTIW and specimen TF was obtained,as shown in Fig.26.The amount of tenon pulling increased approximately linearly with the increase of the loading displacement.It was also found that the tenon pull-out amount of TFTIW showed a decreasing trend during the loading process,when compared to that of specimen TF.This is because the existence of TIW significantly increased the integrity and stability of the TF,and the interaction reduced the tenon pull-out amount of the TF.

Fig.25 Comparison of the experimental and theoretical tenon pull-out for specimen TF

Fig.26 Tenon pull-out amount and displacement relationship of specimens TF and TFTIW
To separately investigate the influence law of the two types of TIWs on the tenon pulling amount of the TF,the relationship curve between the reduction amount of tenon pulling (Δdp) and the rotation (θ) for TFTIW was obtained,as shown in Fig.27.It can be seen that the amount of tenon pull-out of TFTIW-w was lower during the loading process when compared to TFTIW-d,which is due to the existence of the middle threshold in TIW-w,making the TF have higher rigidity and less deformation.Based on the results illustrated in Fig.27,the relationship between the reduction amount of tenon pulling and the rotation of two types of TFTIWs were linearly fitted,which can be described as Eqs.(12) and(13),respectively,in which the determination coefficientR2was 0.9729 and 0.9573,respectively.This illustrates that the proposed formulas can correctly reveal the influence laws of the TIW on the tenon pulling of the TF during the loading process.
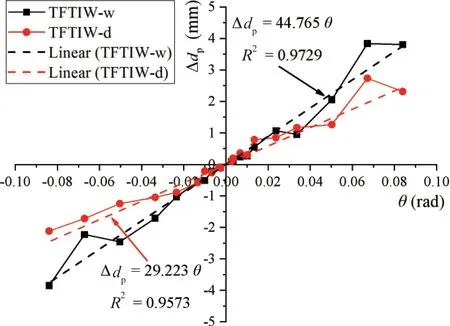
Fig.27 Relationship of reduction of tenon pull-out and rotation for specimens TFTIW-w and TFTIW-d

whereΔdpstands for the reduction of tenon pulling for TFTIW,which is equivalent to the difference between the tenon pulling amount of TFTIW and that of TF,θrepresents rotation,which is equal to the ratio of loading displacementDto column heightH.
5 Conclusions
This study assessed the influence of TIW on the seismic behavior of TFTIW.Two types of 1/2 scaled timber infill wall models and three 1/2 scaled timber frame models with different types of timber infill walls were tested under low-cyclic reversed loading.The failure modes,hysteretic behavior,loading capacity,ductility,stiffness deterioration,strength deterioration,and energy consumption capacity of these specimens were analyzed,based on the effects and influencing law of TIW on the seismic behavior of TFTIW.According to the analyses and comparisons of the experimental results,the following conclusions are drawn:
(1) The failure modes of the two types of TIWs were concentrated on the dislocation of Qunban,extrusion deformation and longitudinal cracks at both ends of Zhongmo,shear failure of the mortise and extrusion deformation of tenon of the joints as well as the extent of the original cracks and continuous growth of new cracks in various components.The failure modes of TFTIW included the failure of TIW,shear deformation of the planting pin,pull-out damage of the tenons,and extrusion deformation of the M&T joints of TF.
(2) All five specimens exhibited a high ductility (the ductility coefficient was 9.92 in the TIW-d,for example).The bearing and deformation capacity of specimen TIW-w was obviously better than that of specimen TIW-d.When compared with the TF,the peak loads of specimens TFTIW-w and TFTIW-d increased by 81%and 43%,respectively,indicating that the TIW had a remarkable enhancement effect on the ultimate carrying capacity of TFTIW.However,the ductility index of specimens TFTIW and TF was close,and the ductility of TFTIW was not improved by TIW.
(3) As the lateral displacement increased,the stiffness of all the specimens deteriorated gradually,in which the degree of reduction in the stiffness of TIW-d was obviously greater than that in TIW-w.When compared with the TF,the initial stiffness of specimens TFTIW-w and TFTIW-d was improved 36% and 64% by the TIW,respectively,indicating the initial stiffness of the TFTIW can be effectively improved by the TIW.However,the TIW had little influence on the degradation level of stiffness of TFTIW.
(4) The strength degradation coefficient of the specimens was divided into two stages: steady stage and remarkable decline.The strength degeneration factor of two types of TFTIWs was slightly higher than that of the bare timber frame when the inter-story drift ratio exceeded approximately 0.02 rad.The existence of TIW can help to slow down the strength degradation of TFTIW.
(5) The TFTIW had a higher cumulative energy dissipation when compared to that in the TF (up to 60%increase),which indicated that that the TIW dissipated a large amount of energy and could remarkably improve the total energy consumption capacity of the TFTIW during the entire loading process.The amount of tenon pull-out of the specimens increased approximately linearly as the loading displacement increased,and the existence of TIW restrained the pull-out amount of the tenon from the mortise of TF.
(6) The displacement threshold for TIW to generate a substantive contribution to the TF,in terms of the carrying capacity and energy dissipation,was 1/100 and 1/43 of the column height,respectively.The displacement threshold was 1/43 of the column height when the stiffness contribution of TIW to TF tended to be constant.More attention should be given to the influence of TIW on the seismic behavior of timber structures,so seismic performance evaluation procedures for traditional timber structures can be improved to provide better guidance to the engineering practice.
Acknowledgement
The authors of this study appreciate and acknowledge the funding support of this project from the Scientific Research Fund of Institute of Engineering Mechanics,China Earthquake Administration (Grant No.2020EEEVL0410),the National Natural Science Foundation of China (Grant No.51878550),and the Foundation Research Project of Shaanxi Province (Grant No.2021JC-44).
杂志排行

Earthquake Engineering and Engineering Vibration的其它文章
- Innovative mitigation method for buried pipelines crossing faults
- Study on time-varying seismic vulnerability and analysis of ECC-RC composite piers using high strength reinforcement bars in offshore environment
- Optimization of design parameters for controlled rocking steel braced dual-frames
- Seismic response of selective pallet racks isolated with friction pendulum bearing system
- Reliability and sensitivity analysis of wedge stability in the abutments of an arch dam using artificial neural network
- Steel rings as seismic fuses for enhancing ductility of cross braced frames