Mesoscopic investigation on seismic performance of corroded reinforced concrete columns
2022-10-19JinLiuLiYanxiZhangRenboandDuXiuli
Jin Liu,Li Yanxi,Zhang Renbo and Du Xiuli
Key Laboratory of Urban Security and Disaster Engineering of Ministry of Education,Beijing University of Technology,Beijing 100024,China
Abstract: In addition to the normal service loadings,engineering structures may be subjected to occasional loadings such as earthquakes,which may cause severe destruction.When the steel rebar is corroded,the damage could be more serious.To investigate the seismic performance of corroded RC columns,a three-dimensional mesoscale finite element model was established.In this approach,concrete was considered as a three-phase composite composed of aggregate,mortar matrix and interfacial transition zone (ITZ).The nonlinear spring were used to describe the bond slip between steel and concrete.The degradation of the material properties of the steel rebar and cover concrete as well as the bonding performance due to corrosion were taken into account.The rationality of the developed numerical analysis model was verified by the good agreement between the numerical results and the available experimental observation.On this basis,the effect of corrosion level,axial force ratio and shear-span ratio on the seismic performance of corroded RC columns,including lateral bearing capacity,ductility,and energy consumption,were explored and discussed.The simulation results indicate that the mesoscopic method can consider the heterogeneity of concrete,to more realistically and reasonably reflect the destruction process of structures.
Keywords: reinforcement corrosion;reinforced concrete column;meso-scale;finite element analysis;seismic behavior
1 Introduction
A large quantity of reinforced concrete (RC)structures have been built and widely applied in construction engineering.RC structures are expected to maintain good working performance for a long time.However,chloride ion intrusion,concrete carbonization,and freeze-thaw cycles can cause corrosion of steel bars(Houet al.,2017).Reinforcement corrosion not only affects the normal service of the RC structures,but also may degrade the seismic performance,which can lead to serious damage.Therefore,it is of great engineering and scientific significance to study the mechanical properties of RC columns after reinforcement corrosion.
Many studies have investigated the cause and mechanism of steel rebar corrosion and the corrosion effects on the degeneration of bond slip between concrete and reinforcement bar.Xiaet al.(2013)studied the performance degradation of steel bars with different diameters under accelerated corrosion caused by simulated concrete carbonation and chloride ion intrusion.Zhanget al.(2010) investigated the corrosion mechanisms of steel bar in a general atmospheric environment and marine environment as well as the correlation between accelerated corrosion of steel bars in laboratory and natural corrosion.Wu and Yuan (2008)pointed out that ductility of corroded reinforcement became worse on the basis of a series of experimental tests and obtained the constitutive relation of corroded steel rebar.Through the regression analysis of plenty of test data,Fenget al.(2016) derived a model suitable for the change of bond-slip of corroded reinforced concrete,in which the ratio of concrete cover to rebar diameter and corrosion levels were considered.
The mechanical behavior of corroded RC columns,most notably the axial and eccentric compression performance,has also been researched.Zhaoet al.(2016) carried out an axial compression experiment on corroded RC columns and showed that corrosion would decrease the axial compression capacity of RC columns and reduce their ductility.Xiaet al.(2016) found that the degree of corrosion,hooping ratio and eccentricity had a significant influence on the eccentric mechanical behavior of RC columns with a square-section.El Maaddawy (2008) researched the eccentric compression performance of corroded RC columns and concluded that as the corrosion level and eccentricity increased,the bearing capacity decreased.
In addition,many research studies have been conducted examine the seismic performance of corroded RC columns.In the experimental test conducted by Yanget al.(2016),corrosion of the RC columns was accelerated by a new wrapping method to study their seismic performance in a simulated tidal zone.Guoet al.(2018) pointed out that the corrosion of steel bars in the splash zone and tidal zone of coastal bridge piers could cause significant degradation of the seismic behavior of RC columns.Maet al.(2012) and Liet al.(2009) investigated the effects of corrosion rate and axial compression ratio on the seismic performance of corroded RC columns through experimental research.Rajput and Sharma (2018) mainly studied the effects of longitudinal reinforcement corrosion and stirrup forms on the seismic performance of RC columns.Guoet al.(2015) concluded that the corrosion of stirrups was much more serious than that of longitudinal rebars on the bearing capacity,ductility and energy consumption of RC bridge piers.Four corroded reinforced concrete columns with a service life of more than 20 years were examined experimentally by Maet al.(2018) and the effects of axial compression ratio and reinforcement ratio on the seismic performance of corroded RC columns were explored.At the same time,some scholars have studied the seismic response of an RC frame structure under rebar corrosion (Yukselet al.,2013;Anoopet al.,2015).These studies found that the gradual deterioration of the frame will lead to a serious reduction in the foundation shear and top displacement capacity,and the structural ductility of the corroded frame.Ghosh and Padgett (2012) assessed the impacts of the ocean atmosphere,ocean wave splash and deicing salt on the seismic performance of bridges.Overall,the seismic performance of RC buildings after long-term use was significantly decreased (Anwar and Dong,2020;Memon and Sheikh,2005;Yanget al.,2020).
Furthermore,many researchers have studied the performance of corroded RC members utilizing numerical simulation and theoretical analysis.Di Carloet al.(2017b) used DIANA finite element software to simulate the seismic performance of corroded RC columns.Cardoneet al.(2013) investigated the influence of the corrosion location,slenderness ratio and seismic joint on seismic behavior of corroded RC bridge piers under horizontal reciprocating action with OpenSees software.Yanget al.(2018) carried out a numerical study on the shear performance of RC beams with different locations of stirrup corrosion breakage.In terms of theoretical analysis,Yinet al.(2018) proposed a formula for calculating the small eccentric bearing capacity of corroded RC columns after textile repair based on experimental data.Gonget al.(2005) obtained the monotonic force-displacement curve of corroded RC columns based on tests conducted on uncorroded RC columns.
From the above-mentioned studies,it can be found that the overall performance of RC columns is seriously affected by the corrosion of the reinforcement,most notably the lateral resistance and ductility.Nevertheless,it should be noted that in most of the numerical simulation studies,the mesoscopic heterogeneity of concrete was not considered.In fact,the macroscopic properties,e.g.,the nonlinear behavior of concrete,are closely related to the heterogeneous characteristics at meso-scale (Jinet al.,2020a).To better reflect the mesoscopic heterogeneity and to obtain a more realistic crack propagation process,a meso-scale numerical model is needed.
Accordingly,a three-dimensional meso-scale numerical model was developed to study the seismic performance of corroded RC columns.In the model,the influences of corrosion on RC columns were obtained by changing the material properties of the reinforcement,weakening the concrete cover strength and adjusting the bond slip between the concrete and corroded steel rebar.The simulation model was verified by comparing the numerical results with reliable experiment data.In addition,the effects of some key factors including the corrosion level,axial force ratio and shear-span ratio on the overall seismic performance of corroded RC columns were studied and the bearing capacity,ductility and stiffness degradation of the columns were analyzed.
2 3D nonlinear FE model for corroded RC column
2.1 Geometric model
In this section,a three-dimensional (3D) finite element (FE) model with commercial software ABAQUS was proposed for corroded reinforcement concrete (RC)columns.Depending on whether or not the heterogeneity of the internal structure of the concrete is considered,the numerical methods for concrete can be divided into two types,micro-/meso-scale and macro-scale methods (Zhanget al.,2015;Shenet al.,2015;Santoset al.,2020;Di Carloet al.,2017;Wriggers and Moftah,2006).At the macro-scale,concrete is regarded as a homogeneous material with uniform property.This type of method is convenient to implement and most of the needed parameters can be measured directly.Therefore,it has been adopted in most numerical studies for concrete (Di Carloet al.,2017;Cardoneet al.,2013;Vuet al.,2016).On the other hand,from the meso-scale viewpoint,concrete is composed of hardened cement paste,aggregates and the voids,pores as well as microcracks,resulting in an inhomogeneous internal structure.The heterogeneous characteristics can generate a notable influence on the apparent behavior of concrete.To reflect this property more exactly while saving on the computation cost,concrete is always considered as a two phase (aggregates and cement mortar) or threephase composite material (aggregates,cement mortar and interfacial transition zone (ITZ) between them).Based on this framework,some mesoscopic models have been developed for concrete (Shenet al.,2015;Du and Jin,2014).Among them,the random aggregate model is a type of phenomenological approach and has been utilized to simulate the thermal,diffusion and mechanical properties of concrete (Maet al.,2016;Duet al.,2014;Jinet al.,2019).
In the mesoscopic model,the aggregate was assumed to be a sphere to reflect the actual situation and simplify the calculation.The size of coarse aggregate was represented by two equivalent diameters,i.e.,15 mm and 30 mm,according to the Fuller curve (Wriggers and Moftah,2006;Bažantet al.,1990).Programming with FORTRAN,the coarse aggregate parts that were randomly distributed and wrapped by an ITZ interface layer were placed in the cement mortar by the “takeand-place” method under the Monte Carlo framework(Wriggers and Moftah,2006;Du and Jin,2014;Šavijaet al.,2013).The volume ratio of coarse aggregate was approximately 30%.ITZ is supposed to be a relatively thin layer (Kim and Abu Al-Rub,2011) and many researchers have noted that the exact thickness of the ITZ is about 20-50 μm.Nevertheless,in the case of the mesoscale 3D model,if the exact thickness of ITZ is used,the amount of calculation will be extremely large.Consequently,the value of ITZ thickness was taken between 0.5 mm and 2 mm in most numerical studies(Xiaet al.,2013;Garboczi and Bentz,1991;Donzaet al.,2002).Under the premise of calculation efficiency and accuracy,the thickness of ITZ was set as 1 mm.Finally,different material properties were assigned to the corresponding zones to characterize the mechanical properties of each meso-component.Moreover,concrete was discretized by the 8-node hexahedral reduction integration element while steel bars were meshed with the two-node wire element.The averaged mesh size was 15 mm.
A typical example of the random aggregate model for a corroded RC column is illustrated in Fig.1.In addition,the arrangement profiles of steel rebar are also displayed in Fig.2(a).The geometry and rebar arrangement are as stated in the experiment of Medaet al.(2014).It can be seen that the general height of each column was 1.8 m and the dimension of the cross-section was 300 mm wide by 300 mm deep.Each column was reinforced with four Φ16 mm steel bars as the longitudinal reinforcement and the corresponding longitudinal ratio of reinforcement is computed as 0.89%.Moreover,Φ8 mm steel bar spacing of 300 mm was adopted as the stirrup arrangement.The values of yielding and ultimate tensile strength of the reinforcement bars were 520 MPa and 620 MPa,respectively.A base with the size of 1300 mm ×600 mm × 500 mm was integrally cast with the column.Moreover,the longitudinal bars and stirrups arrangement of the stub are shown in Fig.2(a).

Fig.2 Profiles of steel rebar arrangement and geometry details of the RC column of (a) Meda et al.′s (2014) experiment and (b) Li et al.′s (2009) experiment
The nonlinear spring element was added between the steel rebar and concrete to simulate the interaction between them,from Fig.1.The nonlinear spring element was implemented between a reinforcement element and a nearby concrete element by arranging nonlinear functions evenly along the length of the steel rebar.
2.2 Assumptions and constitutive model
2.2.1 Modeling of concrete
Generally speaking,in ordinary concrete members,the strength of the aggregate particle is relatively high and no large deformation occurs during the loading process with lower strain rates.Therefore,the aggregate particles were assumed to be elastic in this study and no fracture or failure would occur under the action of the loading.The damage plastic model (Lee and Fenves,1998) was applied to express the mechanical behavior of the mortar matrix and ITZs.It was assumed that the failure mechanisms of mortar and ITZs were tensile cracking and compressive crushing.The isotropic damage variables were utilized to describe the stiffness degradation caused by the tensile and compressive failure of the material and the stressσ-strainεrelationship can be expressed as:

wheredis the isotropic stiffness degradation variable which is specified that 0 ≤d≤ 1,where 0 represents no damage and 1 indicates that the material is completely destroyed;represents the initial elastic matrix of the material;εplis the plastic strain tensor;andDelis the stiffness matrix when the damage isd.
As for the corroded RC column,the cross section of the concrete was assumed to be divided into the cover area and the inner core area.The strength of the cover concrete was reduced,due to the concrete cracking or peeling.In both areas with/without the influence of rebar corrosion,the mechanical behavior of mortar and ITZs was described by the abovementioned damage plastic model.
Corrosion of reinforcing bars can generate rust with larger volume and poor performance,which causes the hoop tensile stress of the concrete along the perimeter of the reinforcing bars.With the further development of corrosion,the cover concrete will be cracked or even be spalled off severely when its tensile strength is reached. To describe the degradation of cover concrete reasonably,a hypothesis proposed by Coronelli and Gambarova (2004) considering the cover cracking and spalling was adopted as follows:
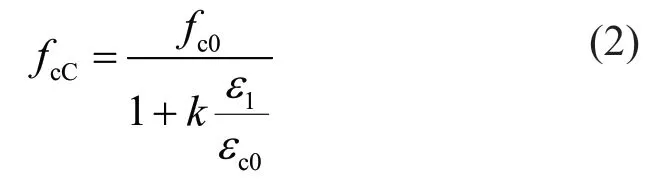
wherefc0is the compressive strength of sound concrete;kis a factor which is related to the roughness and diameter of rebar,in this study,k=0.1;εc0is the strain corresponding to the peak stress of sound concrete.1εis the smeared tensile strength which concerns the width of the concrete crack caused by corrosion products and is a function of the number of corroded reinforcement bars,the depth of corrosion and the volume expansion ratio of rust.
As proposed in Hanjariet al.(2011),the tensile strength of the cover should be reduced in proportion to the deterioration of the compressive strength of the cover concrete:

whereft0is the tensile strength of sound concrete.According to Design of Concrete Structures (CEB-FIP,1990),it is calculated as
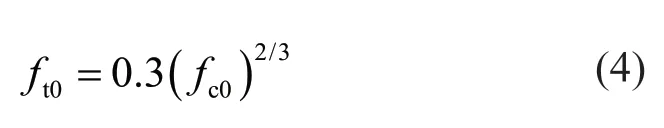
Figure 3 shows the assumptions of compressive and tensile behavior of cover concrete,which have been adopted widely in the calculation of structures with corroded rebars (Di Carloet al.,2017;Vuet al.,2016).
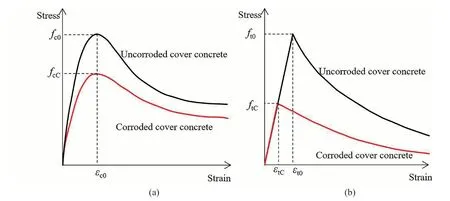
Fig.3 Constitutive models for concrete under (a) compressive and (b) tensile loadings
To determine the mechanical properties of the meso-components,the repeated inversion method was adopted.Namely,once the apparent properties of concrete were known (strength grade or failure patterns,etc.),the mechanical properties of aggregate and mortar were determined based on experimental measurement or experience.The strength and elastic modulus of ITZs were set to a series in propotion with those of the mortar matrix in the range of 75%-85% (Xiaoet al.,2013;Jinet al.,2020b).A number of meso-scale simulatons were conducted while the results of apparent properties(elastic modulus and strength,etc.) were compared with the tested ones.Once a good agreement was obtained,that group of parameters were recorded and employed in the following simulations.
2.2.2 Modeling of corroded reinforcement
Typically,the average cross section area of the steel rebar after corrosion can be calculated as

whereρis the corrosion level of the reinforcement bar;d0is the original diameter of the rebar;andW0andW1are the weight of rebar with a unit length before and after corrosion,respectively.
Since the direct measurement of reinforcement weight is difficult,the corrosion level can be estimated as

wheredcis the diameter of the corroded steel bar;tis the time after corrosion begins;andTis the initiating time of corrosion when the depth of the steel bar meets the crucial chloride concentration.For more information,one can refer to Choeet al.(2006).
The corrosion of steel bars is divided into uniform corrosion induced by carbonization of concrete and pitting corrosion caused by chloride ion invasion (Xiaet al.,2013).The corrosion level can be approximated by Eqs.(6) and (7).
To express the constitutive model of the steel bar,the bilinear elastoplastic model is adopted,as shown in Fig.4.It has been proved that the performance of the steel bars does not change significantly after uniform corrosion (Duet al.,2005;Sarja and Vasikari,1996).However,due to the stress concentration at the pitting location,the obvious degradation of the yield strength of the corroded rebar can be calculated by the following formula:

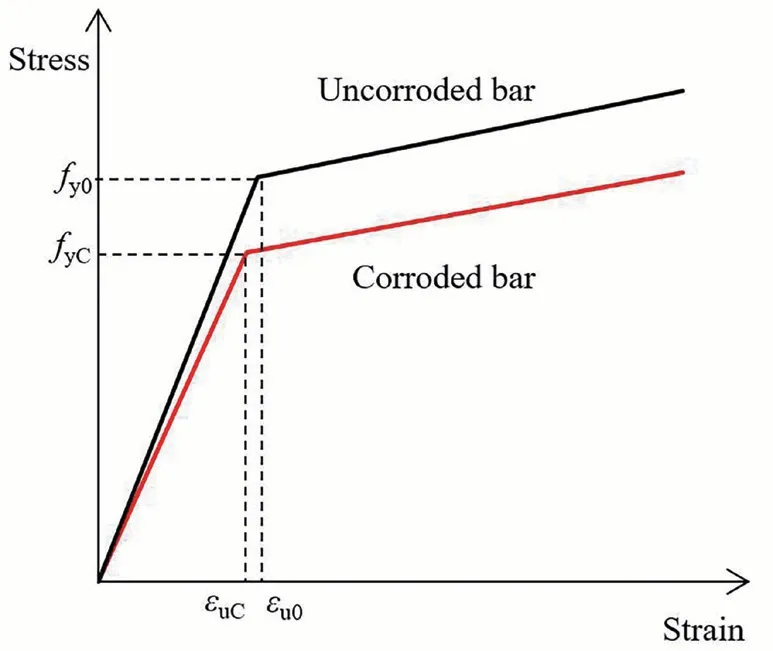
Fig.4 Constitutive models for steel reinforcement
wherefyCandfy0are the yield strength of the reinforcement bar after and before corrosion,respectively;αis an empirical coefficient which was set as 0.005 in this study according to the suggestion of Duet al.(2005).AsandApitare the cross-sectional area of steel bar before and after pitting corrosion,respectively.
The buckling of longitudinal reinforcement after it corroded was considered,due to the cracking and falling off of the concrete cover and rebar corrosion which increase the probability of buckling of longitudinal bars.Many studies on the buckling model of longitudinal corroded bars have been conducted (Monti and Nuti,1992;Kashaniet al.,2013;Dhakal and Maekawa,2002).The model proposed by Kashaniet al.(2013),which has been widely recognized and adopted (Di Carloet al.,2017b;Said and Hussein,2019),was used in this study to reflect the buckling of longitudinal bars.Namely,the failure strength of the longitudinal reinforcement was selected as the smaller value of the yield strength between the buckling strength.
2.2.3 Modeling of bond deterioration
The multi-line model constitutive,which was recommended in the Chinese code for design of concrete structures (GB 50010-2010,2016),was adopted to describe the bond-slip behavior.When the rebar is corroded,the rust products of the reinforcing steel have poor bonding behavior to the concrete,which may cause a decrease in the adhesion performance.Several models for the degradation of the bond strength between corroded rebars and concrete have been proposed (Fenget al.,2016;Al-Sulaimaniet al.,1990;Blomforset al.,2018).In this work,the degradation model of bond strength recommended by Jianget al.(2018) was used to estimate the maximum bond strength.This model has some important advantages over the other degradation models.For instance,the influences of concrete and stirrup can be considered separately.The maximum degraded bonding stress caused by reinforcement corrosion can be calculated by the following formula and shown in Fig.5:

Fig.5 Constitutive models for bond stress-slip relationship
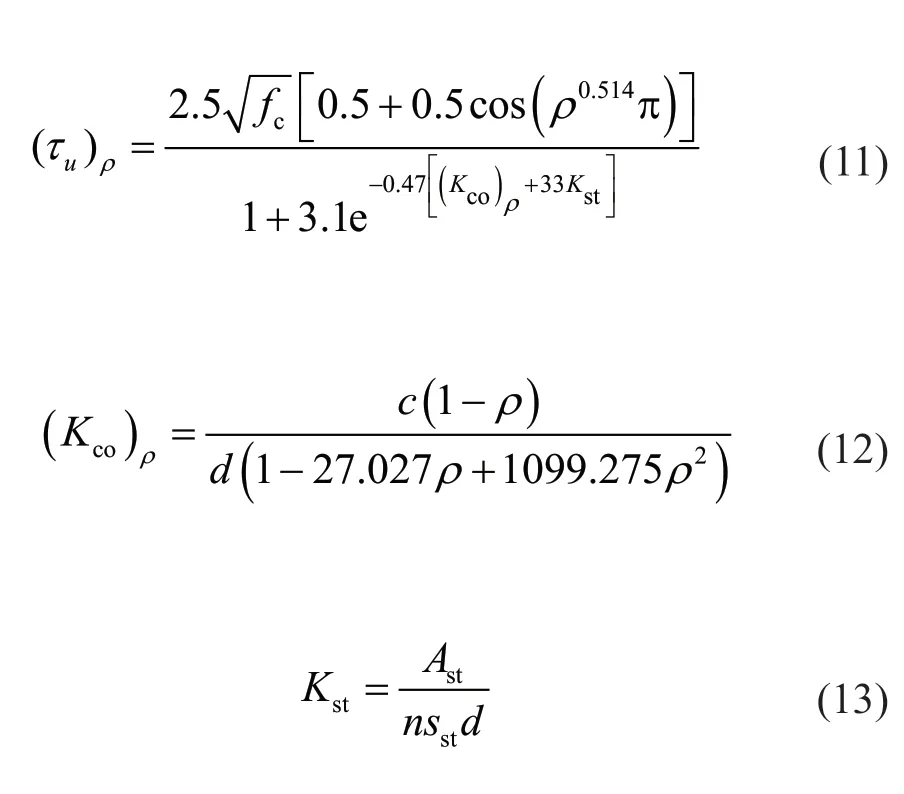
whereρis the corrosion level of longitudinal rebar;fcis the concrete compressive strength;Kcois a confinement parameter which is determined by concrete cover and steel bar;cis the thickness of the concrete cover;dis the diameter of longitudinal reinforcement;Kstis a confinement factor related to stirrup;nis the number of longitudinal steel bars;andAstandsstare the area and spacing of stirrups,respectively.
2.3 Boundary and loading conditions
To be consistent with actual engineering situations,the translation and rotation degrees of freedom on the bottom surface were constrained (set as zero).An axial force was applied to simulate the dead-weight and a horizontal load was employed to simulate the seismic force on the columns.In detail,the loading scheme includes both load control and displacement control as shown in Fig.6.During the loading process,the load control was first employed while 20%,40%,60%,80%and 100% of the yield load were applied.After the test column yields,it was altered to displacement control and 1,2,3… were continually employed,until the horizonal bearing capacity of the column dropped to 85% of the ultimate load.
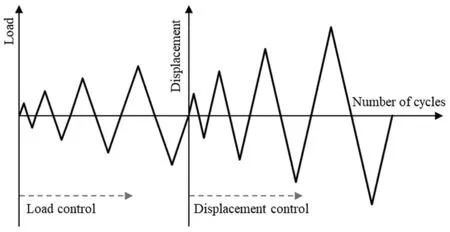
Fig.6 Loading scheme to simulate the influence of earthquake
3 Validation and simulation results
3.1 Validation of the numerical model
The experimental research conducted by Medaet al.(2014) and Liet al.(2009) on the response of corroded RC columns under simulated seismic loading was chosen to verify the accuracy of the proposed 3D nonlinear FE approach.There were four uncorroded or corroded RC columns with the same dimensions and reinforcement bar arrangements in the Medaet al.(2014) and Liet al.(2009) tests.In the Medaet al.(2014) experiment,the size and reinforcement arrangement can be found in Fig.2(a).This type of column,which was cast in Italy in the1960s,can typically be found in structures that do not consider seismic loads.After corrosion,the steel bars were extracted and a tensile study was conducted to investigate the influence of corrosion on corroded steel bars.An acceleration method was employed to corrode the rebar within the columns until the corrosion level was roughly 20%.Then,a constant axial force of 400 kN together with horizontal periodic load was applied on the columns.Figure 2(b) shows the B2 steel bar layout and concrete dimensions of the Liet al.(2009) test specimen.
In the numerical simulation,the size,reinforcement arrangement,concrete strength and loading conditions remained the same as those in the experiment,and the material properties and detail information applied in the 3D mesoscopic FE method are illustrated in Table 1,in which the mechanical parameters with “a”were experimentally measured data,and those of ITZ superscripted by “b” were obtained by repeated trials.

Table 1 Mechanical parameters of meso components and steel rebar
Figure 7 presents a comparison between the envelop curves of the simulation results and Medaet al.(2014)and Liet al.(2009) experimental results.As can be observed from Fig.7,in terms of horizonal load resistance,initial stiffness and final displacement,the global behavior of corroded RC columns obtained from the experimental test and the finite element analysis results show good agreement.Figure 7(c) presents a comparison of hysteresis loops.Due to the lack of original experimental data,only the hysteresis loop comparison of ultimate load is shown.It can be seen from the figure that the proposed numerical model can reflect the hysteresis characteristics of the RC columns,which proves the rationality of the numerical model.In addition to the envelope curve and hysteresis cycle,Fig.8 presents a comparison of the final failure patterns of the simulation results and experimental results to further examine the accuracy and applicability of the numericalmodel.It can be seen that both in the 3D mesoscopic simulation results and experimental observations,concrete at the locations close to the bottom of the corroded column,which is the most crucial area,was crushed.
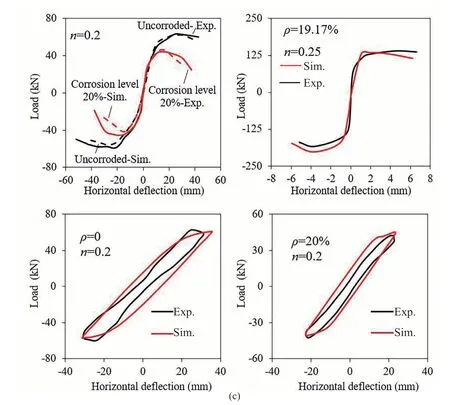
Fig.7 Comparison between the simulation results of corroded RC columns between (a) envelop curves of Meda et al.′s (2014)experiment results,(b) envelop curves of Li et al.′s (2009) experiment results and (c) hysteresis cycle of the ultimate load of Meda et al.′s (2014) experiment
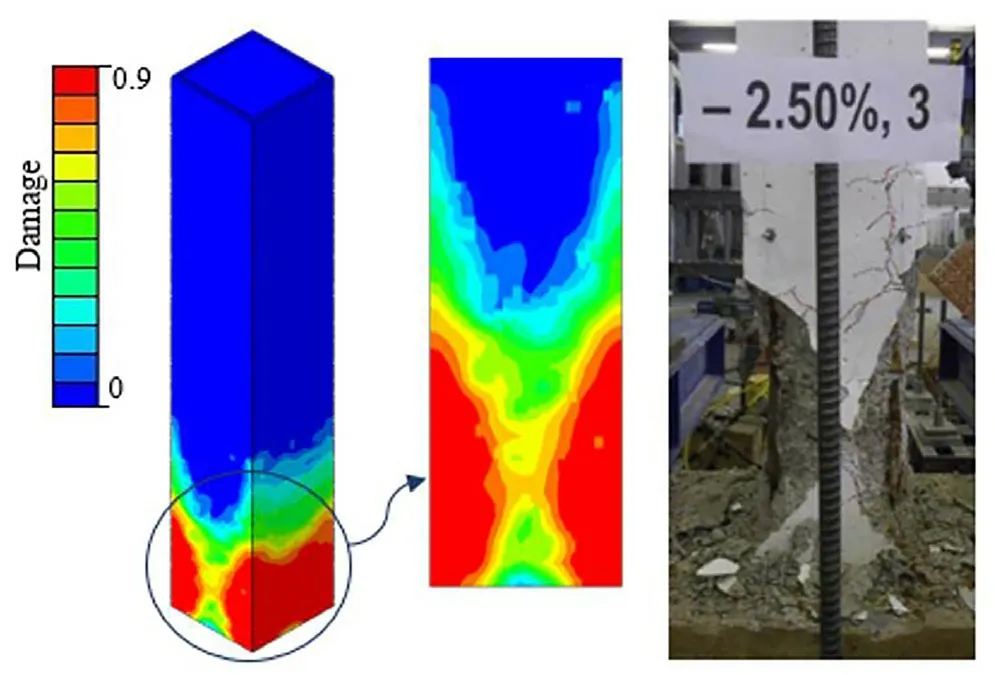
Fig.8 Comparison between the final failure patterns of 20%corrosion level corroded RC column obtained from the simulation result and Meda et al.′s (2014) experiment observation
In summary,the results indicate that the simulation method is reasonable and can reliably calculate the behavior of corroded reinforcement columns subjected seismic loads.
3.2 Failure process of corroded columns under simulated seismic loading
Figure 9 shows a detailed view of the internal failure of the corroded RC column with a corrosion level of 20%,axial force ratio of 0.2 and shear-span ratio of 5,whereirepresents the number of horizontal cycles.Figure 9(a)illustrates the internal cracks when the column eventually failed.Figure 9(b) presents the development of internal cracks near the location of the column failure,which clearly displays the damage process inside the RC column.Note that cracking and fracture were multilevel phenomena,in which micro-cracks converged into large cracks.In general,the difference in the elastic modulus and the strength between the meso-components of concrete results in the stress concentration in the ITZ,leading to its frailty.In addition,more initial defects are found in the ITZ than in the mortar.Therefore,micro-cracks mainly initiate in the ITZ.As the load increases,the micro-cracks remain steady at about 30%of the maximum ultimate strength and then their length,width,and number begin to increase.The spreading of micro-cracks inside the ITZ continue until the loading reaches 50% of the ultimate strength.Larger cracks are caused by the merging of interface cracks in areas where adjacent micro-cracks are nearby.The combination of mortar cracks and their rapid expansion take place when the load is equivalent to 70%-90% of the ultimate strength.As the deformation of the RC column increases and the steel bar yields,the RC column is eventually destroyed at the bottom of the column.In addition,Fig.9(c) shows internal cracks on a section and it can be seen that the development of the crack bypasses the aggregate;namely,it is expanding at the mortar and ITZ.Note that the crack propagation process can be clearly observed by the mesoscopic simulation,which reflects the heterogeneity of the concrete material.
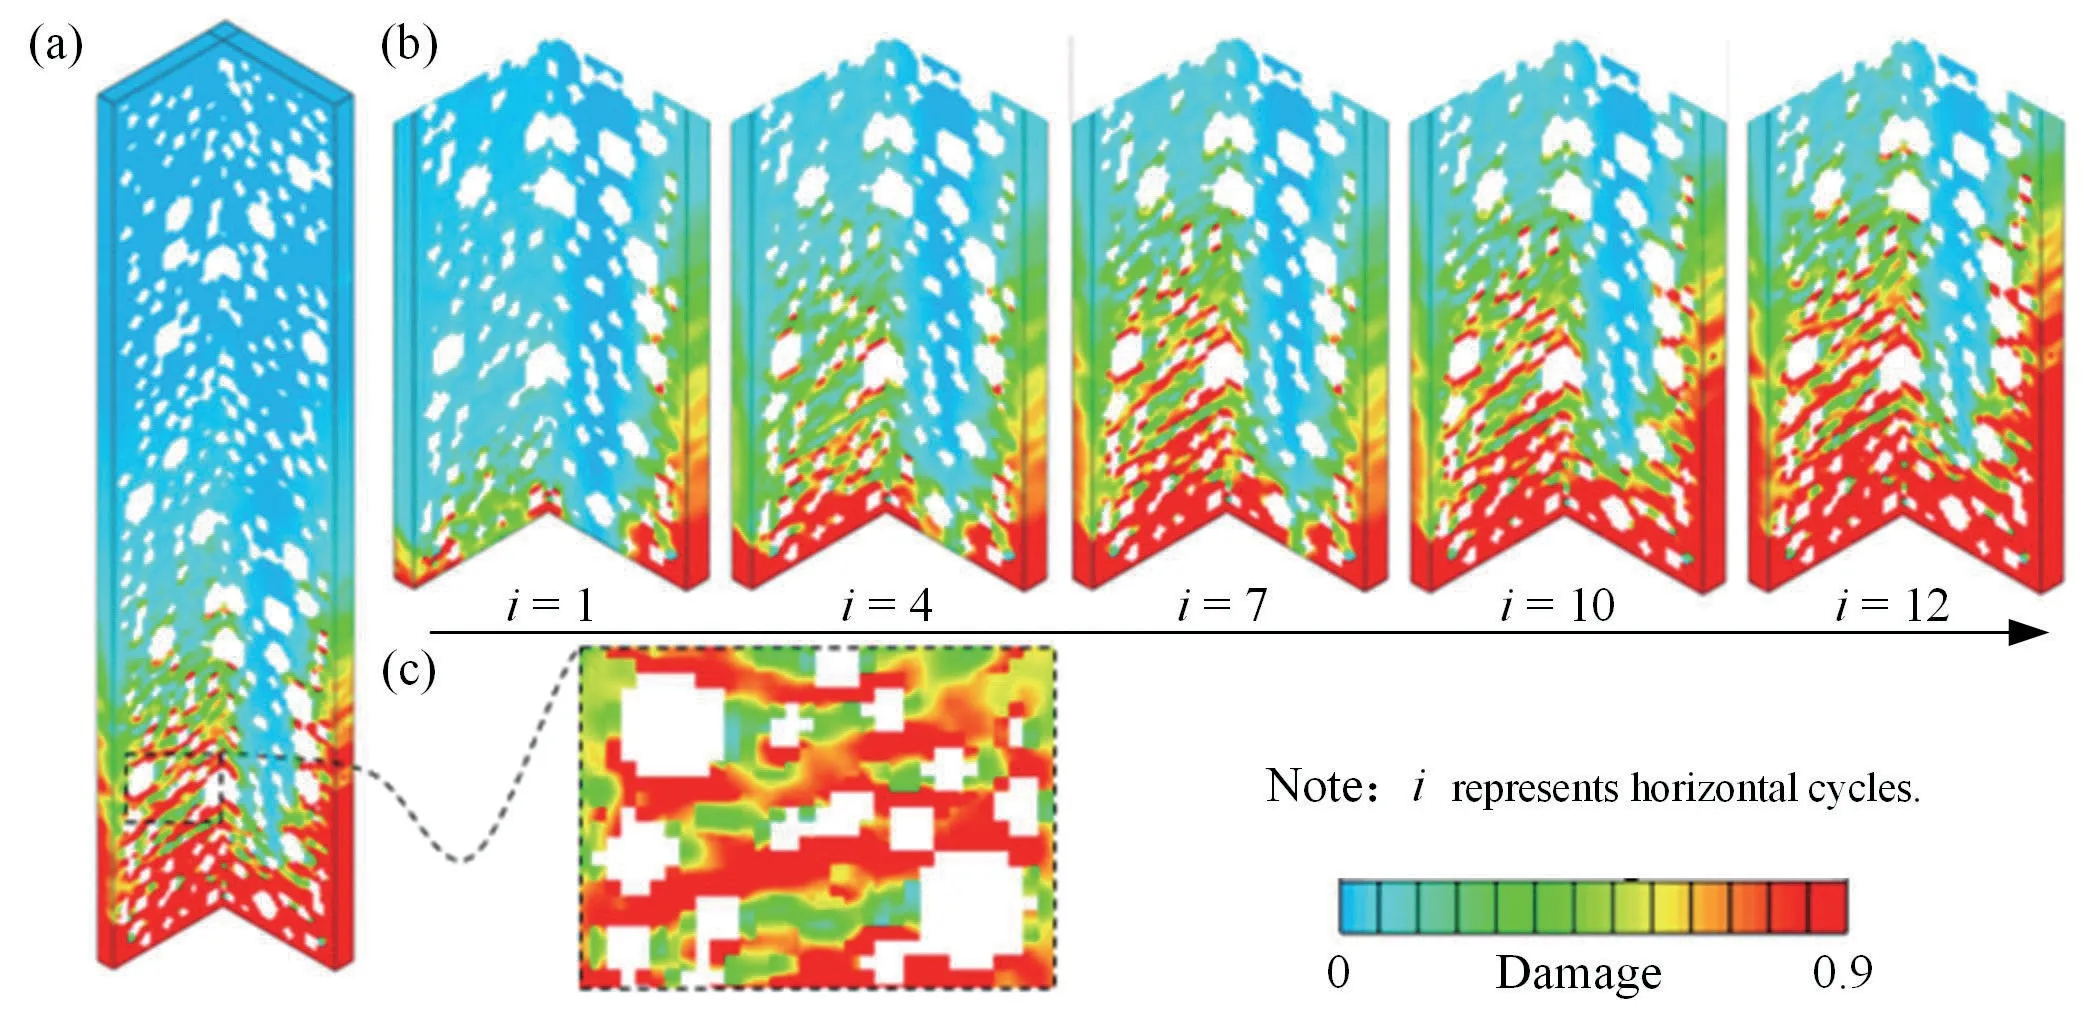
Fig.9 Internal damage of uncorroded RC column.(a) final failure patterns of the simulation specimen;(b) internal damage process;and (c) local damage
4 Parametric studies
Based on the proposed numerical method,more simulations are be carried out to further study the influence of some critical parameters including corrosion level,axial force ratio and shear-span ratio on seismic performance of corroded reinforced concrete columns,such as capacity of anti-lateral force,deformation capacity and energy dissipation.
Shear-span ratio is one of the most crucial structure factors affecting the seismic capability of RC structures.Generally,the shear-span ratioλof RC members is defined as
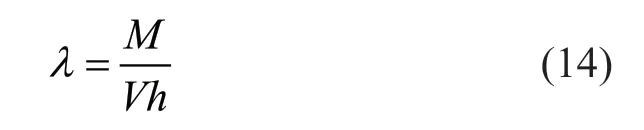
whereMis the section bending moment;Vis the shear force;andhis the section depth.As for the RC columns,the shear-span ratio can be simply obtained by
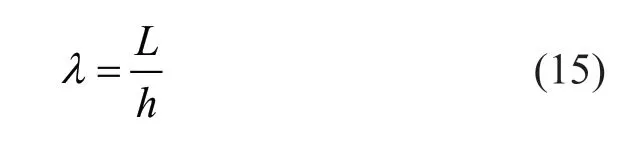
whereLis the height of the horizontal loading point.
Figure 10 displays the final failure patterns of the specimens with different corrosion levels,axial force ratios and shear-span ratios.From Fig.10,it can be seen that corrosion level,axial force ratios and shearspan ratios have different effects on failure patterns.The failure region increases with the increase of corrosion level and axial force ratios.Moreover,it can be seen from Fig.11 that,for specimens with a corrosion level of 20% and an axial ratio of 0.2,the final failure pattern of the column turns into shear failure when the shear span ratio changes from 5 to 3.
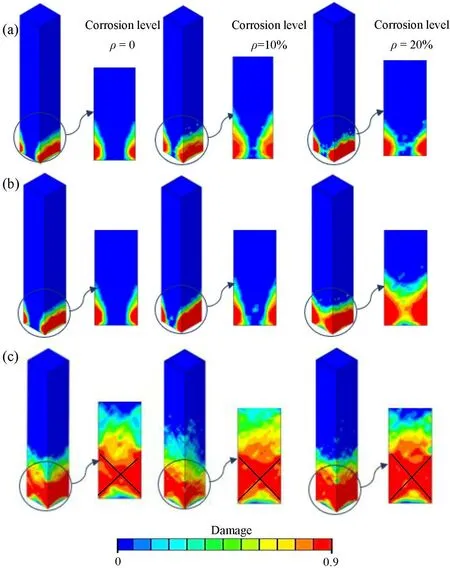
Fig.10 Final failure patterns of the corroded simulated specimens with shear-span ratio of 5 under different axial force ratios.(a) n=0.1;(b) n=0.2;and (c) n=0.4
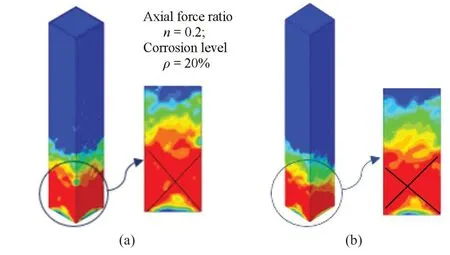
Fig.11 Comparison between final failure pattern of corroded RC columns with different shear span ratios.(a) λ=5;and (b) λ=3
Figure 12 illustrates the hysteretic curves of corroded columns with a shear-span ratio ofλ=5 with different axial ratios and corrosion levels.As a comparison,the hysteretic responses of corroded columns with a shearspan ratio ofλ=3 are shown in Fig.13.Note that when the shear-span ratio is 3,the effect of the axial force ratio and the corrosion level on the hysteresis curve is the same as the results obtained for specimens with a shear span ratio of 5.

Fig.12 Hysteretic curves of corroded RC columns with shear-span ratio λ=5
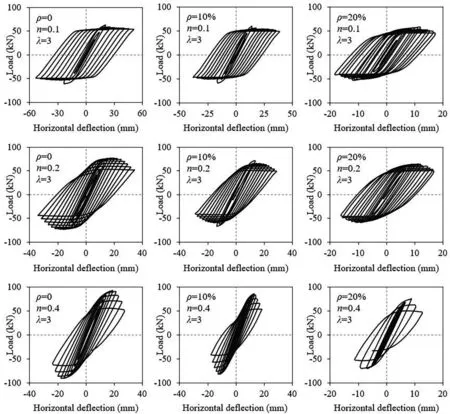
Fig.13 Hysteretic curves of corroded RC columns with shear-span ratio λ=3
Lateral bearing capacity and ductility are two of the most crucial indexes,which are used to evaluate the seismic response of RC members.The simulated bearing capacity and ductility of the RC columns are listed in Table 2.In Table 2,pyandΔyrepresent yield load and corresponding yield displacement,respectively.pmaxis the measured maximum lateral load.Herein,puis the ultimate load,ascertained as 85% of the maximum horizontal loadpmaxafter the peak load andΔuis the corresponding ultimate displacement.In this study,displacement ductility coefficientu,which is computed asu=Δu/Δy,was used to indicate ductility of the corroded columns.Moreover,the sum of the area of each hysteresis loop is used to represent the energy consumption capacity of the RC columns.This method has also been adopted in many investigations (Maet al.,2012;Rajput and Sharma,2018;Jinet al.,2018).
4.1 Effect of axial force ratio
Axial compressive force is one of the most important factors that affect the seismic behavior of RC columns (Liet al.,2009;Jinet al.,2018).When the axial force ratio is increased from 0.1 to 0.2,the failure region increases,as seen in Fig.10.However,with the further increase of the axial force,the failure pattern changes from local damage into oblique cracks at the bottom.Note that horizontal bearing capacity significantly increases with the increase of axial force,as seen in Fig.12.Meanwhile,results have shown that maximum displacement of corroded column reduces with the increase of the axial ratio.To study the effect of the axial force ratio on the mechanical properties of corroded RC columns,the axial force ratios of 0.1,0.2 and 0.4 were chosen.Figure 14 shows the envelop curve of corroded columns with various axial force ratios.It can be observed from Fig.14 that the maximum lateral resistance of corroded RC columns grows with the increase of the axial force ratio.For instance,the horizontal bearing capacity of the corroded columns with a corrosion level of 10% and shear-span ratio of 5 increases by approximately 19%,and 22% when the axial pressure ratio rises from 0.1 to 0.2,and 0.4,respectively.Nevertheless,as reflected in the displacement ductility coefficient and stiffness degradation,the larger axial compressive force makes the corroded column more brittle.

Fig.14 Influence of axial force ratio on the envelop curve of corroded RC columns
Figure 15 displays the relationship between lateral load and corrosion level.It can be seen that when the axial force is relatively high,the strength degradation caused by corrosion will be more serious.Additionally,as can be seen from Table 2,when the axial pressure ratio increases from 0.1 to 0.4,the displacement ductility factor decreases.This is because when the horizontal force acts on the column and as the axial pressure increases,a larger additional bending moment is generated,resulting in a less ductility.

Fig.15 Relationship between lateral load and axial force ratio of corroded RC columns.(a) Shear-span ratio λ=3;and (b) λ=5
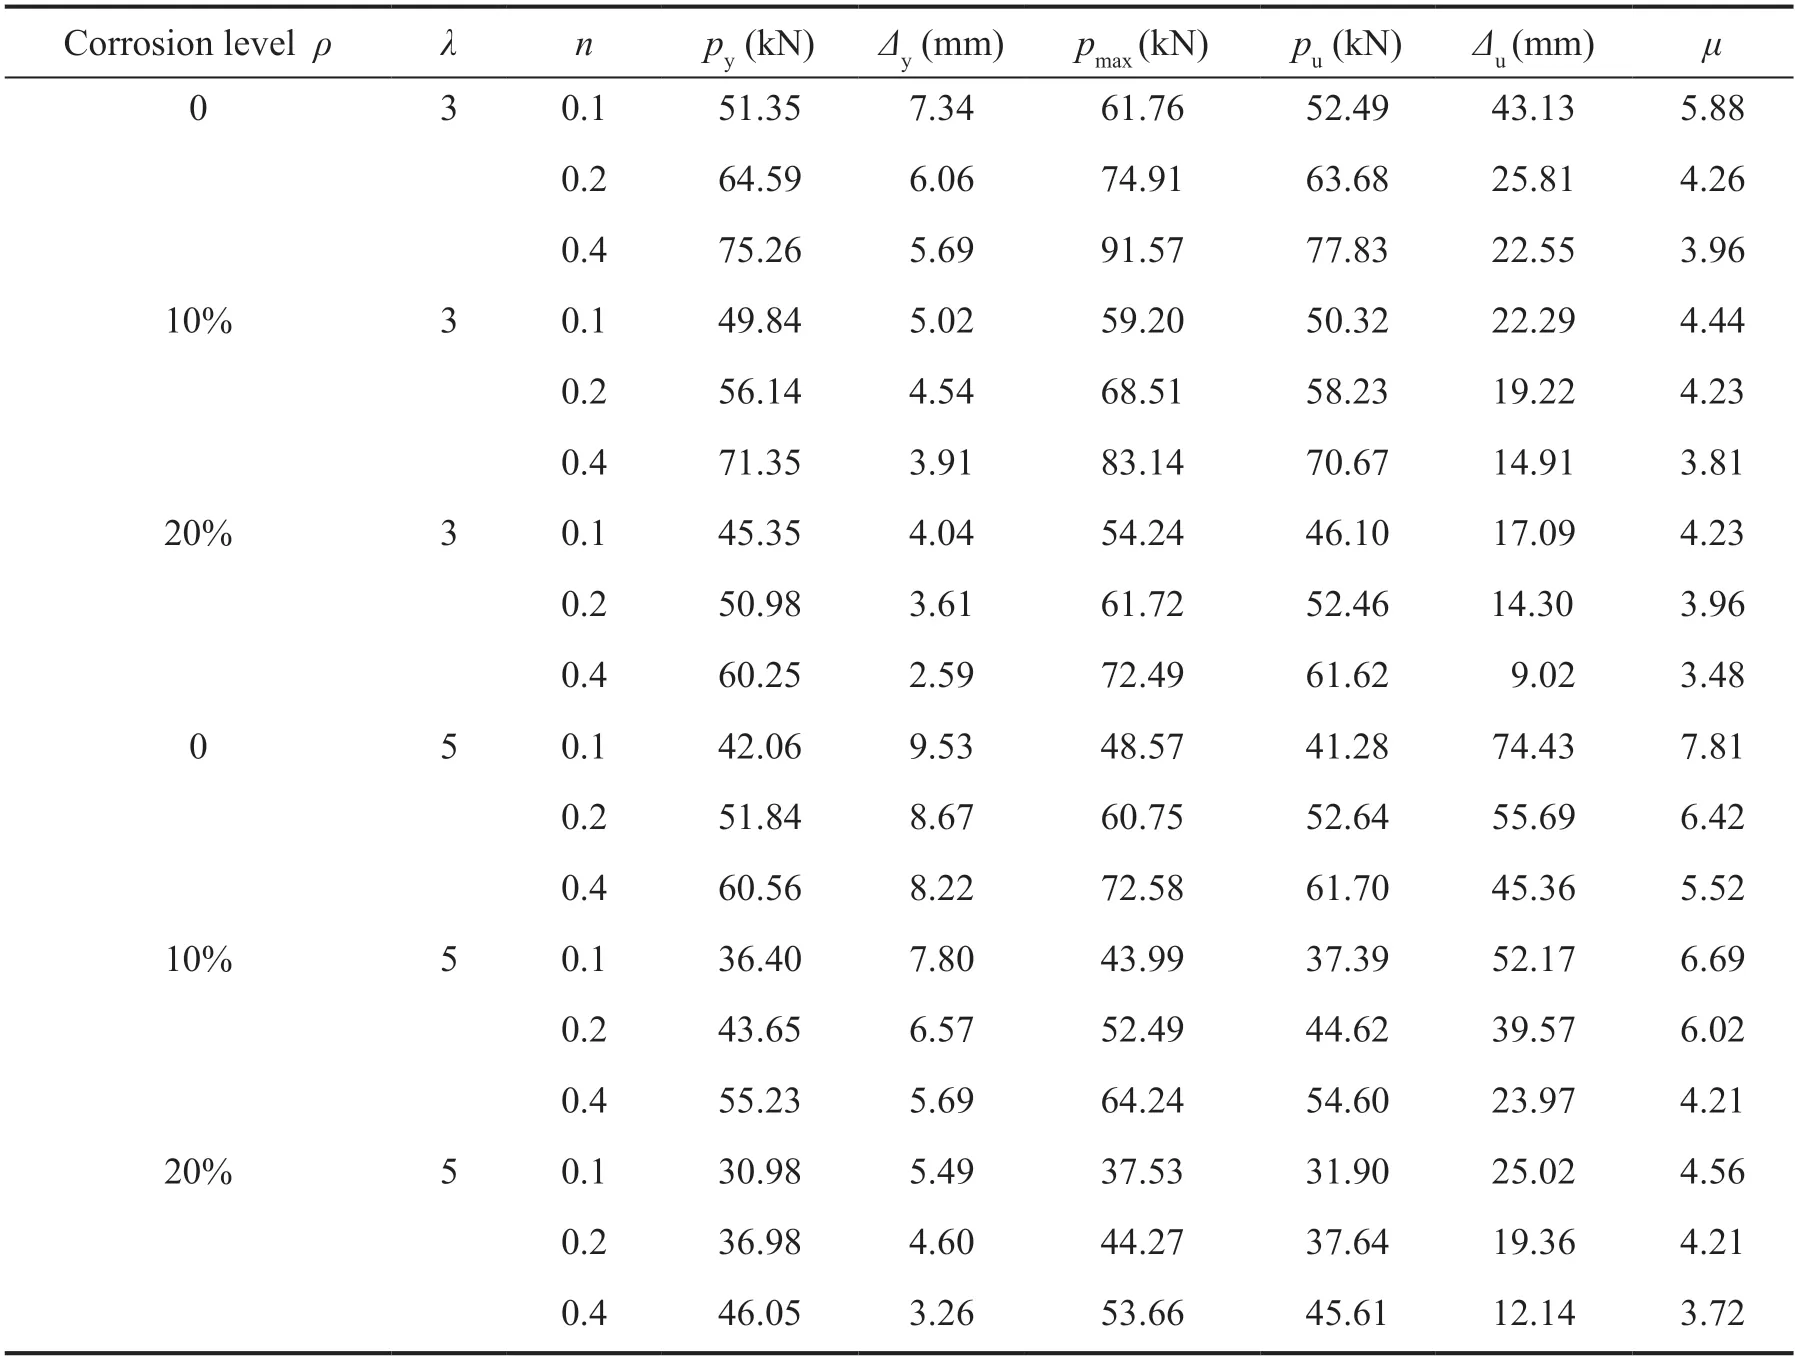
Table 2 Summary of simulation results of corroded RC columns
Figure 16 shows the influence of the axial force ratio on energy dissipation and stiffness.It can be seen from Fig.16(a) that as the axial compression ratio increases,the energy dissipation capacity of the corroded RC columns decreases.This is because the energy consumption capacity is determined by the bearing capacity and ductility.Although the increase of the axial pressure increases its ability to resist the lateral forces of the RC column,at the same time,the ductility is decreased more severely,which may cause the energy consumption capacity to decrease.Similar findings have been obtained by Maet al.(2012) and Liet al.(2009).From Fig.16(b),it is noted that for columns with the identical corrosion level and shear-span ratio,the stiffness degradation becomes severe as the axial force increases.
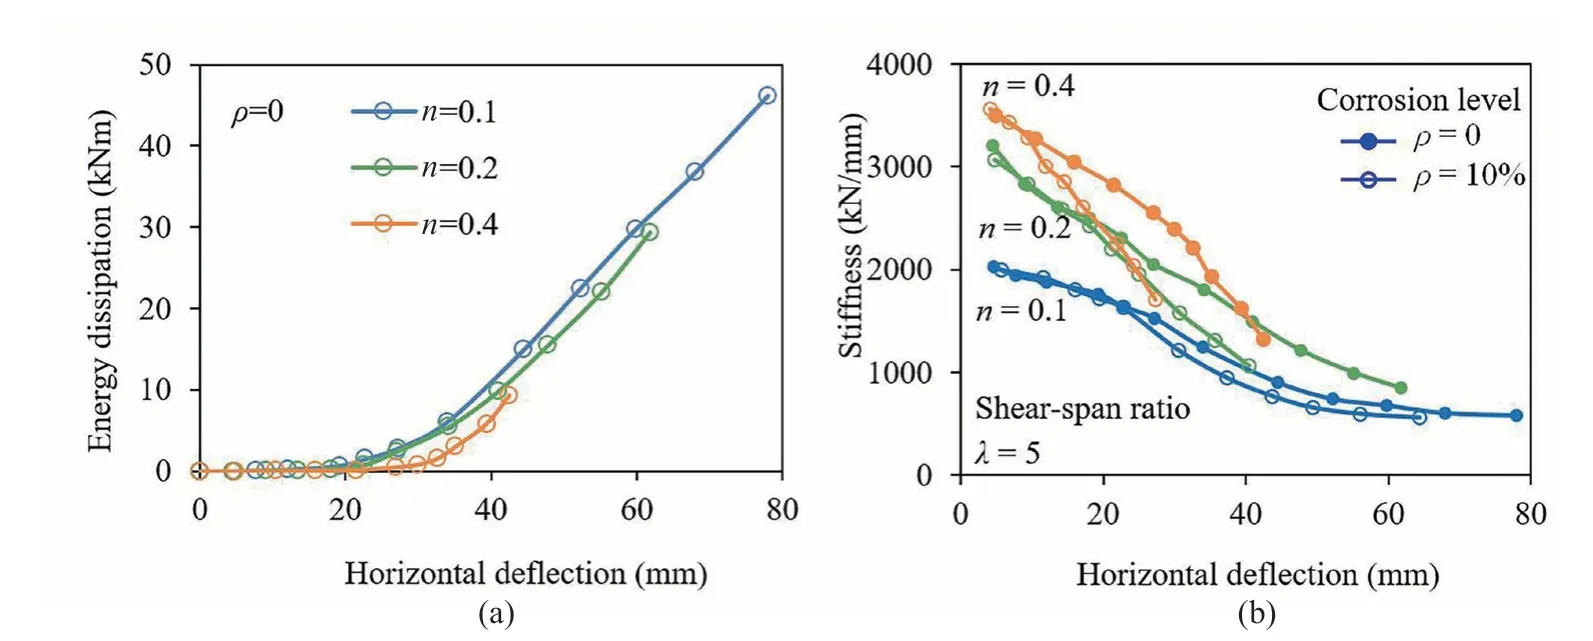
Fig.16 Influence of axial force ratio on (a) the energy dissipation;and (b) the stiffness degradation of corroded RC columns
4.2 Effect of shear-span ratio
To exploring the effect of shear-span ratio on the seismic performance of corroded RC columns,the size and rebar arrangement of the columns in the simulation were kept the same.Alternatively,the influence of shear-span ratio on seismic performance was studied by changing the loading position of horizontal force.From Figs.12 and 13,it can be seen that for specimens with the identical axial compression ratio and corrosion level,when the shear span ratio changes from 5 to 3,the horizontal bearing capacity is increased.Figure 17 shows the influence of the shear-span ratio on the envelop curve of corroded RC columns.However,the ultimate displacement is reduced.In fact,the shear-span ratio can directly influence the shear strength of the RC columns.For columns with a small shear-span ratio,the compressive stress of concrete is larger and the tensile stress is smaller.In other words,the force is transmitted through the principal compressive stress.Accordingly,the compressive strength of the concrete can perform well and the concrete does not easily crack.Therefore,the ability to resist lateral forces (i.e.,the shear strength)is greater.The improvement of the shear strength of the RC column can effectively resist more severe earthquakes,thus improving its seismic performance.For RC columns with a large shear-span ratio subjected to horizontal loadings,the main mechanism of force transmission is flexural,generating little direct principal compressive stress between the horizontal loading position and the column bottom.

Fig.17 Influence of shear-span ratio on the envelop curve of corroded RC columns
Figure 18 provides the influence of the shearspan ratio on the energy dissipation and the stiffness degradation of corroded RC columns.When the shear span ratio is small,the displacement ductility coefficient decreases,as shown in Table 2.Correspondingly,as displayed in Fig.18(a),poor energy consumption is found in corroded RC columns with a small shearspan ratio.Although the reduction of the shear-span ratio would increase the resistance to lateral force,the deformation capacity would be degraded,which may cause the energy consumption of corroded RC columns to decrease.Note that as the shear-span ratio declines,the stiffness of the RC columns degrades more rapidly,as seen in Fig.18(b).Namely,the smaller shear-span ratio leads to less ductility capacity.

Fig.18 Influence of shear-span ratio on (a) the energy dissipation;and (b) the stiffness degradation of corroded RC columns
4.3 Effect of corrosion level
In this section,the effect of the corrosion level on the seismic behavior of the column is investigated.As shown in Figs.12 and 13,the horizontal bearing capacity and maximum displacement of the corroded column decrease gradually with the increase of the corrosion level.Similar results were obtained the experiment conducted by Maet al.(2012).Figure 19 displays the change of the skeleton curve of the loaddisplacement curve under corrosion levels of 0,10%and 20%.Note that the higher levels of corrosion lead to less lateral loading resistance.Most notably,when the RC columns corrosion ratio is 20%,the lateral resistance of the RC columns with the axial compression ratio of 0.1 and shear-span ratio of 5 degrades 9.4% and 22.7%,respectively,as the corrosion level is increased from 0 to 20%.A more serious reduction of lateral resistance can be observed for columns with an axial force ratio of 0.2.Namely,the corresponding deterioration reaches 13.6% and 27.1% under the same condition.Thus,it can be concluded that the lateral bearing capacity decreases with respect to the corrosion level and the decline is more obviously with a larger axial force ratio.

Fig.19 Influence of corrosion level on the envelop curve of corroded RC columns
In addition,as observed in Table 2,the displacement ductility coefficient declines as the corrosion level increases.The cause of this phenomenon is the deterioration of the properties of the reinforcing steel material and the bonding between the steel and the concrete due to corrosion.As the horizontal resistance and ductility of columns decrease at the same time,it leads to the degradation of energy consumption in seismic response from Fig.20(a).As illustrated in Fig.20(b),the greater the corrosion level,the more pronounced is the tendency for stiffness degradation.The ductile reduction is also reflected through stiffness degradation caused by rebar corrosion.This result is similar to that found by Yanget al.(2016) and Cardoneet al.(2013).
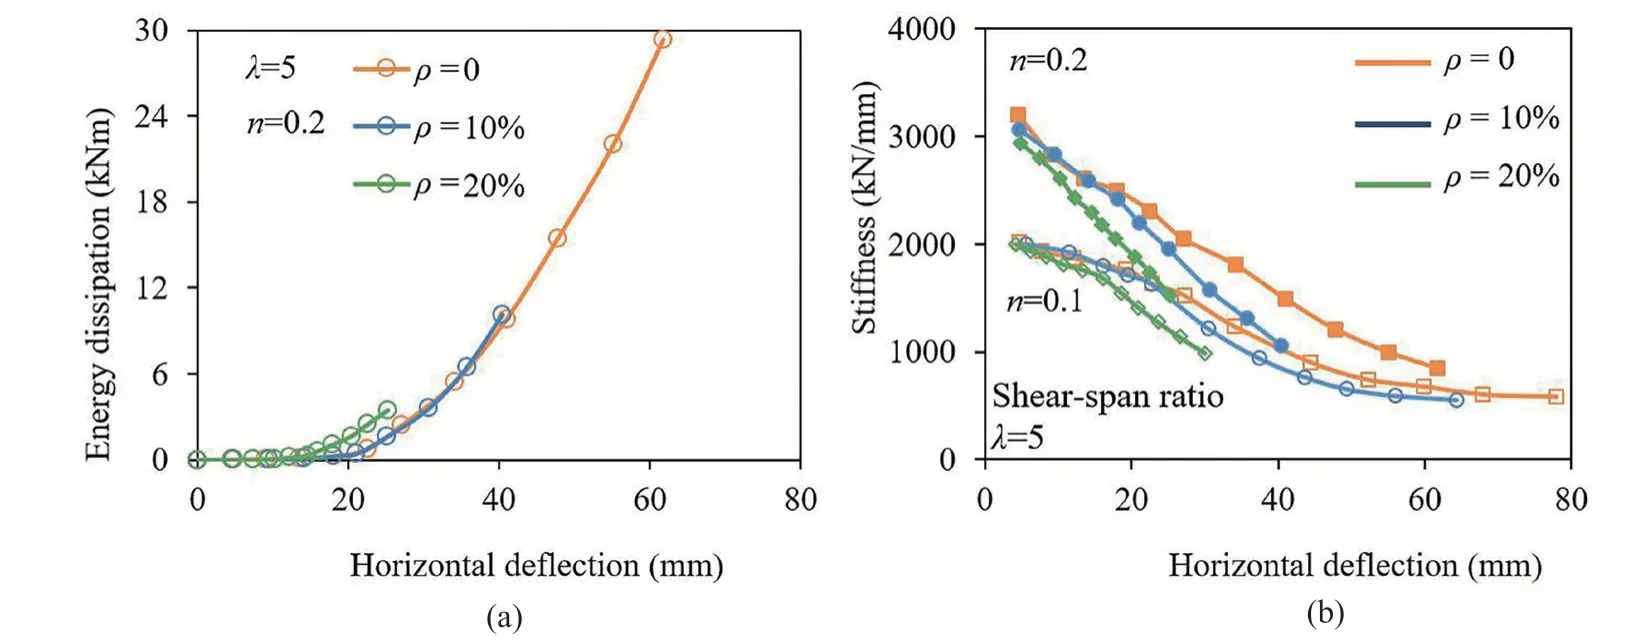
Fig.20 Influence of corrosion level on (a) the energy dissipation;and (b) the stiffness degradation of corroded RC columns
5 Conclusions
Considering the heterogeneity of concrete,a 3D meso-scale finite element nonlinear approach was proposed to investigate the response of corroded RC columns under seismic loading.The deterioration of materials,including reduction in rebar cross-sectional area,strength of rebar and cover concrete as well as bond strength of the rebar-concrete interface,was considered in the 3D numerical model.The rationality and reliability of numerical simulation were proven using data from existing experiments.Moreover,the crucial parameters effecting the performance of corroded RC columns,including axial force ratio,shear-span ratio and corrosion level,were researched and their influences on the horizontal loading resistance and ductility capacity of corroded RC columns were evaluated.On the basis of the obtained failure pattern and hysteretic curves of the numerical results,some main conclusions can be generalized as follows:
(1) Based on a comparison between mesoscopic numerical results and available experimental observations,the rationality and accuracy of the mesosimulation method were verified.Simultaneously,the meso-method could capture the development of internal cracks and explain the heterogeneity of concrete materials to reflect its nonlinear mechanical behavior.
(2) When the axial pressure ratio of corroded RC columns is increased from 0.1 to 0.4,the lateral bearing capacity is significantly improved and the initial stiffness was high.However,the ductility and energy dissipation capacity are poor and the stiffness degradation is dramatic.
(3) By changing the shear-span ratio from 3 to 5,the lateral bearing capacity of the corroded RC column was reduced.However,the ductility is good,involving the increase of the ductility factor and gentle stiffness degradation.The energy consumption capacity was also improved.
(4) With the increase of the corrosion level of corroded RC members,the failure mode is similar and the damage area increased accordingly.The resistance to lateral forces,the initial stiffness and deformation capacity as well as energy consumption capacity of the RC columns are reduced while a more severe degradation of stiffness was observed.
This is the initial work in a series of studies to explore the performance of corroded RC structures.Only the seismic performance of corroded RC columns was investigated.In follow-up work,the behavior of corroded RC structures under other types of loadings,such as axial and eccentric compression,flexural or impact loadings,and the corresponding retrofitting measures will be discussed.
Acknowledgement
This research was supported by the National Natural Science Foundation of China (Nos.51822801 and 51978022).The support is gratefully acknowledged.
杂志排行

Earthquake Engineering and Engineering Vibration的其它文章
- Innovative mitigation method for buried pipelines crossing faults
- Study on time-varying seismic vulnerability and analysis of ECC-RC composite piers using high strength reinforcement bars in offshore environment
- Optimization of design parameters for controlled rocking steel braced dual-frames
- Seismic response of selective pallet racks isolated with friction pendulum bearing system
- Reliability and sensitivity analysis of wedge stability in the abutments of an arch dam using artificial neural network
- Steel rings as seismic fuses for enhancing ductility of cross braced frames