A hybrid artificial bee colony algorithm and support vector machine for predicting blast-induced ground vibration
2022-10-19ZhuChunXuYingzeWuYongxinHeManchaoZhuChuanqiMengQingxiangandLinYun
Zhu Chun ,Xu Yingze ,Wu Yongxin ,He Manchao ,Zhu Chuanqi,Meng Qingxiang and Lin Yun
1.School of Earth Sciences and Engineering,Hohai University,Nanjing 210098,China
2.State Key Laboratory for Geomechanics &Deep Underground Engineering,China University of Mining and Technology (Beijing),Beijing 100083,China
3.State Key Laboratory of Mining Response and Disaster Prevention and Control in Deep Coal Mines,Anhui University of Science and Technology,Huainan 232001,China
4.College of Petroleum Engineering,Xi’an Shiyou University,Xi’an 710065,China
5.School of Resources and Safety Engineering,Central South University,Changsha 410083,China
Abstract: Because nearby construction has harmful effects,precisely predicting blast-induced ground vibration is critical.In this paper,a hybrid artificial bee colony (ABC) and support vector machine (SVM) model was proposed for predicting the value of peak particle velocity (PPV),which is used to describe blast-induced ground vibration.To construct the model,5 potentially relevant factors,including controllable and uncontrollable parameters,were considered as input parameters,and PPV was set as the output parameter.Forty-five samples were recorded from the Hongling lead-zinc mine.An ABCSVM model was developed and trained on 35 samples via 5-fold cross-validation (CV).A testing set (10 samples) was used to evaluate the prediction performance of the ABC-SVM model.SVM and four empirical models (United States Bureau of Mines (USBM),Amraseys-Hendron (A-H),Langefors-Kihstrom (L-K),and Central Mining Research Institute (CMRI)) also were introduced for comparison.Next,the performances of the models were analyzed by using 3 statistical parameters: the correlation coefficient (R2),root-mean-square error (RMSE),and variance accounted for (VAF).ABC-SVM had the highest R2 and VAF values followed by the SVM,A-H,USBM,CMRI,and L-K methods.The results demonstrated that ABCSVM outperformed SVM and the empirical predictors for predicting PPV.Moreover,the best results from the R2,RMSE,and VAF indices were 0.9628,0.2737,and 96.05% for the ABC-SVM model.The sensitivities of the parameters also were investigated,and the height difference between the blast point and the monitoring station was found to be the parameter that had the most influence on PPV.
Keywords: recycled concrete;frame-shear wall;concealed bracings;shaking table test;nonlinear time-history response analysis
1 Introduction
Mining operations have increased throughout the world for extraction of minerals from the earth crust.Drilling and blasting are the most widely used methods for rock excavation in mining,tunneling,and other types of civil engineering construction and development.However,70%-80% of blasting energy is wasted and several undesirable environmental issues (such as ground vibration,fly rock,air overpressure,and noise)are inevitable (Monjeziet al.,2012,2016;Taoet al.,2020;Turkeret al.,2021).Among these issues,ground vibration is considered the most serious because it is harmful to nearby facilities (Hajihassaniet al.,2014;Taheriet al.,2016;Wuet al.,2017 and 2018;Zhanget al.,2018a;Esfehet al., 2020).Moreover,there are several criteria for ground vibration,including peak particle velocity (PPV),duration,and frequency(Khandelwal,2010;Khandelwalet al.,2009;Ragam and Nimaje,2018;Zhanget al.,2018b;Gonget al.,2018).Each of these effects of blasting has its own environmental problems.They are unavoidable and cannot be completely eliminated but can certainly be minimized up to a permissible level to avoid damage to the surrounding environment.Among them,PPV is the most widely used criterion to describe blast-induced ground vibration (Armaghaniet al.,2013,2016;Guiet al., 2018;Harandizadehet al.,2018;Hasanipanahet al.,2015;Khandelwal,2010;Khandelwalet al.,2009;Khandelwal and Singh,2007;Mohamadnejadet al.,2012;Murmuet al.,2018;Prashanth and Nimaje,2018b;Ragam and Nimaje,2018).Accurately predicting PPV can guide the optimization of blasting design and operation,thereby effectively reducing hazards that are caused by blast-induced ground vibration.Precisely predicting PPV is essential for reducing the harmful effects of blast-induced ground vibration.
The value of PPV depends on many parameters(Armaghaniet al., 2013;Shiet al.,2012a),such as total charge (TC),maximum charge used per delay (MC),distance between the blast face and the monitoring point (D),and the height difference between the blast point and the monitoring station (H).The most widely used parameters for predicting PPV areMCandD(Armaghaniet al.,2016;Hasanipanahet al., 2015;Mohamadnejadet al.,2012;Monjeziet al.,2010;Sheykhiet al.,2017).Various empirical equations for evaluating PPV have been proposed by using these two parameters (Mohamadnejadet al., 2012;Monjeziet al.,2011).The most commonly used empirical equations are listed in Table 1.However,the empirical equations are insufficiently generalizable (Hajihassaniet al., 2014;Hasanipanahet al.,2016;Khandelwal and Singh,2006;Monjeziet al.,2010;Singh and Singh,2005;Taheriet al.,2016;Wanget al., 2018).This may include the following reasons (Khandelwal and Singh,2007): (1)These empirical equations are site-specific (i.e.,site constants are typically determined by using a specified database) and are not suitable for other sites;(2) Only two parameters are included in the empirical equations,and the effects of other parameters are nonnegligible;and(3) There is a strong and complex nonlinear relationship between PPV and its influencing parameters,and it is difficult to simulate this nonlinear relationship using empirical equations.Therefore,it is necessary to develop more accurate methods that can be used for predicting the value of PPV.
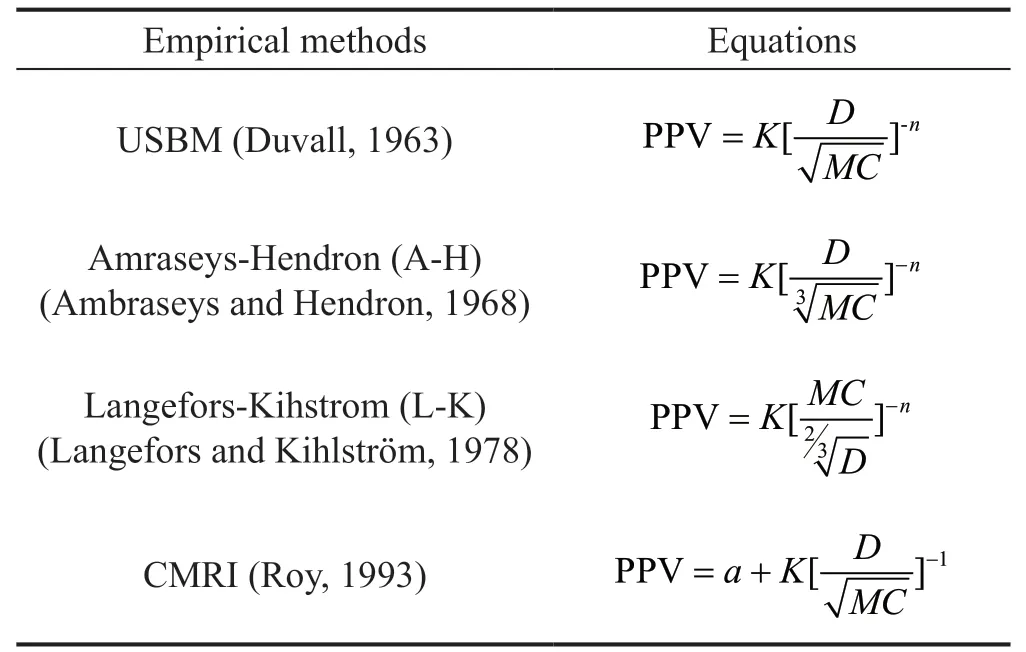
Table 1 Empirical equations
Recently,artificial intelligence (AI) methods have been widely used in many fields,including mining and geotechnical engineering (Xue,2019),rock mechanics(Hasanipanahet al.,2020;Hasanipanahet al.,2021),electrical energy consumption forecasting (Caprazet al.,2020),air pollution (Heydariet al.,2021b) and other fields (Heydariet al.,2021a;Denget al.,2020).For example,AI has been used to analyze rock burst (Linet al., 2018a),slope stability (Linet al.,2018b;Liuet al.,2014),mechanical properties of rock-like materials (Liuet al., 2013;Qiet al.,2018a, 2018b),flyrock resulting from blasting (Hasanipanah and Amnieh,2020a and 2020b;Hasanipanahet al.,2022;Fattahi and Hasanipanah,2021a),and the stability of open stope hanging walls(Qiet al., 2018c, 2017).Meanwhile,AI models,such as artificial neural network (ANN),support vector machine(SVM),imperialist competitive algorithm (ICA),and classification and regression tree (CART) algorithms,have been successfully used for predicting PPV and have yielded remarkable results.For example,Khandelwal and Singh (2006) developed an ANN model with 150 blast data sets and used the model to predict PPV values withMCandDas input parameters.The results demonstrated that the coefficient of correlation (R2) for the ANN model was the highest among the examined models.Armaghaniet al.(2016) employed the ICA to predict PPV at three quarry sites and demonstrated that the ICA quadratic form outperformed other models in predicting PPV values.The CART,multiple regression(MR),and various empirical predictors were proposed and used by Hasanipanahet al.(2016) to predict PPVs.In Hasanipanah′s study,86 blasting events were recorded and used;the results demonstrated that the CART model outperformed the other approaches.Statistical and adaptive neuro-fuzzy inference system (ANFIS) models were proposed and used by Ipharet al.(2008) to predict PPV.The researchers found that ANFIS outperforms statistical models.Mohamed (2011) used a fuzzy system(FS) and ANN to estimate PPV.He concluded that FS outperformed ANN in predicting PPV.Combinations of AI algorithms also have been developed for improving prediction performance.Tianet al.(2018) developed genetic algorithm (GA)-based models and used them to estimate the values of PPV based on 85 datasets.The results demonstrated that GA-based models provided more accurate predictions than was the case for empirical models.Hajihassaniet al.(2014) presented a hybrid ICA-ANN model for predicting PPV at the Harapan Ramai granite quarry in Malaysia.Results demonstrated that the ICA-ANN model outperformed the multiple regression (MR) technique and empirical models.Taheriet al.(2016) proposed a hybrid model using an artificial bee colony (ABC) and ANN to estimate the PPV values at the Miduk copper mine in Iran.Next,three performance indices were compared and the ABCANN model demonstrated superior performance.Zhuet al.(2021) established a chaos recurent adaptive neurofuzzy inference system optimized by particle swarm optimization (CRANFIS-PSO) model to predict ground vibration generated in rock blasting,and their results indicated the superiority of CRANFIS-PSO compared to other methods regarding predicting ground vibration.In the study of Fattahi and Hasanipanah (2021b),two intelligent models were proposed by hybridizing the relevance vector regression (RVR) with grey wolf optimization (GWO) and the bat-inspired algorithm(BA).The results indicated the superiority of the RVRGWO model compared to the RVR-BA model regarding prediction precision.Amiriet al.(2020) proposed itemset mining (IM) and neural networks (NN) models to predict ground vibration;the results showed that the use of IM was an effective approach for optimizing and improving NN performance.
The SVM algorithm is one of the most widely used algorithms for regression problems and has been used to predict PPV.For example,Khandelwalet al.(2010) usedMCandDas input indicators and employed the support vector machine (SVM) to predict PPVs at three opencast coal mines in India.Reults demonstrated that SVM is more suitable for predicting PPV.Shiet al.(2012a)proposed an SVM for predicting PPV that used nine input parameters.Hasanipanahet al.(2015) developed an SVM model that usedDandMVas input parameters for predicting PPV that was caused by blasting operations at the Bakhtiari Dam.Mohammadnejadet al.(2011)used SVM to predict ground vibrations at two limestone quarries.The hyperparameters of SVM can be optimized using other methods.For example,Sheykhiet al.(2017)used fuzzy C-means clustering (FCM) to identify the optimal hyperparameters of SVM and employed the hybrid FCM-SVM model to predict the PPV of the Sarcheshmeh copper mine.Additional details on studies of predicting PPV using AI methods are summarized in Table 2.As seen from this table,we can conclude that the ABC algorithm is a reliable method for parameter optimization and SVM is one of the most widely used predictors for calculating PPV.The ABC-SVM model has shown a very good generalization ability in other aspects of prediction,such as gene selection,solar radiation forecasting,etc.But few scholars use ABC to optimize SVM model parameters for PPV prediction research.
To summarize,the use of the combination of the two methods to predict PPV has yet to be fully investigated,as in the case of the prediction effect of the blasting vibration of an ABC-SVM algorithm under different engineering conditions and different influencing factors.Therefore,we investigated the feasibility of using ABCSVM to estimate ground vibration that results from blasting in the Hongling Lead-zinc Mine in China.
In this work,a hybrid model that combines ABC and SVM was developed for predicting PPV that is induced by blasting in mines.Five parameters,(namely,total charge (TC),maximum charge used per delay (MC),the height difference between the blast point and the monitoring station (H),the distance between the blast face and the monitoring point (D),and the primary blasting segments (BS)) were measured and selected as input parameters.Three statistical parameters,(namely,the coefficient of correlation (R2),root mean square error(RMSE),and variance accounted for (VAF)) were used to evaluate the prediction performance of ABC-SVM.Four empirical models (USBM,A-H,L-K,and CMRI) and an SVM model also were employed for comparison.The objective of this study is to investigate the performance of ABC-SVM in the prediction of PPV that is induced by blasting.
2 Database and parameters
2.1 Indicator analysis
Identifying the effects of blast-induced ground vibration is a complex problem that is affected by various parameters.According to the research of other scholars (Hasanipanahet al., 2015;Singh and Singh,2005),all of these parameters can be divided into two categories: (1) controllable parameters and (2)uncontrollable parameters.The controllable parameters mainly include the blast design parameters and the explosive parameters,such as the maximum charge that is used per delay,spacing,burden,hole depth,stemming,hole diameter,TC,MC,D,H,andBS.The uncontrollable parameters mainly include geo-technical and geo-mechanical properties,such as rock strength,discontinuity frequency,and ground water conditions.To avoid overtraining the model,three principles of choosing parameters must be relied upon.First,the sensitive and stable parameters reflecting properties of blast-induced ground vibration should be used as the discriminant indicators.Second,the parameters should be physically independent of each other.Finally,the parameter data should be easily obtained or readily available.For the cases that were considered in this study,variations in spacing,burden,hole depth,stemming,and hole diameter are small;hence,PPV is not sensitive to these parameters.Therefore,these parameters were not selected as input parameters for predicting PPV.Five parameters (namely,TC,MC,D,H,andBS) directly affect blasting vibration in engineering (Fanet al., 2005;Shen and Xu,2000;Zhanget al.,2010).Therefore,these five parameters were chosen as input parameters for constructing the PPV prediction models in this study.
2.2 Datasets
In the study,datasets were collected from the Hongling Lead-zinc Mine in China.The mine is located at a latitude of 41°17′10″ N and a longitude of 116°21′07″E.For rockfragmentation and displacement,drilling and blasting were used in this mine,and ammonium nitrate fuel oil(ANFO) was used as the main explosive material.To develop the PPV prediction models,45 vibration records(listed in Table S1) were recorded,and the values of PPV,TC,MC,D,H,andBSwere carefully measured.The values of PPV were measured using a Mini-Blast I seismograph.The seismograph has three (X,YandZ)data channels,its frequency range is from 1-315 Hz,with a dynamic range exceeding 100 dB.The sampling rate of the seismograph was 1000 samples per second.The layout of measuring lines was located in typical positions such as haulage tunnels and the measuring points also were found to be reasonably designed.During the test the instrument was placed near the test point and the vibration events and their corresponding acquisition times could be automatically recorded by the instrument.The waveform was transmitted to the electronic computer through the interface and the data were processed by using a computer.
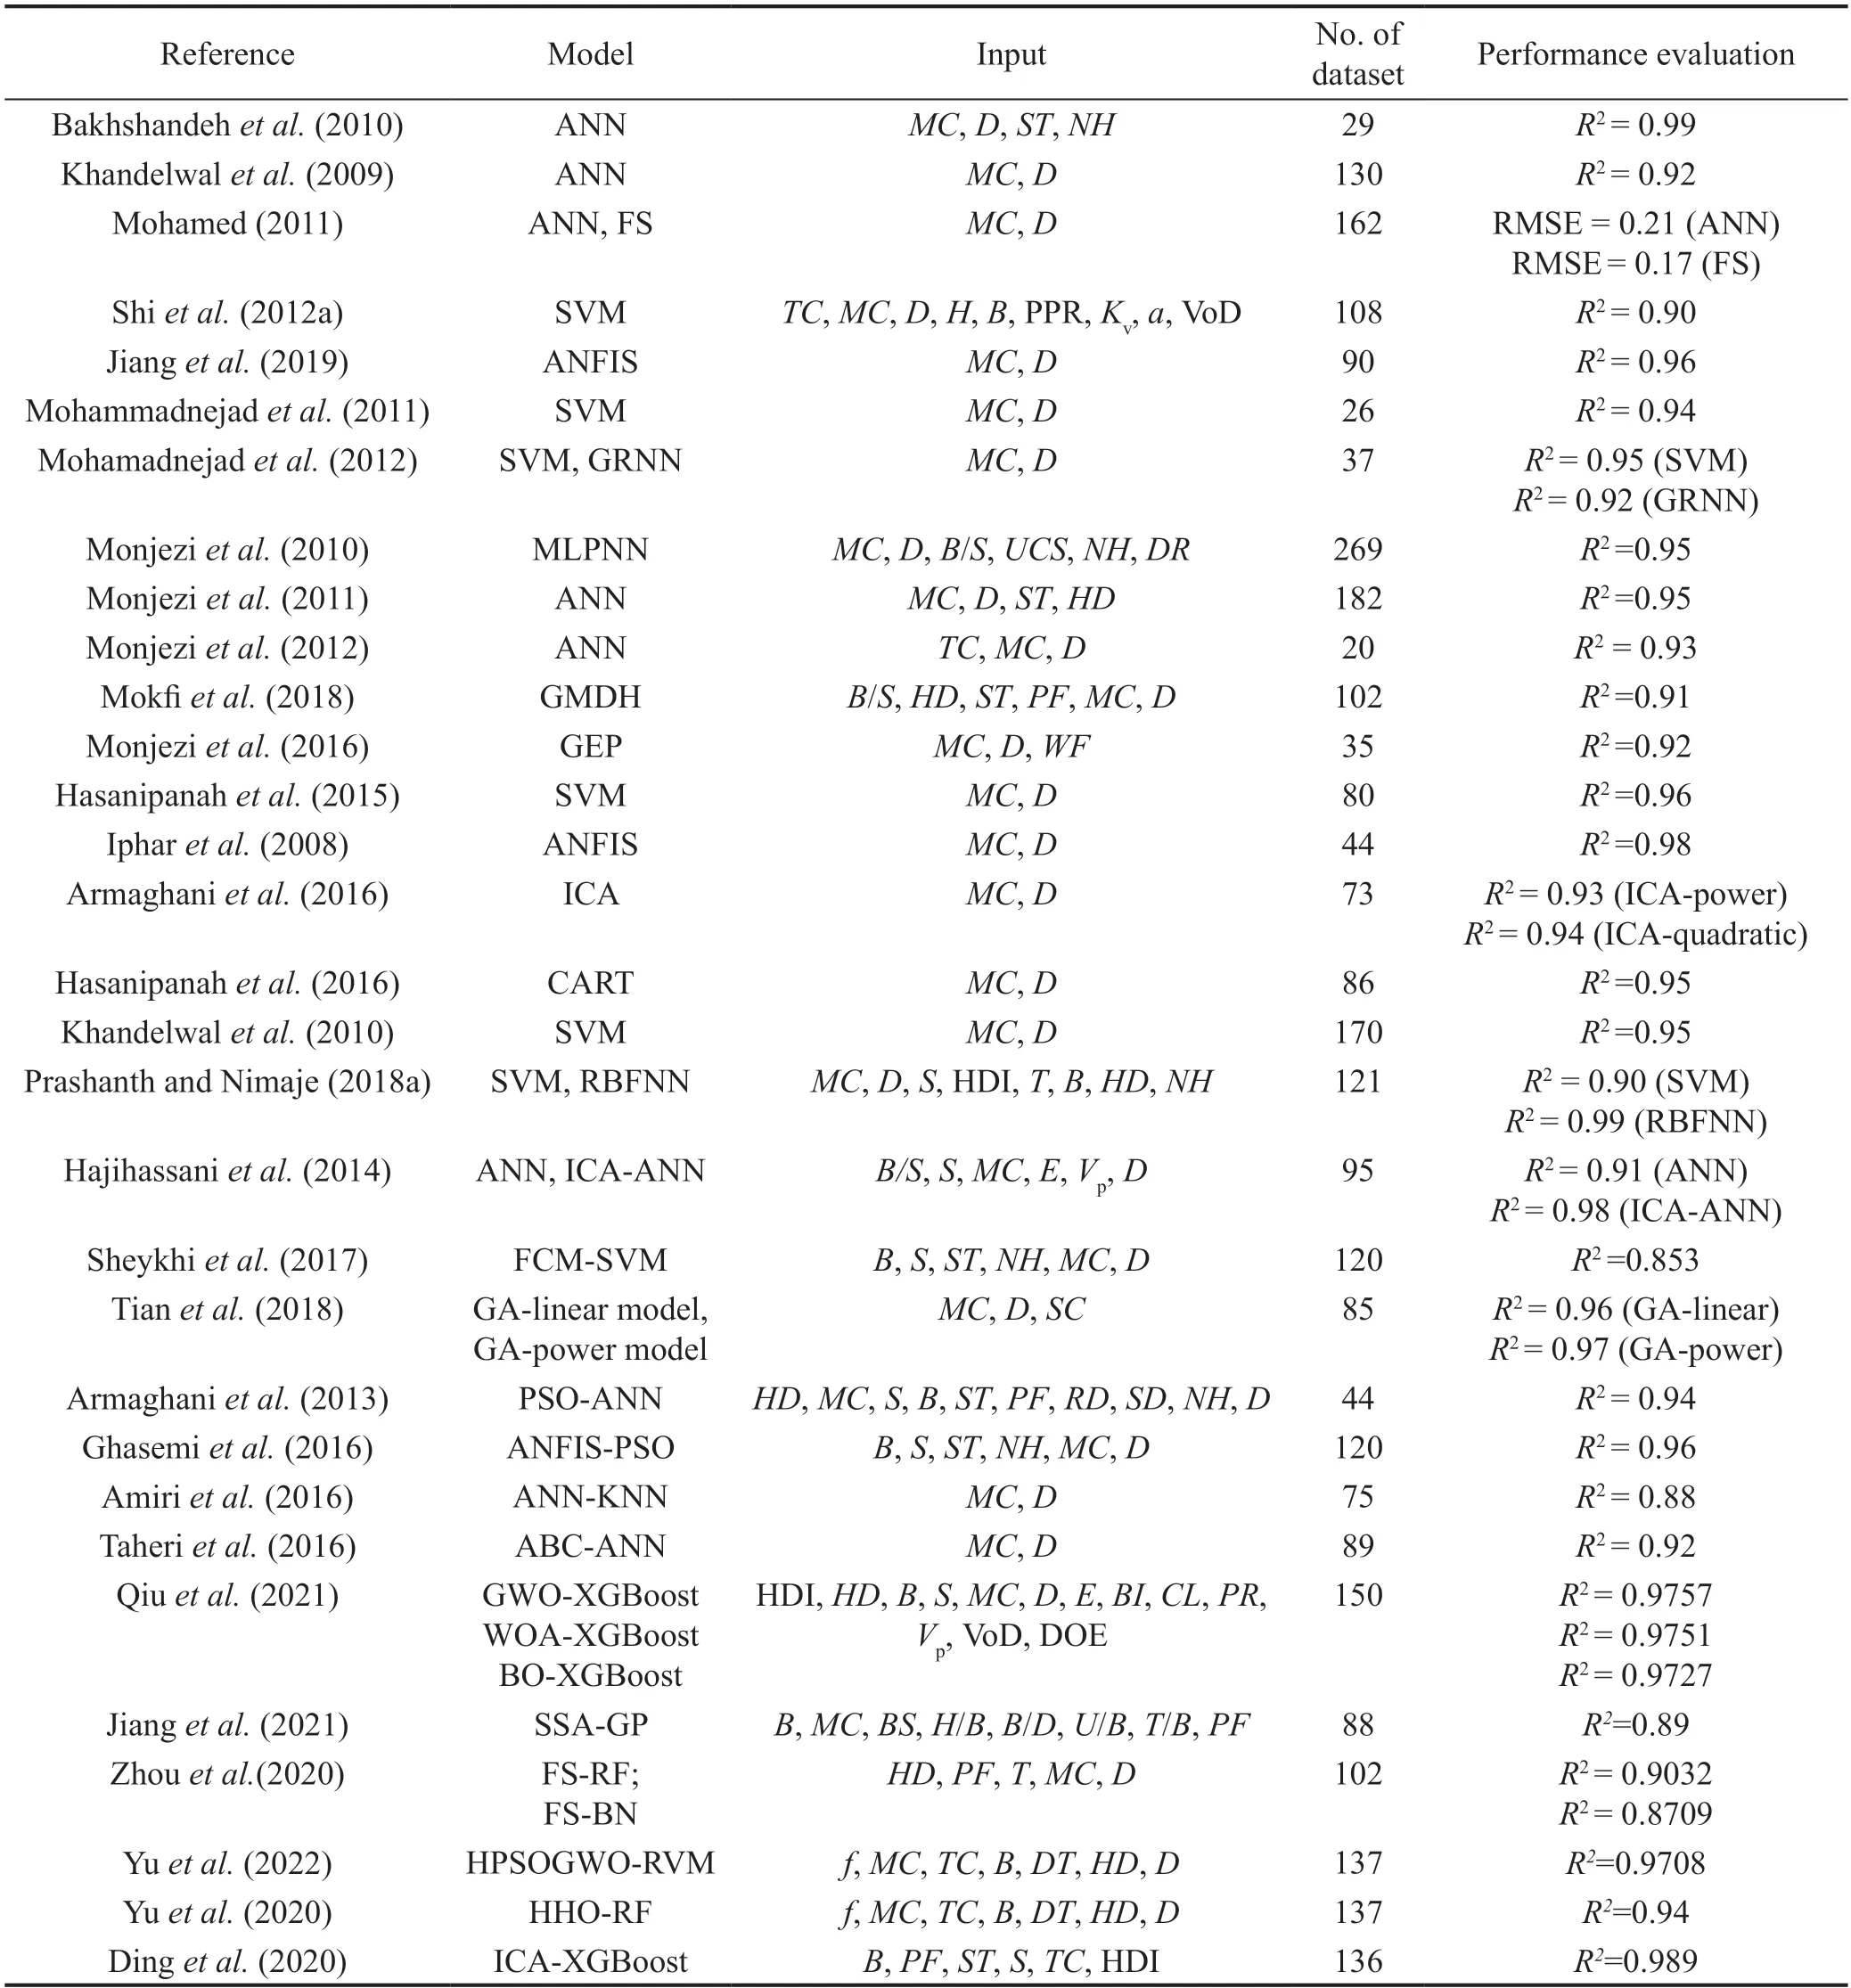
Table 2 Results of some studies in recent years regarding the prediction of PPV by using AI methods
The statistical values of the input and output parameters (i.e.,the maximum,minimum,mean,and standard deviation values) are listed in Table 3.Figure 1 shows a box graph of the parameters of the vibration records.As seen in Fig.1,except for the parametersDandH,the medians of all the parameters are not situated in the centers of the boxes.This suggests that the distributions of these parameters are asymmetric.
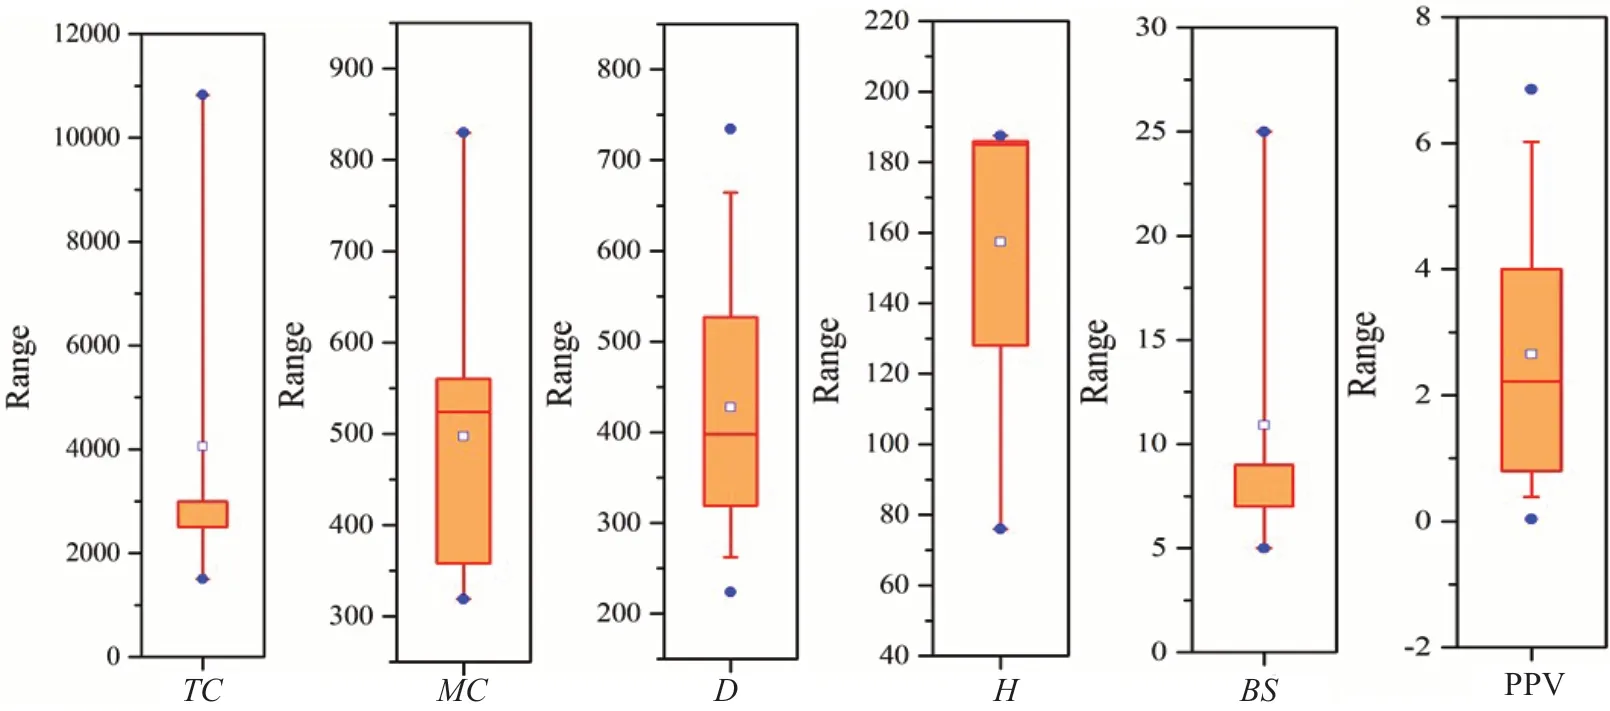
Fig.1 Box plots of input and output parameters
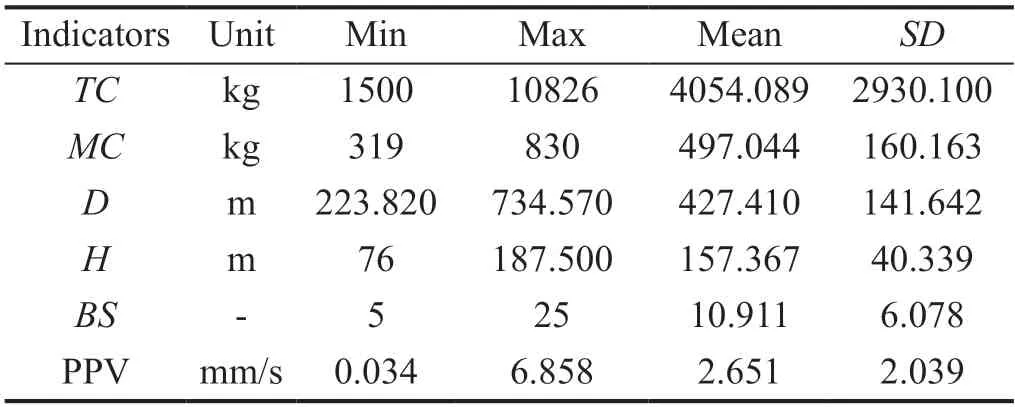
Table 3 Descriptive statistics of the input and output parameters
A scatterplot matrix of the dataset is presented in Fig.2.The histograms of each parameter are shownon the diagonal,and the correlations between the pairs of parameters are displayed in the upper panels,with numbers and asterisks.When the number is larger and there are more asterisks,the correlation is stronger.From Fig.2 it may be seen that the parameter PPV is highly correlated with the height difference between the blast point and the monitoring station.Moreover,all the parameters are widely distributed.

Fig.2 Scatterplot matrix of the dataset
3 Methods
In this section SVM and ABC are described.The details regarding the theories behind SVM and ABC have been presented in detail in the literature (Alshamlanet al., 2016;Wanget al.,2018;Yanget al., 2015).Thus,only basic descriptions are provided herein.
3.1 SVM algorithm
The SVM is one of the most widely used algorithms for classification and regression problems (Shiet al.,2012b).When SVM is used for regression,the main strategy is to find the plane that is closest to all the data in the set.Moreover,SVM can still achieve a satisfactory generalized performance if the number of cases is small.Thus,SVM is utilized in this study.
Consider a data setA={(x i,yi),i=1,2,...,n}and suppose it obeys the unknown functiony=g(x).Using SVM,the unknown function can be regressed using setA,and the regression function is:
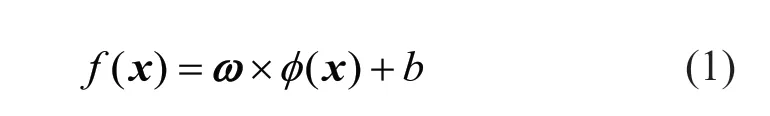
wherexirepresents the input vector of theith sample,yiis the target value of the sample,nis the number of samples,f(x) is the regression function,φ(x) is the highdimensional kernel-induced feature space,ωis a weight vector,andbis a bias term.
The Lagrange optimization method and optimal constraints are introduced for solving Eq.(1),and the decision function can be obtained as follows:

whereαiand′ are Lagrange multipliers that correspond to theith sample,andK(x,xi) is the kernel function.
The most used kernel functions are Gaussian radial basis functions (RBFs),sigmoid functions,linear kernel functions,and polynomial kernel functions.According to the literature (Mohammadnejadet al.,2011;Sheykhiet al.,2017;Shiet al.,2012a,2012b),the Gaussian radial basis kernel function outperforms the other three kernel functions.Therefore,RBF was used to establish the SVM model in this paper.The RBF kernel function can be expressed as follows (García Nietoet al., 2017):
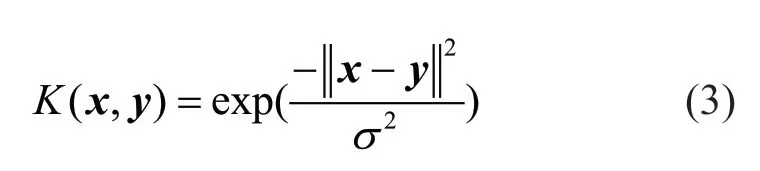
whereσis the width parameter of the RBF kernel function.
3.2 ABC algorithm
Karaboga (2005) proposed an optimization algorithm(i.e.,ABC algorithm) to simulate the search behavior of a bee colony.The ABC algorithm has been widely used to solve complex optimization problems (Badrinathetal.,2013;García Nietoet al., 2017;Perumal Sankaret al.,2017).ABC is more applicable than other classical optimization algorithms,such as the particle swarm optimization (PSO) and genetic algorithm (GA),due to their following characteristics: the algorithm is simple,it is easy to implement and robust;the precision of the optimization results is high;and the number of control parameters is small.Thus,the ABC algorithm was used to optimize the hyperparameters of the SVM technique.
In this algorithm each food source can be represented as a possible solution for a specified problem.Moreover,the fitness of each solution can be regarded as the amount of nectar that is associated with the solution(i.e.,the food source) (Taheriet al.,2016).The process of optimizing the ABC algorithm is a matter of finding the optimal solution.Bees are divided into three groups:scout,employed,and onlooker.In the ABC algorithm,the steps in searching for an optimal solution are as follows:
Step 1: Scout bees are responsible for finding new food sources.They then share this information with other bees in the form of a waggle dance.
Step 2: Based on Eq.(4),a group of scout bees act as employed bees to search for the honey source that is sought by the scout bees,and the fitness of each solution is obtained.If a new solution is superior to the previous solution in terms of fitness,it will be replaced;otherwise,this solution will be forgotten.
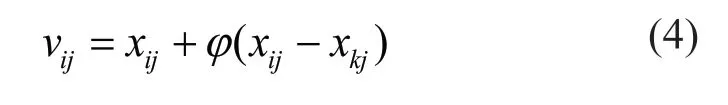
wherei∈(1,2,...,N),j∈(1,2,...,d),k∈(1,2,...,N),i∈(1,2,...,N)andφis a random number in the interval[-1,1].
Step 3: When all the searches have been completed,employed bees transmit the information to the onlooker bees in the form of a waggle dance.
Step 4: Onlooker bees select a honey source according to the probability of the food source (which is expressed in Eq.(5)),and the process returns to step 2.The onlooker bees are converted into employed bees during this step.

wherePiis the probability of theith solution being selected by the onlooker bees,and fitirepresents the fitness of theith solution.
Step 5: The above search process is repeated until the optimal solution is found.
To prevent falling into a locally optimal solution,a food source is discarded and stored in the taboo table when the maximum number of iterations of the food source has been reached without improving fitness.Meanwhile,the employed bee of the food source is converted to an onlooker bee via Eq.(6) and a new solution is randomly generated to replace the original food source.
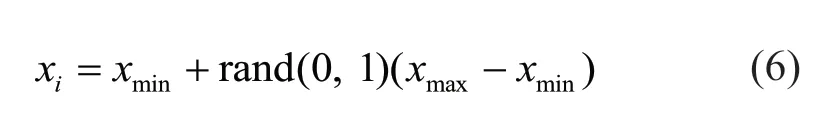
wherexmaxandxmindenote the maximum and minimum values,respectively,of the variables without normalization.
3.3 ABC-SVM
According to the SVM strategy,SVM performance is affected by the penalty factorCand the kernel function parameter.The optimal hyperparameters are obtained using a grid search method.However,the search may become trapped at a locally optimal solution(Alshamlanet al., 2016).To overcome this problem,the ABC algorithm was used to obtain the optimal hyperparameters of the SVM model.
In ABC-SVM,the searched food sources of bees provide the possible solutions for the SVM parameters.Next a hybrid ABC-SVM can be constructed for PPV prediction using the following steps:
Step 1: Data preparation.The dataset is divided into two parts,a training set and a testing set.To eliminate the effects that different parameters dimensions have,all of the data should be normalized via Eq.(7) (Zhouet al.,2016).
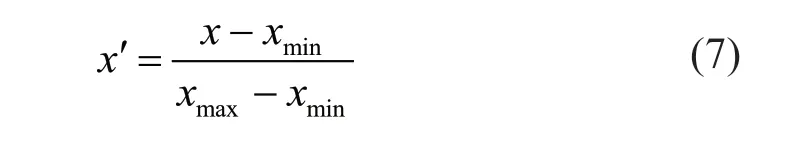
wherexandx′ are the values of the variables before and after standardization.
Step 2: Parameter initialization.The parameters of the ABC algorithm (which include the bee population,the maximum number of cycles,and the set limit) are initialized,and the initial solution (food source) is randomly generated via a scout bee.Thek-fold crossvalidation method is used to calculate the fitness function that corresponds to each solution.The RMSE is regarded as the fitness function value of the solution in this study.
Step 3: Neighborhood search.Employed bees search for a possible solution using a neighborhood search,and the fitness values of the original and new solutions are calculated and compared.If the RMSE of the original solution exceeds that of the new solution,the original solution is replaced;otherwise,it is retained.
Step 4: Determination of optimal solution.Onlooker bees regard the retained food source location as a new initial solution and perform a neighborhood search.During this process,the best solution is identified.Then,step 3 is repeated,and the globally optimal solution and the corresponding level of fitness are recorded.
Step 5: Application of the termination condition.If the result satisfies the termination condition,then the optimal solution of output is used as the optimal parameter.If it does not satisfy the termination condition,then the number of iterations is increased by one and the above process is repeated until the termination condition is satisfied.
Step 6: Model establishment and evaluation.Using the optimal parameters that are obtained,a hybrid model for predicting PPV is established,combining the ABC and SVM techniques,and performance and generalizability are evaluated on the testing set.
3.4 Model performance evaluation
Three statistical parameters (R2,RMSE,and VAF)were used to analyze the performance of the models.The performance of a predictive model is considered excellent ifR2is 1,RMSE is 0,and VAF is 100% (Amiriet al., 2016;Harandizadehet al.,2018;Leiet al., 2019).The mathematical equations for these three metrics are as follows:

wherenis the number of samples in the testing set,andPPVi,PPVmeanandPPVprespectively represent the measured,mean,and predicted values of PPV.
A flow chart for using a hybrid ABC-SVM model to predict PPV is shown in Fig.3.

Fig.3 Flow chart of ABC-SVM
4 Results and discussion
In this work,empirical models (USBM,A-H,L-K,and CMRI),SVM,and ABC-SVM were used to predict PPV.To develop these models the original dataset was randomly separated into two subsets,training and testing.The training set is typically used to optimize the hyperparameters of supervised learning algorithms and to develop predictors,and the testing set is used to evaluate the performances of the predictors.The sizes of the training set and the testing set can be determined by using optimization analysis (Qiet al.,2017).From optimization analysis and recommendations in the literature (Qiet al.,2019;Zhouet al., 2017,2019c),80% of the original data set (35 cases) was used as the training set and the remaining 20% of the data set (10 cases) was used as the testing set.
4.1 Predicting PPV using empirical models
The site constants must be determined to predict PPV using empirical methods (USBM,A-H,L-K,and CMRI).In this study the site constants were calculated via multiple regression analysis based on the training set,and the results are presented in Table 4.

Table 4 Obtained values of the site constants
The testing set,which was not used to train the predictors,was employed to analyze the performances of the empirical predictors.The relationship between the measured and predicted PPV values obtained using the empirical predictors are shown with respect to a line with a 1:1 slope,as plotted in Fig.4.Compared with the distributions of scatter points for the USBM,CMRI,and L-K predictors,the scatter points from the A-H predictor are distributed along a line with a 1:1 slope,and the dispersion was relatively small.Moreover,theR2values of the empirical predictors ranged from 0.1146 to 0.5074.The A-H predictor had the highest the correlation coefficient (0.5074),followed by the USBM,CMRI and L-K predictors,which had correlation coefficients of 0.3560,0.2209,and 0.1146,respectively.The results demonstrate that the A-H predictor is more suitable than the USBM,CMRI,and L-K predictors for predicting PPV in the Hongling Lead-zinc Mine.
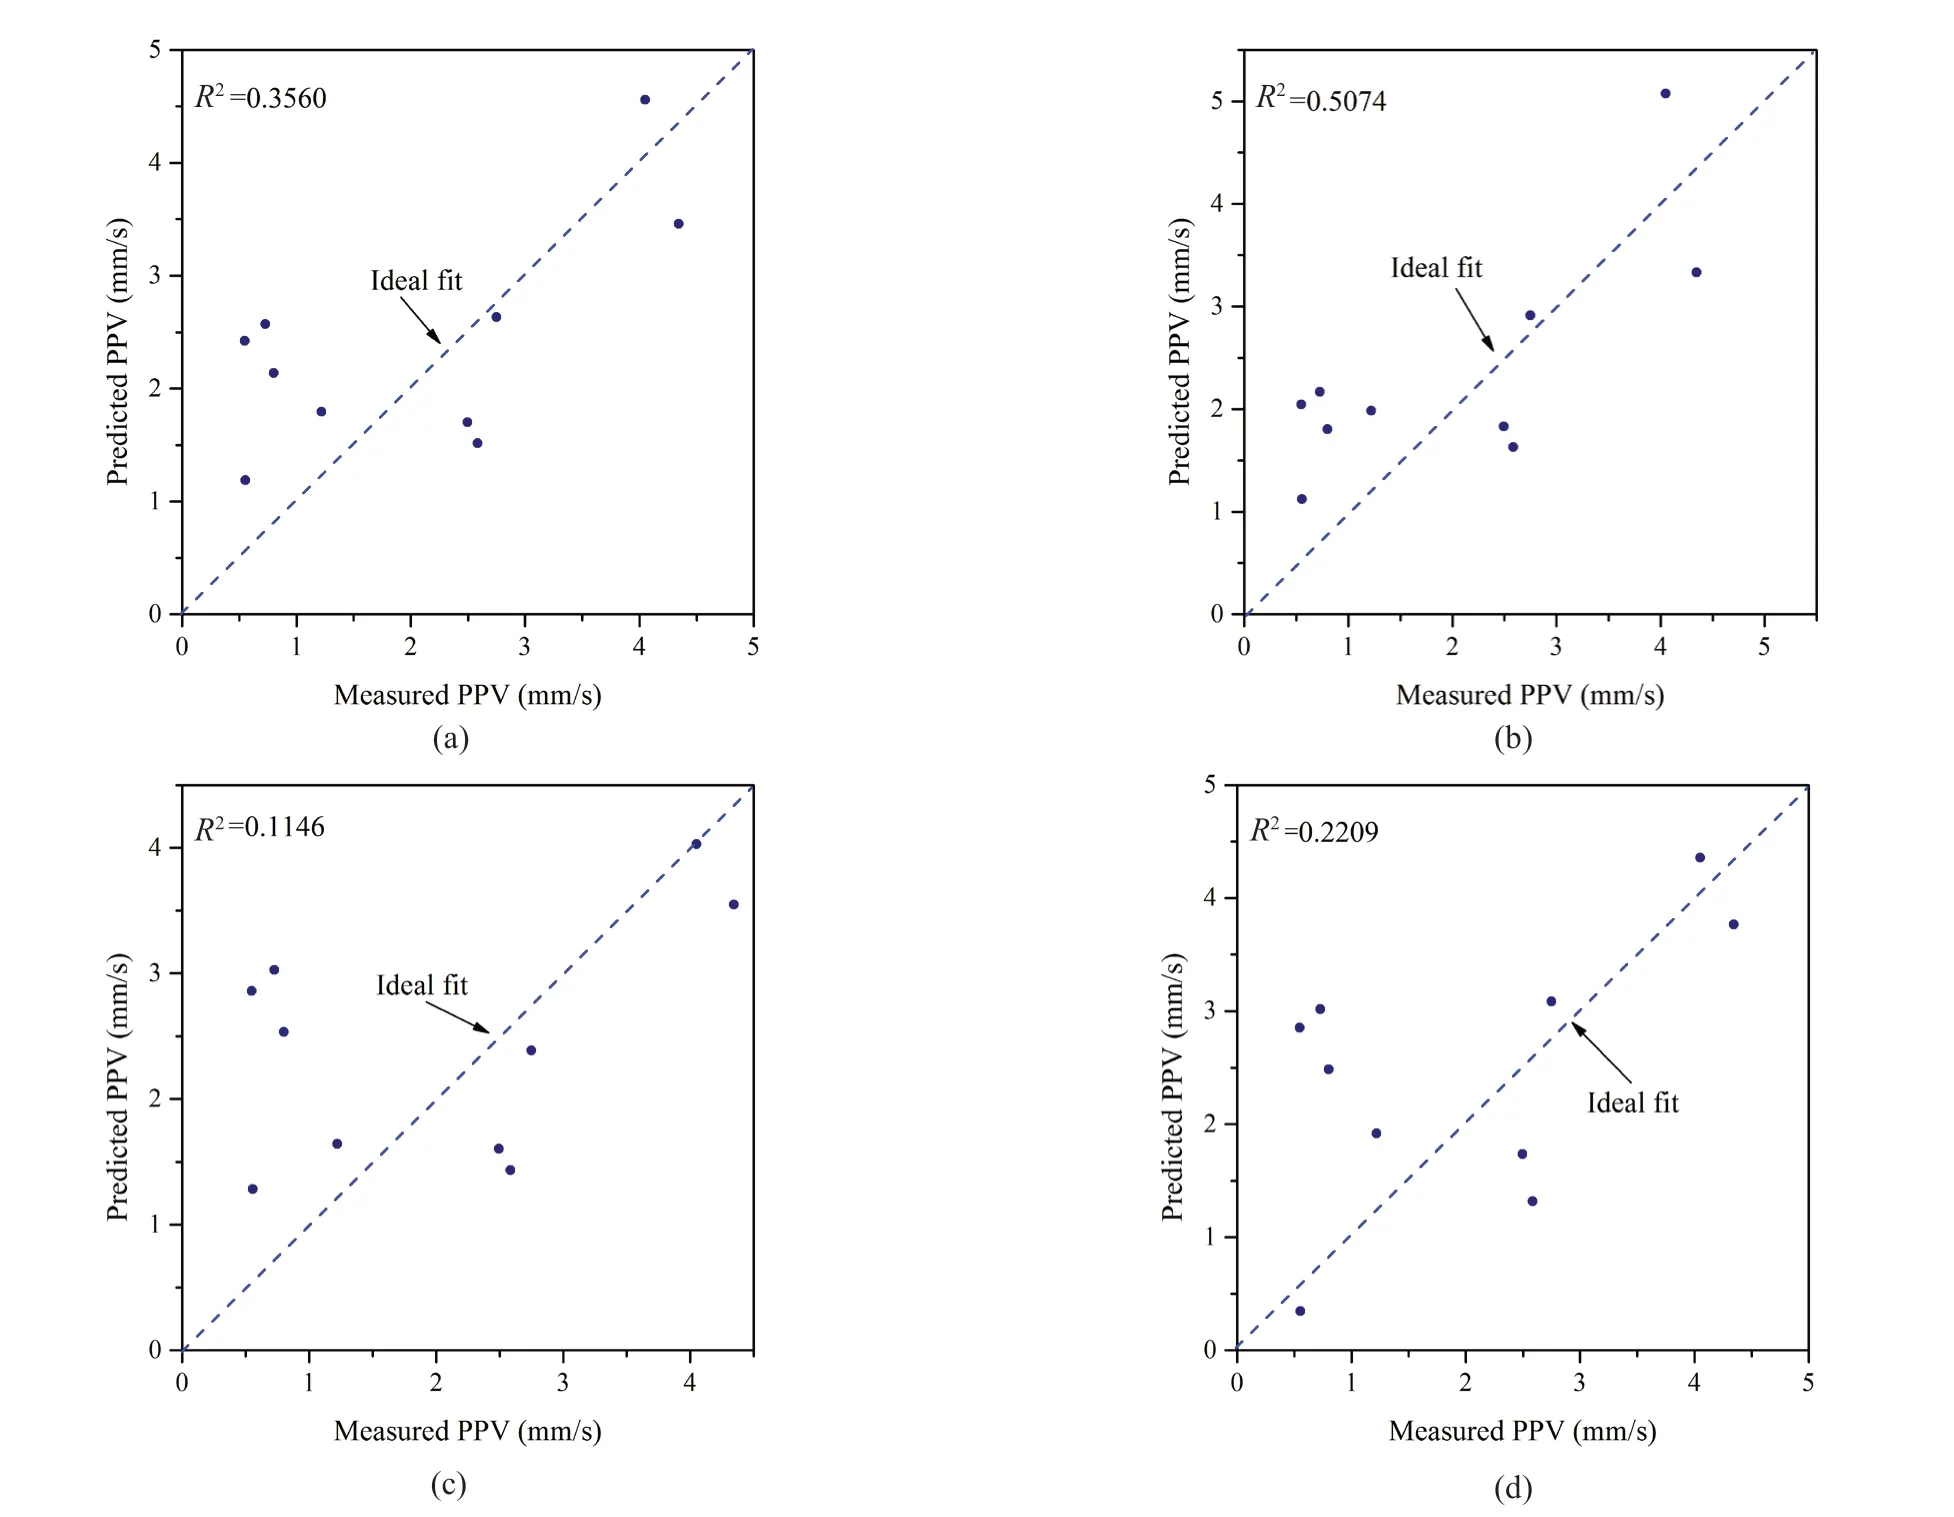
Fig.4 Measured versus predicted PPV values that were obtained using various empirical methods: (a) USBM,(b) A-H,(c) L-K,and (d) CMRI
4.2 Predicting PPV using SVM and ABC-SVM
Thek-fold cross-validation (CV) method (Linet al., 2018b) has been widely used to optimize thehyperparameters of machine learning algorithms and was used as the validation method in this study.During the CV process,kindividual RMSEs were generated.The parameters for the regression model that is associated with the minimum RMSE are the optimal parameters.The CV process is based on the original training set.In this study,kis 5 because of the size of the training set.
As described,the SVM prediction performance is affected by the penalty factorCand the parameters of the RBF kernel functionσ.In this study,an SVM model was developed using LIBSVM in Matlab 2014a;Candσwere obtained via a grid searching method that is coupled with 5-fold CV.As described in section 3.1,the higher the value ofC,the easier it is to overfit the model.The smaller the value ofC,the easier it is to underfit.If the value ofCis too large or too small,the generalization ability becomes poor.Moreover,the larger the value ofσ,the fewer the support vectors,and the smaller the value ofσ,the more support vectors.The speed of training and prediction is affected by the number of support vectors.Meanwhile,the parameter space was searched with the understanding that the results of the SVM algorithm change substantially if the parameters increase or decrease by a power of 10(García Nietoet al.,2017).The tuning parameters wereC∈[10-6,104]andσ∈ [10-6,104]with a 5-fold CV process.The optimization method described above was used,and the values of 8 and 8 were obtained forCandσ,respectively.
In ABC-SVM,the architecture of the SVM was tuned using ABC before use that was based on the mean RMSE from a 5-fold CV.The search space of the hyperparameters is the same as for the SVM space.For ABC,the bee population size was 80,the maximum number of cycles was 100,the set limit was 50,and the convergence threshold was 10-5.The results demonstrated that the optimized SVM parameters wereC=11.6441 andσ=10.288.
The SVM and ABC-SVM models were built using the obtained hyperparameters,and then the models were applied to the testing set.Figure 5 shows the plots of the relationship between the measured and predicted PPV values for the two predictors with respect to a line with a 1:1 slope.TheR2values for both ABC-SVM and SVM exceed 0.9;hence,the generalization and prediction performances of ABC-SVM and SVM are highly satisfactory.

Fig.5 Measured versus predicted PPVs,using SVM and ABC-SVM: (a) SVM and (b) ABC-SVM
4.3 Comparison of the models
The results (including the predicted PPV,R2,RMSE,and VAF) obtained using ABC-SVM were compared with those obtained using SVM and empirical predictors to analyze the performance of the ABC-SVM model.The predicted PPVs of the six predictors and the measured PPV are plotted in Fig.6.The PPVs predicted by ABCSVM and SVM are closer to the measured PPV,whereas the values predicted using the empirical predictors vary widely,which suggests that ABC-SVM and SVM have a higher degree of accuracy than do the empirical methods.
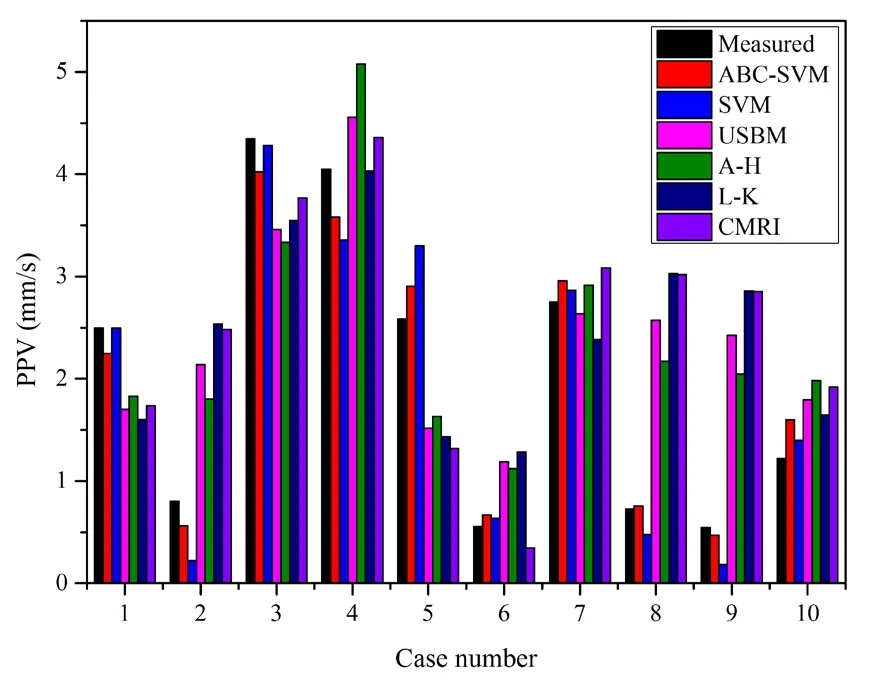
Fig.6 Comparison of PPVs that were obtained using several methods
Table 5 lists theR2,RMSE,and VAF values of the PPVs that were predicted using the ABC-SVM,SVM,and empirical methods.TheR2,RMSE,and VAF values of the six predictors exhibit large deviations (R2=0.1146-0.9628,RMSE=0.2737-1.3131,and VAF=17.64%-96.05%).ABC-SVM had the highestR2and VAF values,followed by the SVM,A-H,USBM,CMRI,and L-K methods.The order of the six predictors is the opposite for RMSE.From these results,it is concluded that the ABC-SVM model is more accurate than the SVM and empirical methods for predicting PPV.Moreover,both ABC-SVM and SVM achieve higher efficiency than do the empirical methods,and the prediction performances of ABC-SVM and SVM are both highly satisfactory and consistent with field observations.
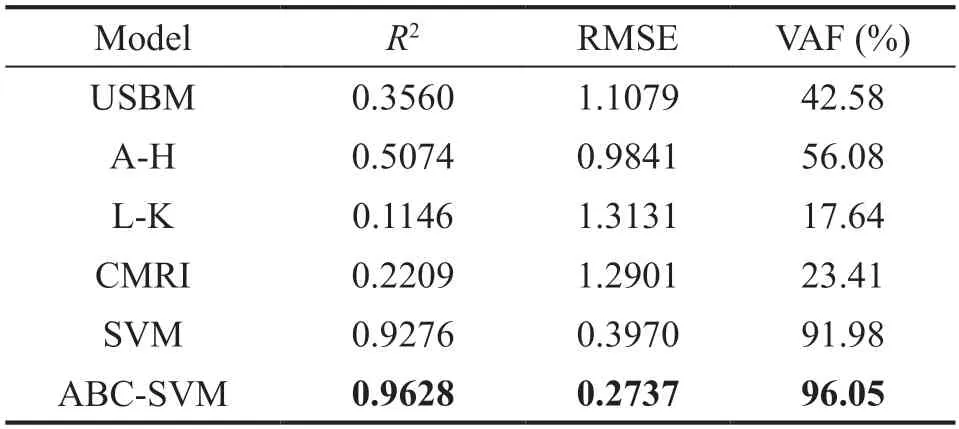
Table 5 Performance results of different models used to predict PPV
The SVM and ABC-SVM models obtain more accurate prediction results in less running time compared to the empirical models.Thus,we conclude that the empirical models are not satisfactory methods for predicting PPV in the Hongling Lead-zinc Mine.
The Taylor diagram was first proposed by Karl E.Taylor (Taylor,2001).Due to the consideration of multiple evaluation indexes (correlation coefficient,centered root-mean-square and standard Deviation),Taylor diagrams are widely used in various fields,including meteorological,geotechnical engineering evaluation,etc.Compared with a single model evaluation index,the Taylor diagram is more intuitive for the performance between models.To show additional comparison and analysis of the developed and empirical models,the Taylor diagram in Fig.7 was used.From the results,it can be found that the result of the ABCSVM model in predicting PPV was the best among the six models.
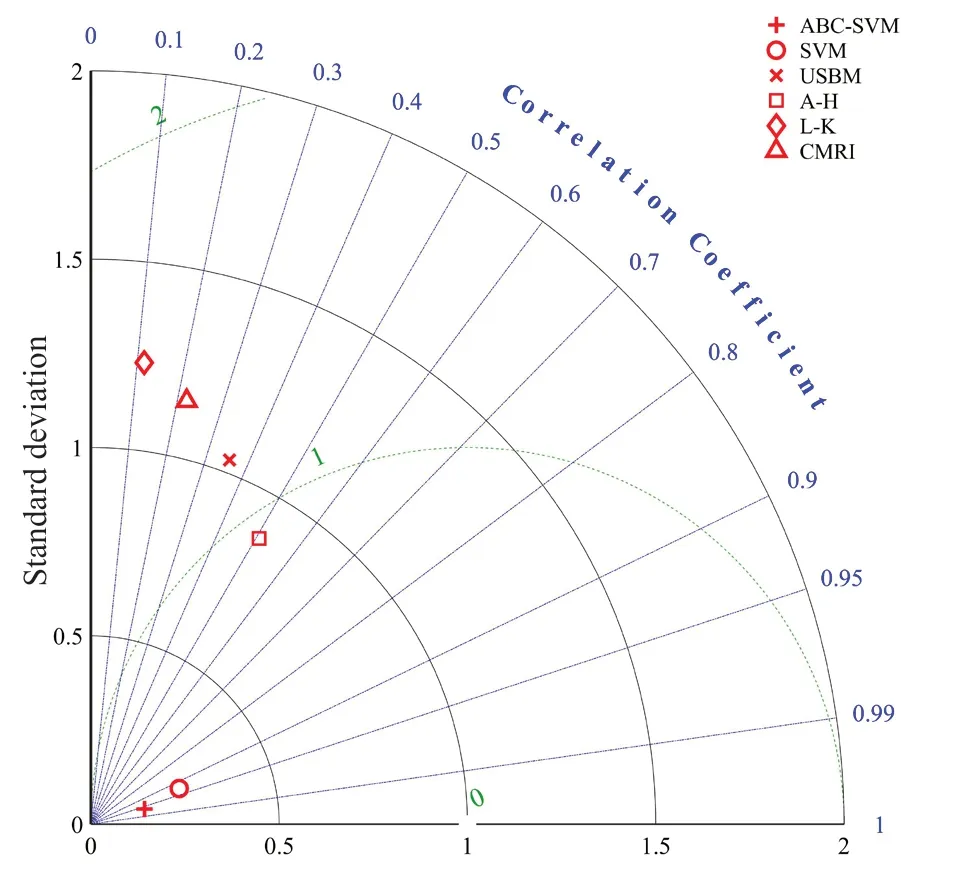
Fig.7 Performance comparison using a Taylor diagram
4.4 Sensitivity analysis
The sensitivities of the input parameters for PPV were also analyzed.The sensitivities of the five input parameters were determined using the cosine amplitude method,which was introduced by Yang and Zhang(1997).In this method,the sensitivity of each parameter is calculated as the strength of the corresponding relationship.In brief,this method can be expressed in the following equation:

whererijis the strength of the relationship between the input and output parameters,xiis the input parameter,xjis the output parameter (PPV),andnis the size of the dataset.
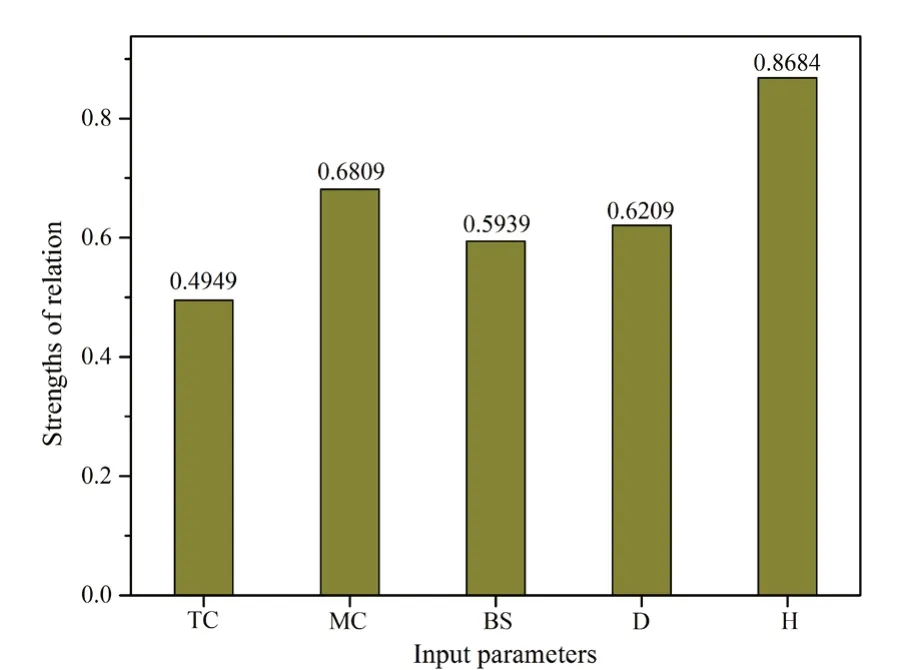
Fig.8 Bar graph of each variable for PPV cases
Figure 8 shows plots of the strengths of the relationships among the five input parameters and PPV(the output parameter).All five input parameters are sensitive to the output parameter (PPV).The height difference between the blast point and the monitoring station (H) is the most influential parameter for PPV.The order of sensitivity for the five input parameters isH>MC>D>BS>TC.
The seismic waves generated by blasting can be divided into transverse and longitudinal waves.As the vertical and horizontal distances increase,the blasting vibration effect becomes smaller.Therefore,as a result,HandDmust have a great influence on PPV.In addition,according to the analysis of the measured data in this manuscript,as shown in Fig.2,the correlation between PPV andHis the largest.Of course,many factors have a significant influence on PPV,but based on the measured data,PPV is the most sensitive toH.
5 Limitations
Although the results of the study have demonstrated that the prediction performance of ABC-SVM is satisfactory,there are various limitations that must be addressed in future research.First,the dataset was relatively small,as only 45 cases were used to develop the predictor.A larger dataset should be collected to improve the performance of the predictor.Moreover,the sensitivities of the input parameters also depend upon the size of the dataset.Hence,if additional valid data are available,then more representative results can be obtained.Second,only five factors were considered as input parameters.However,PPV is affected by many types of factors,such as blast design parameters and rock mass properties.Therefore,additional input parameters should be considered and analyzed to improve the reliability of the model.Third,the parameters of the ABC algorithm substantially influence the performance of ABC.Thus,the structure of the ABC algorithm should be optimized.Last,studies in the literature have shown that other machine learning algorithms (such as the random forest (RF) (Zhouet al., 2019b) and gradient boosted machine (GBM) (Zhouet al., 2019a) algorithms) can be used to achieve excellent performance in nonlinear relationship modeling.However,they have not been used for predicting PPV.Therefore,the PPV prediction performance of the RF and GBM models should be investigated and compared in future research.
6 Conclusions
In this study,a hybrid ABC-based SVM model was constructed and used to predict PPV that is induced by blasting at the Hongling Lead-zinc Mine.To develop the model,a dataset of 45 cases was recorded in the mine,and five parameters (the total charge,the maximum charge that is used per delay,the distance between the blast face and the monitoring point,the difference in height between the blast point and the monitoring station and primary blasting segments) were measured as the input parameters.PPV values comprised the output.The ABC algorithm was applied to improve the generalization ability of the SVM algorithm.Based on the analysis,the following conclusions can be drawn:
(1) To evaluate the performance of the generated ABC-SVM model,the model was compared with SVM and four empirical predictors (USBM,A-H,L-K,and CMRI),and three performance metrics (R2,RMSE,and VAF) were introduced to analyze the generalization performance of the models.
(2) The results demonstrated that both the ABCSVM and SVM predictors achieved higher accuracy than did the empirical predictors.The best results of theR2,RMSE,and VAF indices were 0.9628,0.2737,and 96.05% for the ABC-SVM model;hence,the hybrid model exhibits outstanding PPV prediction performance.In decreasing order of performance,the six predictors are: ABC-SVM,SVM,A-H,USBM,CMRI,and L-K.
(3) According to sensitivity analysis,the height difference between the blast point and the monitoring station is the most influential parameter for predicting PPV.The sensitivity analysis results of the parameters can provide potential directions for the control of blasting vibration effects.For example,we can reduce the impact of blasting vibration by controllingH,MC,andD.
Acknowledgment
National Natural Science Foundation of China(NSFC) under Grant Nos.52104125 and 52104109,the Fundamental Research Funds for the Central Universities under Grant No.B220202056,the Opening Fund of State Key Laboratory of Mining Response and Disaster Prevention and Control in Deep Coal Mines under Grant No.SKLMRDPC21KF04,the Natural Science Basic Research Plan in Shaanxi Province of China (2022JQ-304),and the Fund of Young Elite Scientists Sponsorship Program by CAST under Grant No.2021QNRC001.
杂志排行

Earthquake Engineering and Engineering Vibration的其它文章
- Innovative mitigation method for buried pipelines crossing faults
- Study on time-varying seismic vulnerability and analysis of ECC-RC composite piers using high strength reinforcement bars in offshore environment
- Optimization of design parameters for controlled rocking steel braced dual-frames
- Seismic response of selective pallet racks isolated with friction pendulum bearing system
- Reliability and sensitivity analysis of wedge stability in the abutments of an arch dam using artificial neural network
- Steel rings as seismic fuses for enhancing ductility of cross braced frames