Determination of rill erodibility and critical shear stress of saturated purple soil slopes
2022-09-26DndnLiXioynChenZhenHnXiojieGuYnhiLi
Dndn Li ,Xioyn Chen ,*,Zhen Hn ,Xiojie Gu ,Ynhi Li
a College of Resources and Environment/Key Laboratory of Eco-environment in Three Gorges Region(Ministry of Education),Southwest University,Chongqing,400716,China
b College of Forest,Guizhou University,Guiyang,Guizhou Province,550000,China
Keywords:Critical shear stress Erodibility Detachment capacity Rill erosion Saturated purple soil
A B S T R A C T The hydrological conditions near the soil surface influence the soil erosion process,as determined by the soil erodibility and critical shear stress.The soil erodibility and critical shear stress of saturated purple soil slopes were computed and compared with those of unsaturated purple soil slopes.The detachment capacities computed through the numerical method(NM),modified numerical method(MNM)and analytical method(AM),from rill erosion experiments on saturated purple soil slopes at different flow rates(2,4,and 8 L min-1)and slope gradients(5,10,15,and 20°),were used to comparatively compute the soil erodibility and critical shear stress.The computed soil erodibilities and critical shear stresses were also compared with those of unsaturated purple soil slopes.At the different slope gradients ranging from 5° to 20°,there were no significant differences in the soil erodibilities of the saturated purple soil and also in those of the unsaturated purple soil.The critical shear stresses slightly varied with the slope gradients.The saturated purple soil was relatively significantly more susceptible to erosion.The NM overestimated the soil erodibility of both saturated and unsaturated soils by 31%and underestimated the critical shear stress.The MNM yielded the same soil erodibility and critical shear stress values as the AM.The results of this study supply parameters for modeling rill erosion of saturated purple soil slope.
1.Introduction
Rill erosion,a special type of water erosion process,causes high loss of soil particles,thereby seriously intensifying land degradation,which threatens the sustainable development of agriculture(Abbas et al.,2019;Chen et al.,2016;Komissarova & Paramonova,2019;Miao,2010).Rill erosion has received extensive attention from researchers.The increasing attention to this issue has led to improvements in soil erosion control measures.Researchers have developed and applied process-based erosion models,such as the Water Erosion Prediction Project(WEPP)model,to quantify soil loss.Soil erodibility and critical shear stress are important indexes to evaluate the degree of soil vulnerability to erosion and the ability to resist shear deformation due to water flow,which have been adopted as important indicators in the WEPP model(Nearing et al.,1989;Wang et al.,2013).
The soil erodibility parameter is defined as the increase in detachment rate for each additional unit of shear stress.To obtain the detachment rate,scientists have devoted great efforts to experimental and computational methods.In general,the methods include analytical and numerical ones.The analytical method has been used to estimate the detachment rates based on the derivative of the function between sediment load and rill distance.Lei et al.(2005)proposed an analytical method for calculating the rill detachment rate from the relationship of sediment concentration and rill length of loess soil.Chen et al.(2017)verified that their method was rational and applicable to determine the rill detachment rate of unsaturated purple soil.Numerical method has been employed to determine the detachment rate with experimental data and has been explored by many researchers(Knapen et al.,2006,2007;Poesen et al.,2003).To some extent,studies have indicated that there were systematic errors in the numerical results,which had high discrepancies with the analytical values(Huang et al.,2020;Wan et al.,2019).Wan(2019)used a modified numerical method to reduce the systematic error in computing the detachment rates with the numerical method and proved the applicability in calculating the rill detachment rate of thawedfreezing-soil slope.Then,Huang(2020)verified that the proposed modified numerical method can be used to estimate the rill detachment rate of saturated and unsaturated loess soils.The modified numerical method(MNM)was reportedly verified to produce the detachment rate similar to those achieved by analytical method.
As the important model parameters of the process-based soil erosion process,the soil erodibility parameter and critical shear stress play significant roles in modeling rill erosion on hillslopes.Thus,scientists have devoted their great efforts to determine those parameters.Rose et al.(1983)found that rill erosion is initiated when the shear stress of runoff reaches a certain value,which is assumed to be the critical value of rill erosion.Gilley et al.(1993)suggested the relationship between the soil erodibility parameter and the rill detachment capacity and outlined a corresponding calculation method through field experiments.Lei et al.(2008),Xing,Chen,et al.(2018)and Xing,Huang,et al.(2018)indicated that the soil erodibility does not substantially change,while the critical shear stress slightly increases with increasing slope gradient.In summary,numerous studies have investigated the effect of the soil detachment capacity and different hydraulic parameters to better quantify the soil erodibility and critical shear stress while ignoring the effect of near-surface hydrological conditions.An increasing number of studies have indicated that near-surface hydrological conditions notably impact soil erodibility.
Nouwakpo et al.(2010)emphasized that the soil erodibility increased by 5.64 times and the critical shear stress decreased by 0.2~1.0 Pa under the influence of near-surface hydrological conditions.Al-Madhhachi et al.(2013)conducted an erosion experiment to demonstrate that the soil detachment rate and runoff shear stress depend on near-surface hydrological conditions.Xing,Chen,et al.(2018)and Singh et al.(2016)proposed that changes in the soil moisture content lead to rapid changes in the critical shear stress.Su et al.(2019)observed that both the detachment rate and flow shear stress increase while the critical shear stress decreases with increasing discharge under three hydrological conditions ranging from seepage to drainage.These studies indicate that changes in near-surface hydrological conditions highly affect soil erodibility,which in turn triggers intense soil erosion.
During a heavy rain event,infiltrated water accumulates on top of a low-infiltration purple soil layer with typical A-C development,with the C layer exhibiting low permeability,which causes the cultivated A layer to remain saturated(West,2006,pp.519—522).The soil saturation,as a specific near-surface hydrological condition,causes notable changes in the soil aggregate structure,soil cohesion,pore water pressure,and surface roughness(Bullock et al.,1988),which lead to severe erosion.As a significant index of the soil erosion process model,the detachment rate plays an important role in analyzing erosion characteristics.Although existing studies have estimated the detachment rate with analytical,numerical and modified numerical method on loess soil slopes,the error of numerical method and the correctness of the analytical and modified methods remain to be verified.Huang(2020)focused on the validation of the soil detachment rate and ensured the accurate measurement of soil erodibility on saturated loess soil slopes.Regarding these issues,the properties of saturated and unsaturated soil slopes largely differ due to their mechanics,hydrology and structure,all of which may lead to large discrepancies in their erodibilities(Han et al.,2020),which deserves further study.
The objectives of the current study are to:1)compute the soil erodibility parameter and the critical shear stress of saturated and unsaturated purple soil slopes,2)determine the difference in the soil erodibility parameter and critical shear stress between these two soils,and 3)compare the soil erodibility parameter and critical shear stress estimated with the analytical method,modified numerical method and numerical method.
2.Experimental materials
2.1.Experimental soil materials
The experimental soil,a typical purple soil,was obtained from Beibei,Chongqing,China.The collected soil materials were air dried,crushed or ground and passed through a 1.0-cm mesh.Based on laboratory measurements,the soil was classified with a Mastersizer 3000 laser particle analyzer(Malvern,UK).The particle size distribution was 53.10% sand particles(>0.05 mm),33.90% silt particles(0.005—0.05 mm),and 13.00%clay particles(<0.005 mm).The test soil exhibited a sandy loam texture and a bulk density of 1.3 g cm-3in the field.The water-stable aggregate(>0.25 mm)proportion was 34.3%.
2.2.Experimental equipment and process
A steel platform with an adjustable slope gradient was adopted in this study.The soil flume used in the experiment was divided into 10 rills/strips by steel plates,and the 10 rills/strips were 8 m long,0.1 m wide and 0.35 m deep.Nine separate strips(0.1 m wide)were established at the middle to form rills,and the outermost strip in the soil flume was reserved to install the water supply tubes that supply water to saturate the soil profile(Fig.1a).Clay soil materials(5 cm-thick)were filled at the bottom of the soil flume to seal the gap between the soil flume and the steel platform.The clay layer was also used to simulate a weakly permeable soil layer.A layer of coarse sand approximately 0.02 m in thickness was used to cover the seepage tubes to saturate the experimental soil layer.The seepage tube with small holes of 2.0 mm in diameter was arranged in an interval of 1.0 m in the soil flume,horizontally passing through all 9 flume strips.The seepage holes were wrapped with textile fiber clothing to prevent the holes from being clogged.This horizontal tube was employed to supply water into and saturate the soil profile.Each of the horizontal seepage tubes was connected to a vertical tube,whose length equaled the depth of the experimental soil,to allow the water level to reach the soil surface.A horizontal tube was used as a water supply tube to deliver water flow from the water source to the seepage unit.The experimental soil was 20 cm thick,which was filled in four layers at a bulk density of approximately 1.3 g cm-3(Fig.1b).The experimental working principle chosen to create the saturated soil slope was the same as that used by Huang et al.(2018).Water was continuously supplied to the slope,and a portion of the provided water slowly flowed from the soil surface.By slowly flowing water through the entire slope,the soil slope was fully saturated.When the experimental soil surface reached complete saturation,the water supply conditions remained unchanged before the experiments,which considered various flow discharge levels and slope gradients.No water was supplied to the bottom of the flume during the unsaturated soil slope experiments.During the experimental process,sedimentladen runoff samples were harvested at outlets of the flumes at the rill lengths of 1,2,3,4,5,6,7,and 8 m.Three samples were taken at each experimental run and were oven-dried for 48 h before the measurements of sediment concentrations.Flow velocities were measured with the electrolyte tracing method(Huang et al.,2018;and Lei et al.,2005).

Fig.1.Experimental equipment diagram.
2.3.Experimental layout
Four experimental slopes of 5°,10°,15°,and 20°and three flow discharge levels of 2,4 and 8 L min-1were used in the experiments to cover wide a range of rainfall intensities.A peristaltic pump was adjusted to the specified flow rate before the start of the test.After the water flow had stabilized,the rill flow velocity was estimated via the electrolyte tracing method.During the experiments,sediment-laden water samples were collected at the outlets of the rills of various lengths(1,2,3,4,5,6,7,and 8 m).The sediment concentration of the sediment-laden water samples was measured with the oven-drying method.
3.Computational methods
3.1.Analytical method for calculating the rill detachment capacity
Huang et al.(1996)and Chen et al.(2015)proposed the relationship between sediment concentration and rill length as:

wherecis the sediment concentration,kg m-3;Ais the maximum sediment concentration at sediment transport capacity,kg m-3;Bis a coefficient to represent the increase speed of sediment concentration in the rill flow,m-1;andxis the coordinate of rill length,m.
The Analytical Method(AM)to compute the detachment rate can be expressed as a function of the sediment load and rill length as(Eq.(2)):

whereDrAis the rill detachment rate computed with the AM,kg m-2s-1;qis the unit-width flow rate,m2s-1.
With Eqs.(1)and(2),the rill detachment capacity is computed as:

whereDcAis the rill detachment capacity computed analytically,kg m-1 s-1.
3.2.Numerical method for computing the rill detachment capacity
Conventionally,the numerical detachment rate is computed with the increment in the sediment concentration over a given rill length before being positioned at or assigned to the end of the spatial interval.Giving the measured sediment concentrations at rill length ofx1,x2,…,andxnbeingc1,c2,…,andcn,the numerical detachment rate is computed as follows:

The numerically computed detachment rate by Eq.(4)is typically notably higher than those analytically determined with Eq.(2).Wan(2019)developed a method to reduce the systematic error in the algorithm method.In this methodology,the numerically computed detachment rate was assigned to or positioned at the midpoint of the sediment or spatial interval.This detachment rate calculation method was referred to as the modified numerical method(MNM),given as:

whereDrMNMis the rill detachment rate computed with the modified numerical method,kg m-1s-1;ciandci-1are the sediment concentrations at rill lengths ofxiandxi-1,respectively,kg m-3;xis the rill length coordination,m;andqis the unit-width discharge rate,m2s-1.
According to Chen et al.(2017),the rill detachment rate is given as:
And the detachment capacities for the NM and MNM,DcNMorDcMNMare given as:
wheredNMordMNMis the rill detachment capacity at a sediment concentration of zero,kg m-2s-1;eNMoreMNMis a coefficient that defines the decreasing rate of the detachment rate with respect to sediment concentration,m s-1.
The rill erodibility and critical shear stress are computed based on rill detachment capacity with Eq.(3)(AM).Equations(7)and(8)are used to compute the parameters with the NM and MNM,respectively.
3.3.Shear stress,soil erodibility and critical shear stress
The flow shear stress is expressed as follows:

where τ is the flow shear stress,Pa;sis the hydraulic slope,sin(a);γ is the specific gravitation of water,9800 N m-3;his the water depth,m;vis the flow velocity,m s-1;andqis the unit-width flow rate,m2s-1.
In the WEPP model,the relationship between the soil erodibility,critical shear stress and rill detachment rate is given as:
whereDris the rill detachment rate,kg m-2s-1;Kris the soil erodibility parameter,s m-1;τcis the critical shear stress,Pa;τ is the flow shear stress,Pa;Tcis the sediment transport capacity,kg m-1s-1;cis the sediment concentration of the water flow,kg m-3;andqis the unit-width flow rate,m2s-1.
In clear water,the sediment concentration is zero.Rill detachment capacity at the beginning point of the rill can be computed with Eq.(10),letting c=0,and rewritten as:

whereDcis the detachment capacity,kg m-2s-1.
TheDcvalues at the different slope gradients and flow rates computed with Eqs.(3),(7)and(8)were substituted into Eq.(11)to estimateKrand τcthrough the regression method.
4.Results and discussion
4.1.Detachment rate related to the rill length and sediment concentration
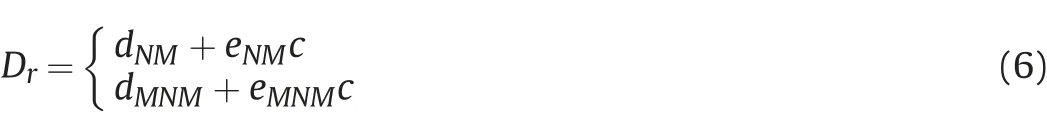
The detachment rate was computed with Eqs.(2),(4)and(5)via the AM,NM and MNM,respectively.The relationships of the detachment rate with rill length and sediment concentration were obtained by Eqs.(3)and(6).The results are shown in Fig.2.
Fig.2.Detachment rate functions of rill length and sediment concentration(estimated by the analytical,numerical and modified numerical methods)of saturated and unsaturated soils(under the slope of 10° and the flow rate of 2 L min-1).
In Fig.2,the rill detachment rates as a function of rill length or sediment concentration estimated by analytical,numerical and modified numerical methods for saturated soil slopes follow the same trends as those for unsaturated soil slopes.This indicates that the rill detachment rate decreased exponentially with increasing rill length and linearly increasing with sediment concentration,which is consistent with the results of the study by Wu et al.(2018).The sediment concentration in clear water was zero,and the detachment rate was the highest(Han et al.,2020).In Table 1,the detachment capacities computed with the NM are much higher than those computed with the AM,while those values obtained with the MNM are similar to those obtained with the AM,for either saturated or unsaturated soil.Then,the rill detachment capacities of saturated and unsaturated soil slopes obtained by the three methods were compared.The detachment capacity calculated by the analytical method is taken as the horizontal coordinate,and those data calculated by the numerical method and the modified numerical method are taken as the vertical coordinates.The three data sets were fitted and compared as shown in Fig.3.Fig.3 indicates that the detachment capacities computed by the MNM are almost identical to those by the AM,while the detachment capacities calculated by the NM are 31%larger than those obtained by AM or the MNM.The NM assigns the detachment rate to the end of a rill segment,resulting in systematic calculation errors.This can result in overestimations of erodibilities.Since the increasing rate in the sediment delivery rate in a rill section approximates the increasing rate at the midpoint of the rill,assigning the detachment rate obtained via numerical calculation to the midpoint of the rill section produces relatively small errors.These results verify that the AM and MNM are promising approaches to estimate rill detachment capacity.
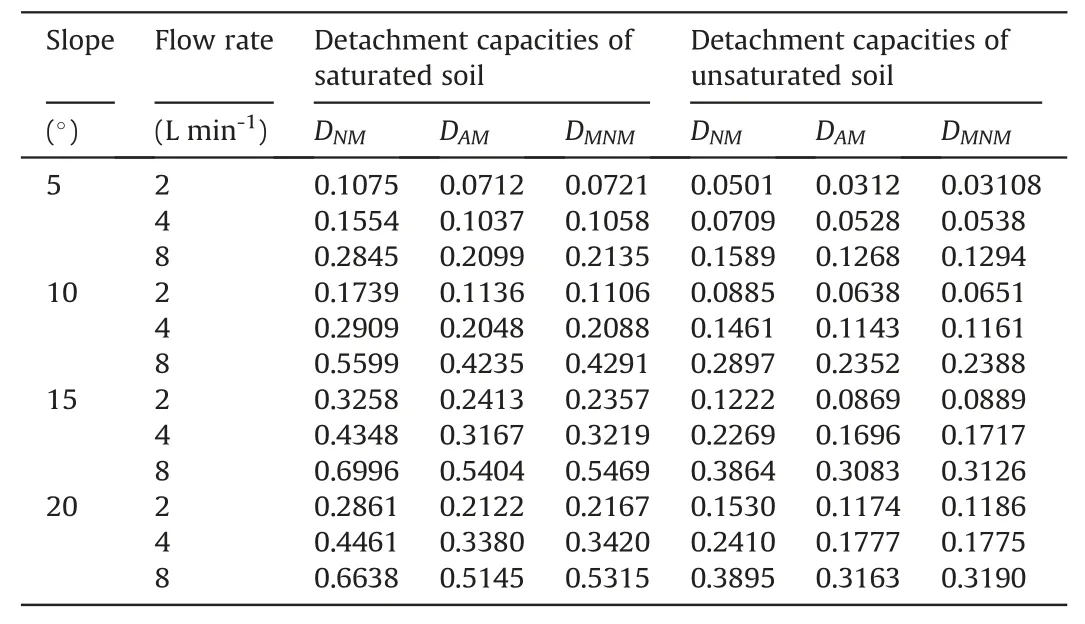
Table 1Detachment capacities of saturated and unsaturated soils estimated with different methods.
4.2.Erodibility and critical shear stress under different slope gradients
The flow shear stress was estimated with Eq.(9),and the rill detachment capacity was computed with Eqs.(3),(7)and(8)via the AM,NM and MNM,respectively.The relationship between the flow shear stress and rill detachment capacity at the different gradients is estimated with Eq.(11).The results are shown in Fig.4.
The relationships between rill detachment capacity and shear stress,for the AM,NM and MNM under different slope gradients of 5°,10°,15°,and 20°are shown in Fig.4.The data points are fitted with linear functions.The slopes of the regression lines represent the erodibility parameter.The intercepts of the lines with the x-axis are defined the critical shear stresses.Fig.4 shows that the slopes of the linear lines are approximately the same for different slope gradients via the NM,MNM and AM,and the intercepts of the lines vary slightly for each soil,either saturated or unsaturated soil,with increasing slope gradient under the NM,MNM and AM.This indicates that the soil erodibility does not notably change with the slope gradient,while the critical shear stress varies slightly for either saturated or unsaturated soil,at the different slope gradients ranging from 5°to 20°.The erodibility and critical shear stress values of the saturated and unsaturated soils under the three methods are listed in Table 2.

Fig.3.Comparison of the detachment capacity determined by analytical,numerical and modified numerical methods(The horizontal coordinate represents the detachment capacity calculated by the analytical method;the vertical coordinates denotes those data calculated by the numerical method and the modified numerical method).
Table 2 indicates that the soil erodibility values for each soil remain almost the same at the different slope gradients.The erodibility parameter is a physical property of soil(Lei et al.,2008).Hence,the estimated erodibility parameter should be a constant value for a given soil under different hydrodynamic conditions according to the theoretical analysis performed by Liu et al.(2010)and Wang et al.(2012).The soil erodibility values calculated from the experimental data indicate that the purple soil is vulnerable to erosion and has a high susceptibility to erosive agents.The soil erodibility values are much higher than those presented by Zhang et al.(2002).They used experiment soil with higher clay content(24.3%)and small soil samples to produce lower soil erodibility values.The determination coefficients(R2),under different slope gradients,were quite high which verifies the effectiveness of these methods.
Based on Table 2,the critical shear stress values of the saturated and unsaturated soil exhibit slightly differences at 5°,10°,15°,and 20°.Many scientists have extensively discussed the influencing factors of the critical shear stress.Several soil properties and hydraulic parameters,such as the soil particle composition,soil pore content,slope gradient and flow rate(Huang et al.,1996;Zhang et al.,2004),significantly influence the critical shear stress.Moreover,Nouwakpo et al.(2010)reported through laboratory experiments that soil pore-water pressure could directly affect the critical shear stress values.These studies indicated that the critical shear stress was not a fixed value.The results of the critical shear stress of the saturated and unsaturated soils vary slightly among the above methods,which verify the reliability of the results and the feasibility of these methods.
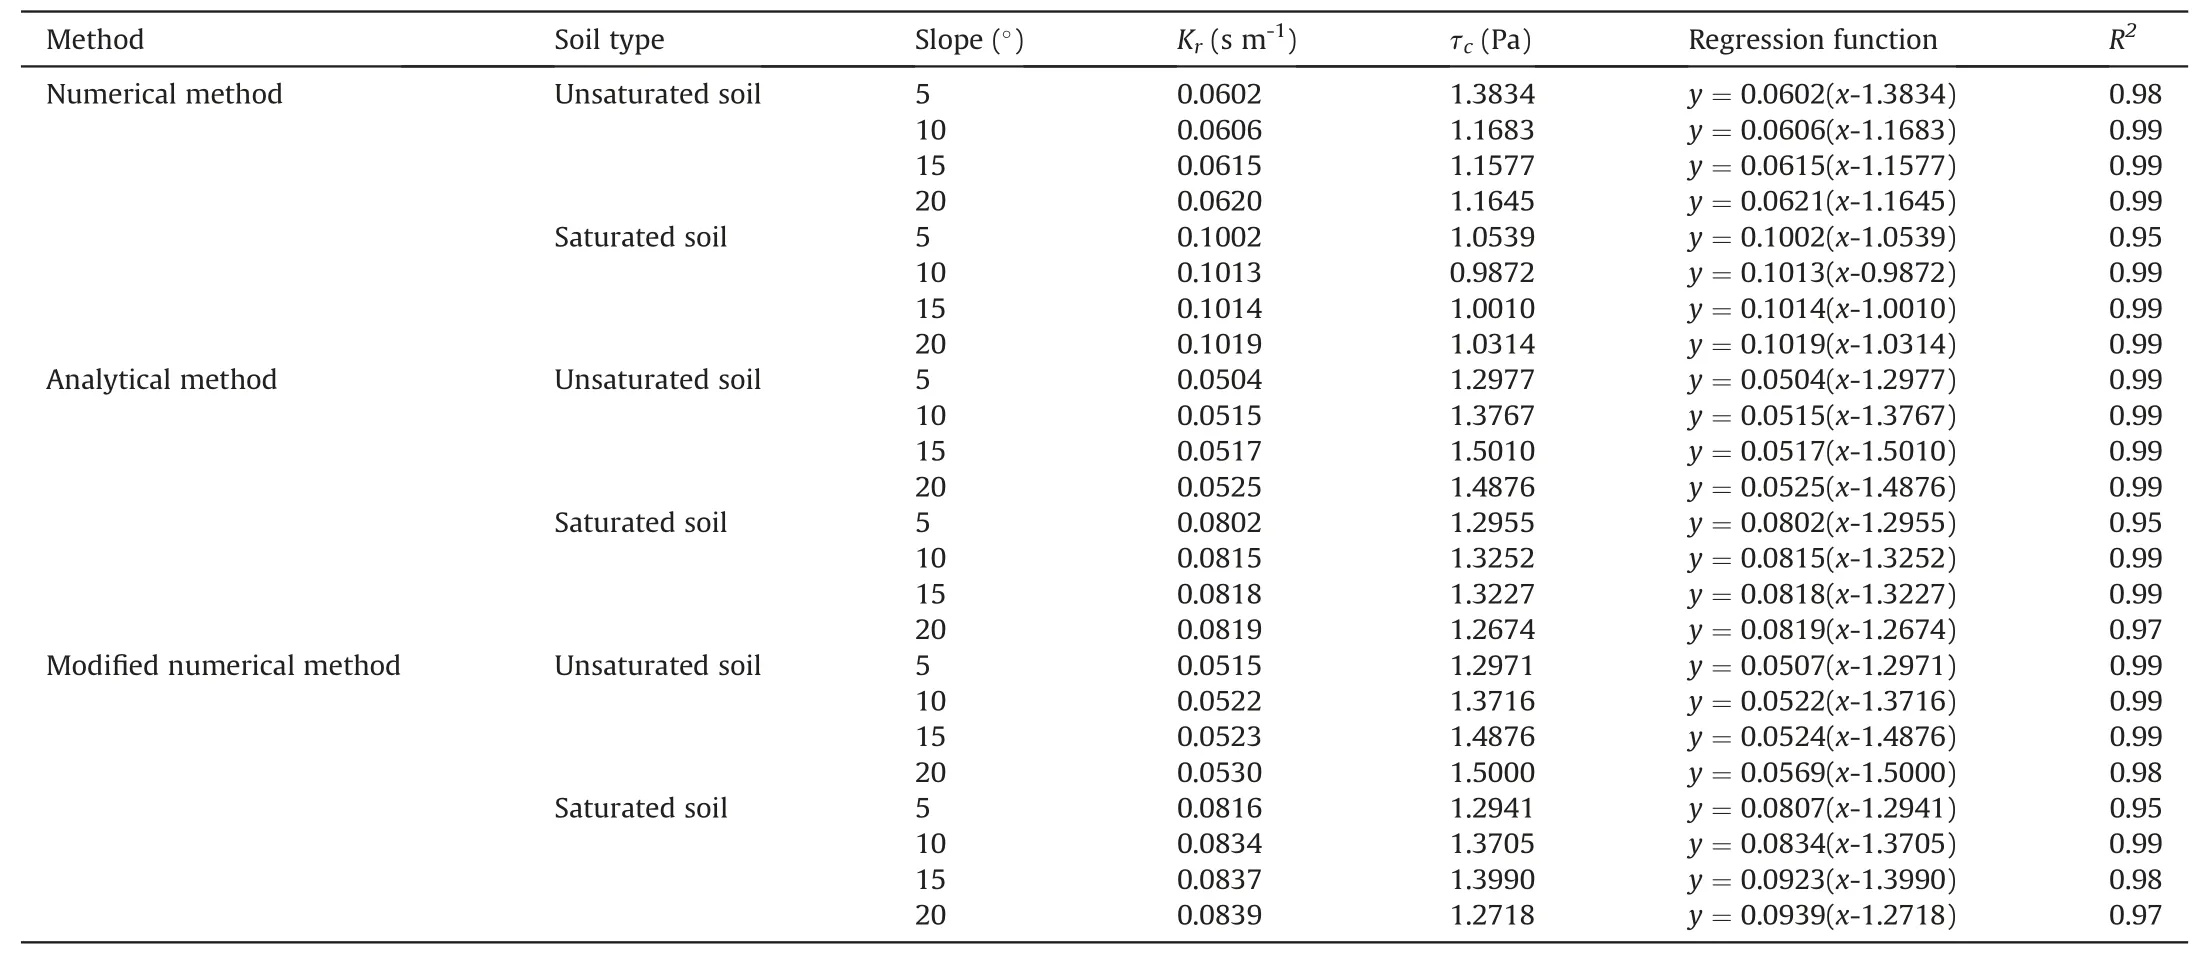
Table 2Soil erodibility and critical shear stress of the saturated and unsaturated soils estimated with different methods.

Table 3Average soil erodibility and critical shear stress of the saturated and unsaturated soils.
4.3.Soil erodibility and critical shear stress of saturated and unsaturated soils

Fig.4.Relationship between rill detachment capacity and shear stress(estimated by the analytical,numerical and modified numerical methods)at different slope gradients(5°,10°,15°,and 20°).
According to Fig.4,the intercepts of the linear relationships of the saturated soil are clearly lower than those of the unsaturated soil,while the slopes of the lines for the saturated soil are steeper than those for the unsaturated soil at the different slope gradients.This finding confirms that the critical shear stress values of the saturated soil are lower than those of the unsaturated soil,while the erodibility parameter of the saturated soils is higher than that of the unsaturated soils.The average critical shear stress and erodibility values of the saturated and unsaturated soils under the three methods are listed in Table 3.Table 3 clearly indicates that the average erodibility of the saturated soil is almost 1.7 times that of the unsaturated soil,while the critical shear stress of the saturated soil is lower than that of the unsaturated soil.These results confirm that the saturated soil exhibits higher susceptibility than unsaturated soil.Specifically,saturated soil is more vulnerable to erosion than unsaturated soil.
The average erodibility parameter values for the saturated and unsaturated soils are significantly different in this study,and the reasons vary.Since the used soil contains a high content of sand particles and exhibits a loose structure,the cementation between the soil particles is readily weakened,and they are easily dispersed by water after saturation.Consequently,saturated soil is more susceptible to erosion than unsaturated soil.In addition,saturated soil particles are easily removed by runoff erosion under the action of buoyancy(Osipov,2014),which may be another important reason why the average erodibility of saturated soil is higher than that of unsaturated soil.Nouwakpo et al.(2010)found that the soil erodibility obviously changes with the different surface water status,which is consistent with our results.
The critical shear stress of saturated soil is notably lower than that of unsaturated soil.Previous studies have reported similar conclusions regarding the discrepancy in the critical shear stress between these two soils.Nouwakpo et al.(2010)and Su et al.(2019)reported that the critical shear stress obviously decreases under drainage,saturation and seepage hydrological conditions.This phenomenon occurs because the critical shear stress is mainly related to the buoyancy and pore-water pressure.After the soil is fully saturated,the interstices among the soil particles become more affected by the buoyancy and pore-water pressure,and the friction between the particles greatly decreases,which leads to a decrease in the critical shear stress(Osipov,2014).
The average erodibility and critical shear stress values of the unsaturated soil are much lower than the results of Lei et al.(2008).It is believed that the soil type and soil texture provide a rational explanation for this difference.Xing,Chen,et al.(2018)measured an erodibility value of unsaturated purple soil of 0.204 s m-1,which was much higher than the value determined in this study.Indeed,the difference in clay particles and organic matter contents may cause this discrepancy(Wang et al.,2013).However,it should be noted that they estimated the average erodibility value using six rills that were 12 m long,which is a reasonable explanation for the higher erodibility value.
A comparison of the soil erodibility and critical shear stress values computed with the AM,NM and MNM between the saturated and unsaturated soils was performed,and the results are summarized in Table 3.Table 3 clearly indicates that the NM yields the highest erodibility parameter values.The AM produced slightly lower soil erodibility parameter values.The erodibility parameter values estimated with the MNM are lower than those estimated with the other methods,but the difference is not significant.In fact,regarding the erodibility parameter of the saturated soil,the deviation between the numerical values and analytical results is 15.71%,whereas the average deviation between the analytical and modified numerical values is 1.31%,for the unsaturated soil,at 19.56% and 1.78%,respectively.
The average critical shear stress values under the two soil conditions estimated with each of the three methods did not vary with the slope gradient.The computed results prove that the AM and MNM are promising approaches for the estimation of the soil erodibility and critical shear stress.The results demonstrate that the application of the NM to measure the soil erodibility and critical shear stress is not desirable.Consequently,these findings confirm that both the AM and MNM are equally applicable to determine the soil erodibility and critical shear stress.
5.Conclusions
The detachment capacities of saturated soil slopes studied at three flow discharge rates(2,4,and 8 L min-1)and four slope gradients(5°,10°,15°,and 20°)with NM,MNM and AM were used to comparatively compute the soil erodibility and critical shear stress for rill erosion of saturated purple slopes.The results revealed that the erodibility and critical shear stress of the saturated and unsaturated soils computed with the MNM are similar to the values obtained with the AM.The MNM is a rational method.The erodibility parameters of each soil exhibit no notable change,while the critical shear stress only slightly differs between each soil at 5°,10°,15°,and 20°.The erodibility parameter values of the saturated soils are almost 1.7 times those of the unsaturated soils,while the critical soil shear stress of the saturated soils is lower than that of the unsaturated soils,indicating that the specific nearsurface hydrological conditions of the saturated soils may highly affect the erodibility parameter and critical shear stress values,resulting in increased soil erosion.The results of this study are useful to explain the rill erosion process of saturated purple soil slopes.Additionally,further studies are necessary to quantify the erodibility parameter and critical shear stress of different soil types,which may provide a basis for the improvement of soil erosion prediction models.
Declaration of competing interest
No conflict of interest exists in the submission of this manuscript,and the manuscript has been approved by all authors for publication.
Acknowledgments
This work was financially supported by the National Natural Science Foundation of China(Project No.41571265)and the Key Research and Development Project of Social Livelihood in Chongqing(cstc2018jscx-mszdX0061).
杂志排行
International Soil and Water Conservation Research的其它文章
- An updated isoerodent map of the conterminous United States
- Monitoring gully erosion in the European Union:A novel approach based on the Land Use/Cover Area frame survey(LUCAS)
- Unpaved road erosion after heavy storms in mountain areas of northern China
- Erosion risk assessment:A contribution for conservation priority area identification in the sub-basin of Lake Tana,north-western Ethiopia
- Mapping soil erodibility in southeast China at 250 m resolution:Using environmental variables and random forest regression with limited samples
- Tillage and crop management impacts on soil loss and crop yields in northwestern Ethiopia