Monitoring gully erosion in the European Union:A novel approach based on the Land Use/Cover Area frame survey(LUCAS)
2022-09-26PsquleBorrelliJenPoesenMtthisVnmerckeCristinoBllbioJvierHervMichelMerkerSimoneScrpPnosPngos
Psqule Borrelli ,Jen Poesen ,Mtthis Vnmercke ,Cristino Bllbio ,Jvier Herv′s ,Michel Merker ,Simone Scrp ,Pnos Pngos
a Department of Earth and Environmental Sciences,University of Pavia,Via Ferrata,1,27100,Pavia,Italy
b Department of Biological Environment,Kangwon National University,Chuncheon,24341,Republic of Korea
c Department of Earth and Environmental Sciences,KU Leuven,Belgium
d Faculty of Earth Sciences and Spatial Management,Maria-Curie Sklodowska University,Lublin,Poland
e D′epartement de G′eographie,Universit′e de Li`ege,Liege,Belgium
f European Commission,Joint Research Centre(JRC),Ispra,Italy
Keywords:Soil erosion Soil Concentrated flow erosion Google earth Earth observations
A B S T R A C T The European Commission's Thematic Strategy for Soil Protection(COM(2012)46)identified soil erosion as an important threat to European Union's(EU)soil resources.Gully erosion is an important but hitherto poorly understood component of this threat.Here we present the results of an unprecedented attempt to monitor the occurrence of gully erosion across the EU and UK.We integrate a soil erosion module into the 2018 LUCAS Topsoil Survey,which was conducted to monitor the soil health status across the EU and to support actions to prevent soil degradation.We discuss and explore opportunities to further improve this method.The 2018 LUCAS Topsoil Survey consisted of soil sampling(0—20 cm depth)and erosion observations conducted in ca.10%(n=24,759)of the 238,077 Land Use/Cover Area frame Survey(LUCAS)2018 in-field survey sites.Gully erosion channels were detected for ca.1%(211 sites)of the visited LUCAS Topsoil sites.Commission(false positives,2.5%)and omission errors(false negatives,5.6%)were found to be low and at a level that could not compromise the representativeness of the gully erosion survey.Overall,the findings indicate that the tested 2018 LUCAS Topsoil in-field gully erosion monitoring system is effective for detecting the incidence of gully erosion.The morphogenesis of the mapped gullies suggests that the approach is an effective tool to map permanent gullies,whereas it appears less effective to detect short-lived forms like ephemeral gullies.Spatial patterns emerging from the LUCAS Topsoil field observations provide new insights on typical gully formation sites across the EU and UK.This can help to design further targeted research activities.An extension of this approach to all LUCAS sites of 2022 would significantly enhance our understanding of the geographical distribution of gully erosion processes across the EU.Repeated every three years,LUCAS soil erosion surveys would contribute to assess the state of gully erosion in the EU over time.It will also enable monitoring and eventually predicting the dynamics of gully erosion.Data collected were part of the publicly available Gully Erosion LUCAS visual assessment(GE-LUCAS v1.0)inventory.
1.Introduction
Soil erosion by water is a primary cause of soil and land degradation worldwide(IPCC,2019),with substantial financial implications(Panagos et al.,2018;Sartori et al.,2019).Field measurements,monitoring and modelling applications suggest that erosion occurs under a wide range of environmental conditions,encompassing all continents except Antarctica(Borrelli et al.,2021;García-Ruiz et al.,2015).Among rainfall-runoff-induced soil erosion processes occurring on hillslopes—splash erosion,sheet(or interrill)erosion,rill erosion,and gully erosion(Bryan,2000)our understanding-especially on spatial patterns and rates of gully erosion-remains little understood(e.g.,de Vente et al.,2013;Poesen et al.,2003).This is remarkable as gullies are responsible for substantial soil loss,sediment production,and hillslope evolution(Castillo&G′omez,2016;Valentin et al.,2005).Gully erosion can be severe,with gullies locally accounting for up to 80%of the total soil displacement due to water erosion(Poesen,2018).
Gullies typically develop on hillslopes,footslopes and valley bottoms through soil incision mainly by concentrated but intermittent overland flow and subsurface flows that sharply erode into the soil(Valentin et al.,2005).Accordingly,they mainly develop during intense rainfall events.As polymorphic and highly dynamic landforms,gullies are often associated with a wide range of on-site and off-site impacts(Vanmaercke et al.,2020;Vanmaercke,Panagos,Vanwalleghem,& Hayas,2021;Bartley et al.,2020;Poesen et al.,2003).Given their wide variety,gullies are generally distinguished according to different criteria such as i)their position in the landscape(i.e.,in valley-floors,valley-sides,valley-heads or earth banks)(Poesen et al.,2002,2003),ii)their length(small<5 m,medium 5—10 m,and large>10 m)or depth(small<1 m,medium 1—5 m,and large>5 m)(Pathak,Wani,& Sudi,2006),iii)soil material in which they develop(Imeson & Kwaad,1980),iv)their continuity or discontinuity with regard to the drainage network(Poesen et al.,2002)as well as v)their permanent or ephemeral nature(Capra & La Spada,2015;Poesen et al.,2003).Permanent gullies are deep channels,with depths typically exceeding 30 cm,but in some cases up to 20—30 m,and they cannot be smoothed by tillage(Casalíet al.,2015;Igbokwe et al.,2008;Li et al.,2015).Ephemeral gullies are shallow erosional channels which get generally masked(but not totally erased)by routine tillage operations following the rainfall event that triggered them(Douglas-Mankin et al.,2020;Laflen et al.,1985;Woodward,1999).Moreover,the existence of bank gullies is worth mentioning.They develop due to a height drop(hydraulic gradient)caused by,for example,a terrace or a river bank(Vandekerckhove et al.,2000).
The research conducted on gullies over the past few decades(Bennett & Wells,2019)generated a solid knowledge base for this geomorphic process(Torri & Poesen,2014;Vanmaercke et al.,2020;Vanmaercke,Panagos,Vanwalleghem,& Hayas,2021).Nonetheless,our ability to assess and predict spatial occurrence of gullies,their temporal evolution,and their contribution to catchment sediment yields remains limited(Bartley et al.,2020;Herzig et al.,2011).The prediction of gully occurrence remains a complex matter(Herzig et al.,2011;Poesen et al.,2011;Torri&Poesen,2014),especially at regional or larger scales(Conoscenti et al.,2018;de Vente & Poesen,2005;Garosi et al.,2019;M¨arker et al.,2011).Like for most soil erosion processes,modelling capacity and performance is strongly limited by data availability(Alewell et al.,2019;de Vente et al.,2013;Vanmaercke,Panagos,Vanwalleghem,& Hayas,2021).However,for gully erosion modelling the intrinsic complexity of gully formation processes(e.g.,hydraulic erosion,mass movement,piping,fluting;Poesen et al.,2011)and spatiotemporal development plays a more prominent role than for other erosion processes.Discussing the possibility to develop processbased models for gully erosion prediction in a review study by Torri and Poesen(2014)concluded that more reliable and standardized field data should be collected in different environments to better capture the role of different climatic and land-use conditions.Gully erosion susceptibility assessments are currently limited to local and regional scale applications(Arabameri et al.,2019;Conoscenti et al.,2014;Meliho et al.,2018;Vanmaercke,Panagos,Vanwalleghem,& Hayas,2021;Zakerinejad & Marker,2014)due to the lack of large-scale gully inventory data for calibration/validation purposes.Accordingly,we currently lack harmonized national to continental scale gully erosion monitoring/assessments to better understand the geographical distribution of gully erosion processes and to evaluate the resulting threats to soil and environment(Panagos et al.,2016a).Such threats could,albeit still in crude and approximate forms,be assessed at pan-European and global level for erosion processes such as sheet and rill erosion(Borrelli et al.,2017a;Cerdan et al.,2010;Kirkby et al.,2004;Naipal et al.,2018;Panagos et al.,2015;Van Oost et al.,2007),wind erosion risk(Borrelli et al.,2017b;Chappell & Webb,2016),tillage erosion(Quinton et al.,2010;Van Oost et al.,2009)and soil losses during root and tuber crop harvesting(Panagos et al.,2019).
Despite current difficulties to numerically describe and predict their spatial occurrence and development rates(Torri & Poesen,2014;Zakerinejad & Marker,2014),gully erosion channels,both permanent or ephemeral,tend to be sizable and highly recognizable landforms.Unlike processes such as sheet and rill erosion and wind erosion,gullies cannot easily be obliterated(filled in or covered)by anthropological activities(e.g.,soil tillage,crop harvesting)or natural processes(e.g.,intense rainfall,droughts,vegetation overgrowth).As such,they can often be relatively easily identified and mapped in the field(Boardman & Evans,2020)as well as by using remote sensing imagery(Frankl et al.,2019;Liu et al.,2018).20 years ago,it was recommended to use a combination of aerial photos and field surveys to map ephemeral gullies(Nachtergaele & Poesen,1999).Nowadays Google Earth™is frequently used to identify permanent or long-lasting geomorphological features such as landslides,river networks and coastlines(Rabby&Li,2019;Vos et al.,2019).Also gully erosion channels are increasingly studied in this way(Boardman,2016).Zhao et al.(2016),for example,used Google Earth™imagery to assess the presence and density of gullies in China Loess Plateau.In Greece,Karydas and Panagos(2020)conducted a random gully erosion sampling procedure and used Google Earth™to assess various channels(gully length,depth,drainage network).Vanmaercke,Panagos,Vanwalleghem,& Hayas,2021 and Zakerinejad and Marker(2014)used Google Earth™to observe and predict gully densities in the Horn of Africa and in Southwestern Iran.
Although significant progress has been made during the last two decades in understanding and mapping gully erosion processes(e.g.Ionita et al.,2015),we are still faced with a lack of inventories reporting gully occurrence across the European Union(EU).This is true for inventories based on both remote sensing as well as on field surveys.The EU has therefore recently undertaken the first pan-European field-based survey to map gully occurrence across its territory.In the context of the 2018 Land Use/Cover Area frame statistical Survey(LUCAS)(Eurostat,2020),field operations were conducted to collect information on 106 variables.The soil erosion module of these variables included the mapping of gully channels.Here,we present the results of the testing phase in which the mapping activities focused on LUCAS Topsoil Survey sites(Orgiazzi et al.,2018),ca.10%(n=24,759)of the 238,077 2018 LUCAS in-field survey sites.The data collected was included in the publicly available Gully Erosion LUCAS visual assessment(GE-LUCAS v1.0)inventory.
2.Materials and methods
2.1.LUCAS-Land Use/Cover Area frame survey
LUCAS is a statistical survey managed by Eurostat and performed every three years in the EU.It is conducted to obtain harmonized data on land cover and land use,as well as other landscape channels(e.g.grasslands,grass margins,trees,stone walls)(Gallego & Bamps,2008).Since 2006,five LUCAS surveys have been conducted(2006,2009,2012,2015,2018)(d’Andrimont et al.,2020)in which information for 106 variables have beencollected(for a total of 1,351,293 observations at 651,780 unique sites and 5.4 million terrestrial photos taken).The most recent 2018 LUCAS survey is based on 337,854 sites/observations,of which 238,077 were in-field and 99,777 were photo-interpreted in office.
A soil component was added to LUCAS in 2009,targeting around 10% of the overall LUCAS sites(Orgiazzi et al.,2018).Known as LUCAS Topsoil Survey(0—20 cm depth)(Table 1),it is one of the few worldwide harmonized continental-scale soil monitoring schemes(Arrouays et al.,2017).Ever since the first survey in 2009,two more surveys were conducted(in 2015 and 2018),with the next one planned for 2022.As soon as LUCAS Topsoil survey data are collected and processed(i.e.laboratory analyses,quality check,georeferencing),they are compiled in a database that is made publicly available at the European Soil Data Centre(ESDAC)(Panagos et al.,2012),together with interpolated gridded data of physical(Ballabio et al.,2016)and chemical soil properties(Ballabio et al.,2019).For the 2015 survey,topsoil samples were also collected from non-EU countries such as the Western Balkan ones and Switzerland.In 2018 additional modules were included focusing on aspects such as soil biodiversity,bulk density and soil erosion channels.

Table 1Variables included in the LUCAS Topsoil survey 2018.
2.2.Including gully channels in the LUCAS topsoil survey
For each LUCAS Topsoil site,the surveyors observed the specific LUCAS land cover.In addition,they walked along a 250m straight line transect(to East)and recorded each land cover transition observed according to LUCAS protocols(Eurostat,2020)as well as the occurrence of linear landscape features such as stone walls,hedges,roads,railways,irrigation channels,and grass margins intersecting the transect(LUCAS,2015).
In the 2018 LUCAS Topsoil survey,also the visual assessment of soil erosion channels was implemented.Accordingly,for each of the 24,759 LUCAS Topsoil sites in 2018,the surveyors recorded the occurrence of gullies,defined as linear erosion channels with a depth of more than 30 cm(Øygarden,2003).Surveyors were informed that gullies typically are hillslope erosional features rather than incipient stream channels.Gullies develop on soilmantled hillslopes.Channels with steep sides and absence of stones and gravel material at the bottom are assumed.The mapping operations included the recording of the number of gullies(>5,5—10,and>10 gullies),their distance(in meters)and direction(N,E,S,W)from the observed LUCAS Topsoil point.The surveyors also documented their observations with photos of the sampled point location,taken in different directions,depicting the surrounding landscape.
The gully erosion channels recorded by the surveyors were included in the Gully Erosion LUCAS visual assessment(GE-LUCAS v1.0)inventory.This inventory also contains relevant details on the sampled sites,including the coordinates,land use/cover,type of vegetation,and soil properties.
2.3.Mapping performance evaluation
The gully erosion channels recorded during the in-field observations were subject to three phases of expert-based remote verification to assess the error of commission(possible false positives).Sites that could not be validated were flagged as possible false positives in the GE-LUCAS inventory.The three validation phases were:
i.Within the first phase of post-field activities,sites reporting gully erosion channels were cross-checked and validated through on-screen visual interpretation of the most recent Google Earth(GE)image.This procedure was fairly simple to conduct as permanent gully erosion channels often tend to be clearly evident on most recent high-resolution GE images(Fig.1a—c).
ii.In the following phase,all LUCAS Topsoil sites that reported the presence of gully erosion channels but which had not been validated in the previous step were further checked using historical high-resolution GE images.GE images have been available since the 2000s for many regions in Europe.Where available,also GE's Street View imagery was used to verify the presence of gullies(Fig.1d).
iii.Lastly,the remaining gully erosion sites,which were not verified with GE images were cross-checked with LUCAS terrestrial pictures,taken in all four cardinal directions and the surveyed soil site.
The error of omission(possible false negatives)of the field observations was assessed by cross-checking 250 randomly selected LUCAS Topsoil sites for which no gully erosion channels were reported by the surveyors.The 250 locations(point features format)were defined using the Create Random Points tool available in ArcGIS 10.6.In the next step,a square observation area(300×300m)was established around each site.The size was defined based on LUCAS straight line transects(250m)and gully distances(from LUCAS sites)generally reported by the surveyors.When at least one gully channel was recorded through the expertbased remote verification,the site was classified as a possible false negative.
2.4.Mapping gullies using Google Earth
The possibility to further expand GE-LUCAS inventory by integrating gully erosion channels observable through on-screen visual detection was further tested.A randomly selected(ArcGIS 10.6 Create Random Points tool)one third of the validated GE-LUCAS sites was investigated using all available airborne Google Earth images.This operation was conducted following a procedure similar to the one adopted by Vanmaercke,Panagos,Vanwalleghem,& Hayas,2021 in the Horn of Africa.Accordingly,an observation site of one square kilometre around each GE-LUCAS site was established and further subdivided into nine sub-sectors of ca.0.11 km2each to facilitate the mapping operations.Afterwards,visible gully heads were mapped to test the suitability of the approach.
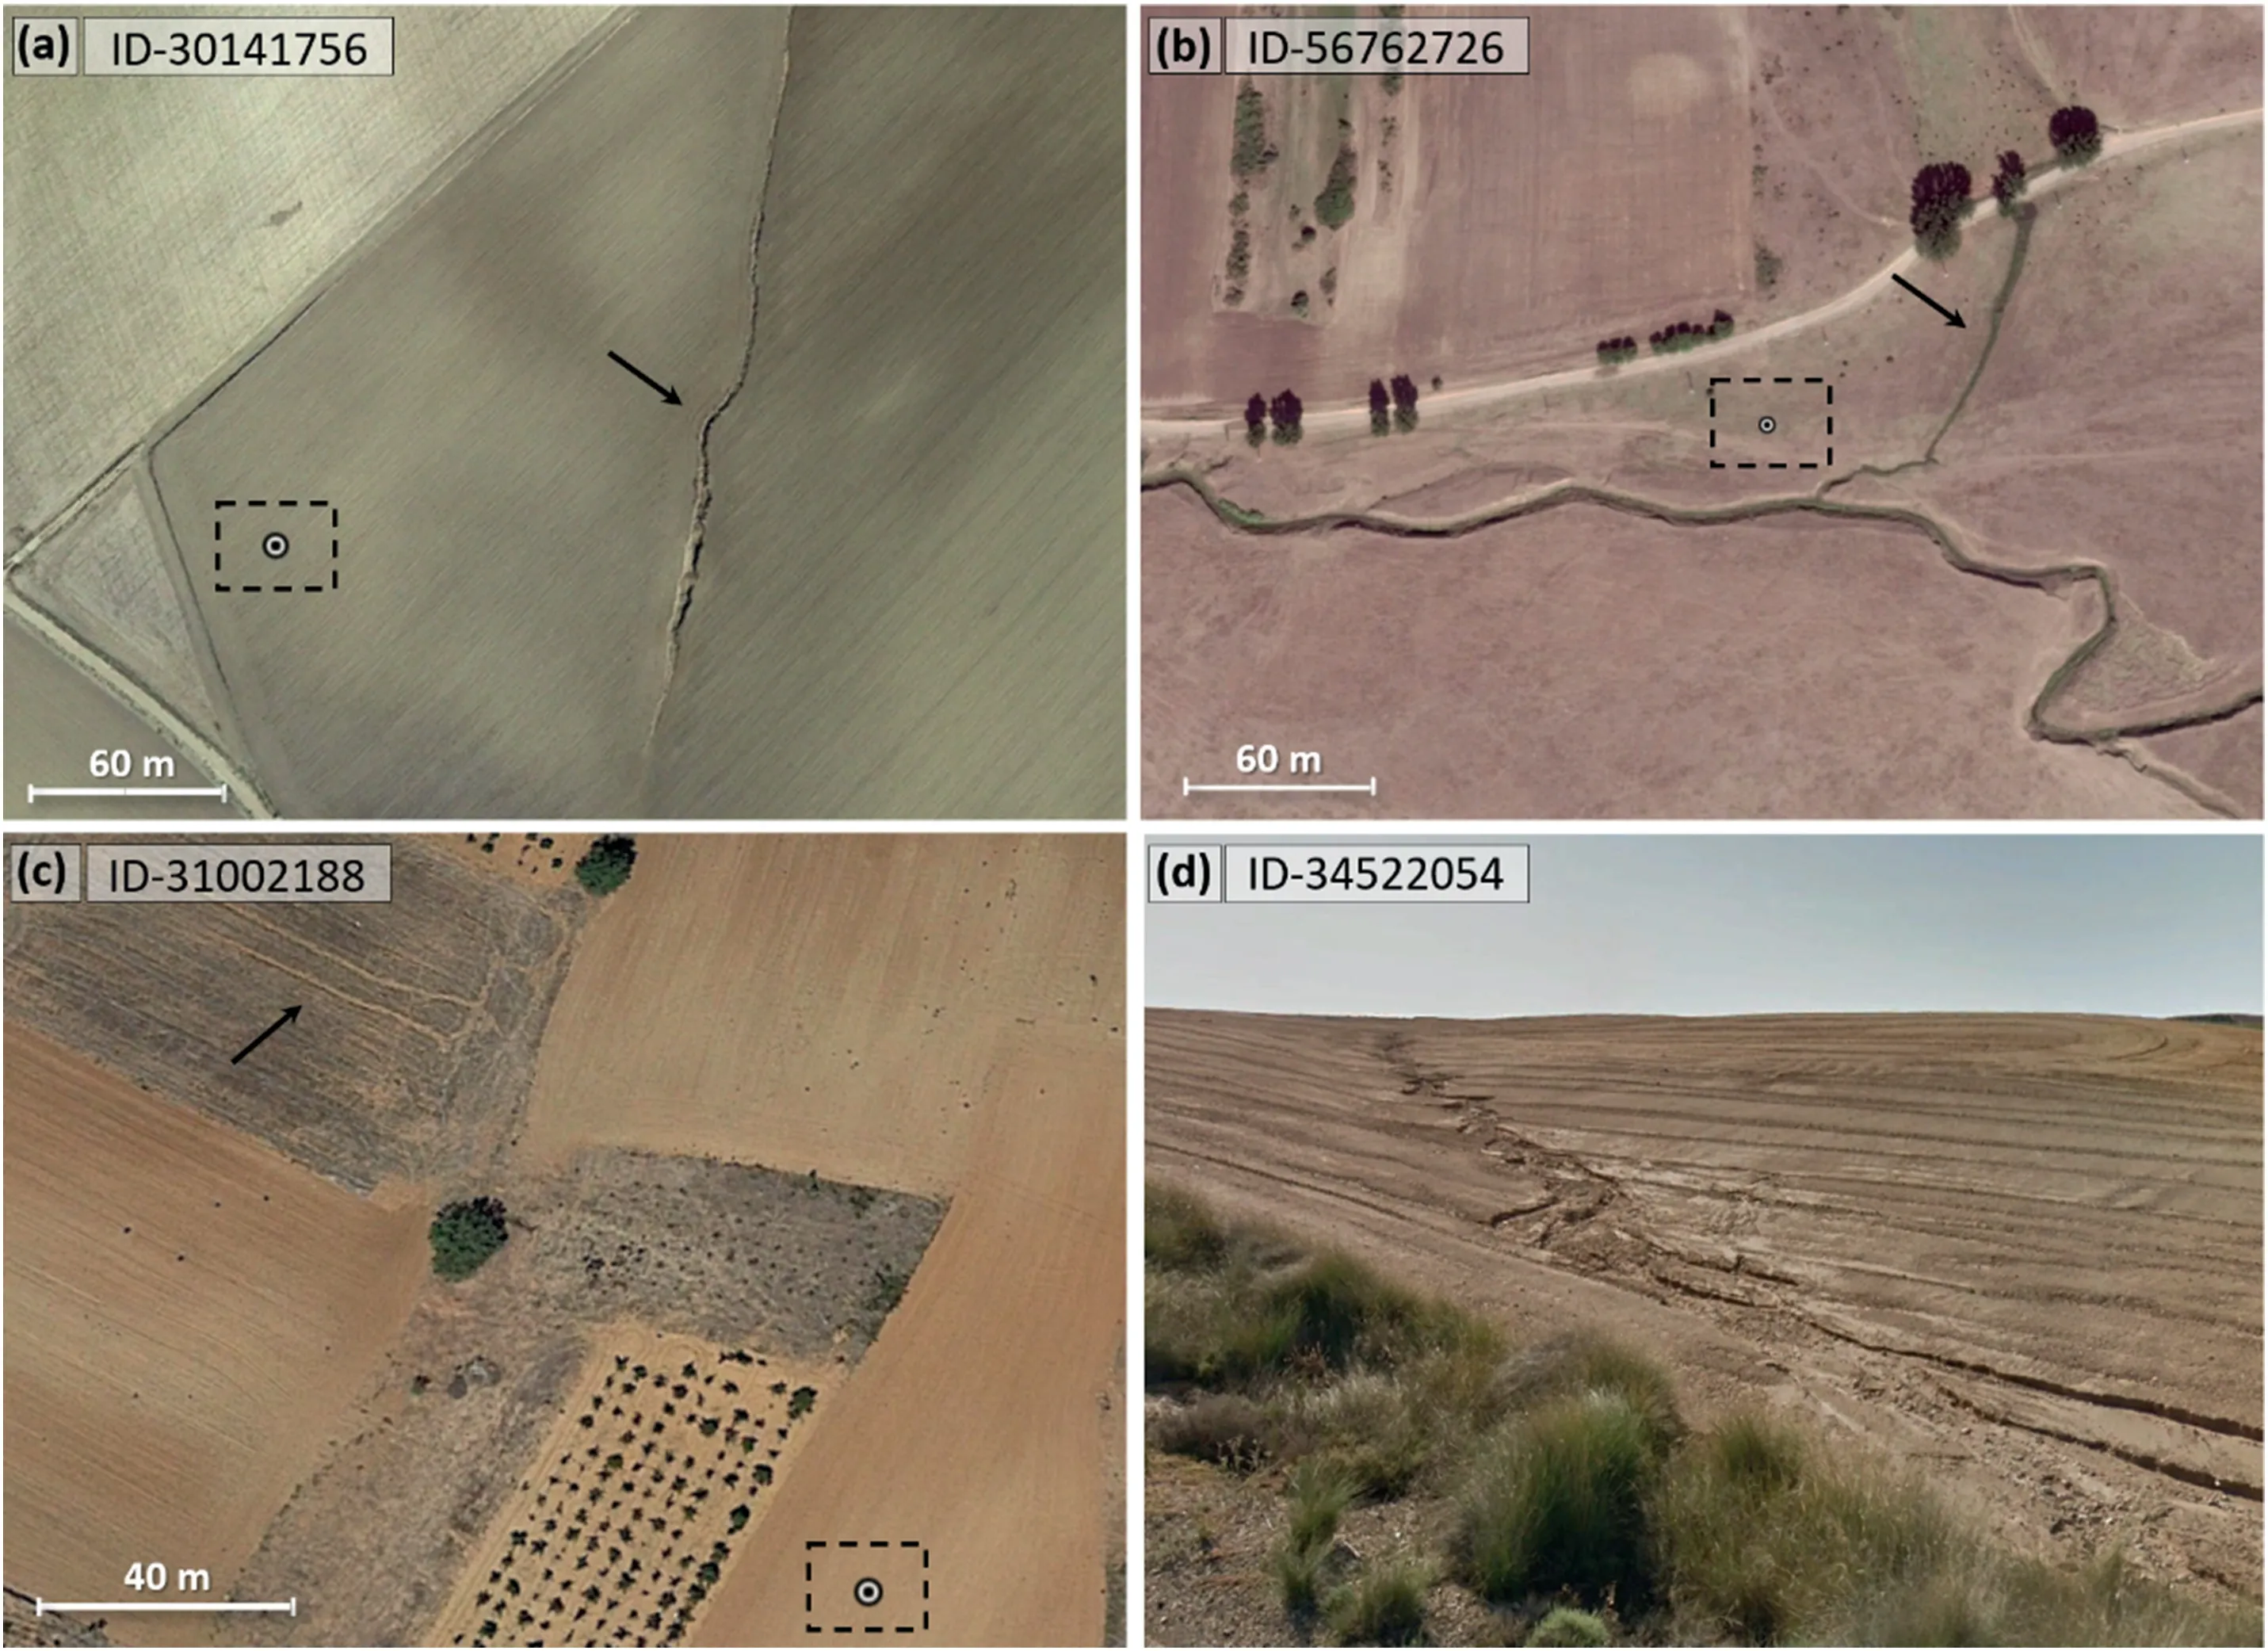
Fig.1.Examples of gully erosion channels validated by reviewing Google Earth Images.Panel A—Spain,Andalusia,37.73°N,-4.82°W,image date:October 2019.Panel B—Romania,B^arlad,46.18°N,27.72°E,image date:August 2012.Panel C—Spain,Castile and Le′on,41.71°N,-4.72°W,image date:September 2017.Panel D—Spain,Zaragoza,41.05°N,-0.32°W,image date:October 2018.The circle within the black dotted rectangle indicates the location of a LUCAS Topsoil site.
3.Results
3.1.Gully erosion LUCAS visual assessment(GE-LUCAS)inventory
Out of 24,759 visited LUCAS Topsoil sites,the surveyors recorded a total of 211 sites with gully erosion channels(equal to ca.1% of total)(Fig.2).The surveyors also registered the number of gullies observable from the visited LUCAS Topsoil sites(ranging in length 1—420m from the LUCAS sampling point,with a median distance of 50m)and classified them into three different categories based on the number of gullies present:i)<5 gullies,ii)5—10 gullies,and iii)>10 gullies.The majority of the sites have less than 5 gullies(159 sites)while 28 sites have 5—10 gullies and 19 sites have more than 10 gullies.
As can be inferred from Fig.2,the overall spatial patterns of the LUCAS Topsoil field observations suggest a possible coarse subdivision of EU's(plus UK)areas into three macro regions:i)the northernmost regions with very limited observations,ii)the central eastern region and large sectors of UK and Italy with intermediate occurrence of gully observations,and iii)the southwestern and southeastern regions,which are largely dominated by medium to high gully erosion observations.
Overall,the majority of observed gully erosion channels were found in Spain(n=127 sites,61%of total),especially in the Andalusian region(n=72 sites,35%of total).Gully observations in Spain represent about 5% of LUCAS Topsoil's total surveyed sites in this country.The remaining 39%of the 2018 LUCAS Topsoil gully observations were primarily situated in Mediterranean zones.In particular,33 gully observations were found in Greece,11 in Romania,10 in France,7 in Bulgaria and 6 in Italy,3 in Hungary and 3 in Slovakia.In Austria,Germany,Finland,Luxembourg,Cyprus and United Kingdom,one gully observation for each country was reported.
Table 2 illustrates the gully sites aggregated per biogeographical region(EEA,2020).About 81% of all sites belong to the Mediterranean biogeographical region(n=168).This suggests that spatial variations in gully occurrence are strongly influenced by general climatic,ecological and vegetation cover conditions.At the same time,gullies have a higher propensity to occur in some soil textural classes(USDA classification,(Ballabio et al.,2016):loam(n=131,63.6%of the total),clay-loam(n=49,23.8%of the total),silt-loam(n=11,5.3% of the total),and silty clay-loam(n=10,4.9% of the total),and to a lesser extent sandy loam(n=3,1.5%of the total)and sandy clay-loam(n=2,1% of the total))(Table 3).
With regard to land use/cover,the majority of gullies were found in croplands(ca.33%)followed by woodlands(ca.28%),grassland(ca.17%),and shrubland(ca.16%).Shrublands show the highest relative presence of gullies(3.4% of LUCAS samples visited in shrublands)followed by bare lands(1.3% of LUCAS samples visited in bare lands)(Table 4).A closer look to the land cover categories shows a very high occurrence of gullies in olive groves,equal to 7%of total LUCAS Topsoil observations in this class.In the EU,Andalusia is the region with both the highest occurrence of gully observations in the GE-LUCAS inventory,and the highest incidence of gullies in olive groves.According to the CORINE Land Cover 2018 statistics,30% of the European olive groves occur in Andalusia,which is described in literature as an area with high frequency of gullies(Taguas et al.,2012;Vanwalleghem et al.,2010).
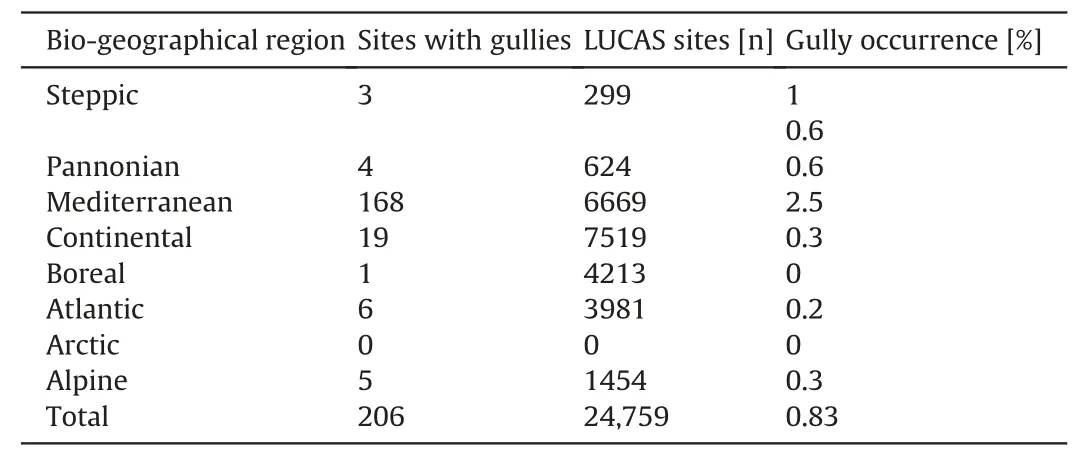
Table 2Number of sites with gullies aggregated per biogeographical region(EEA,2020).
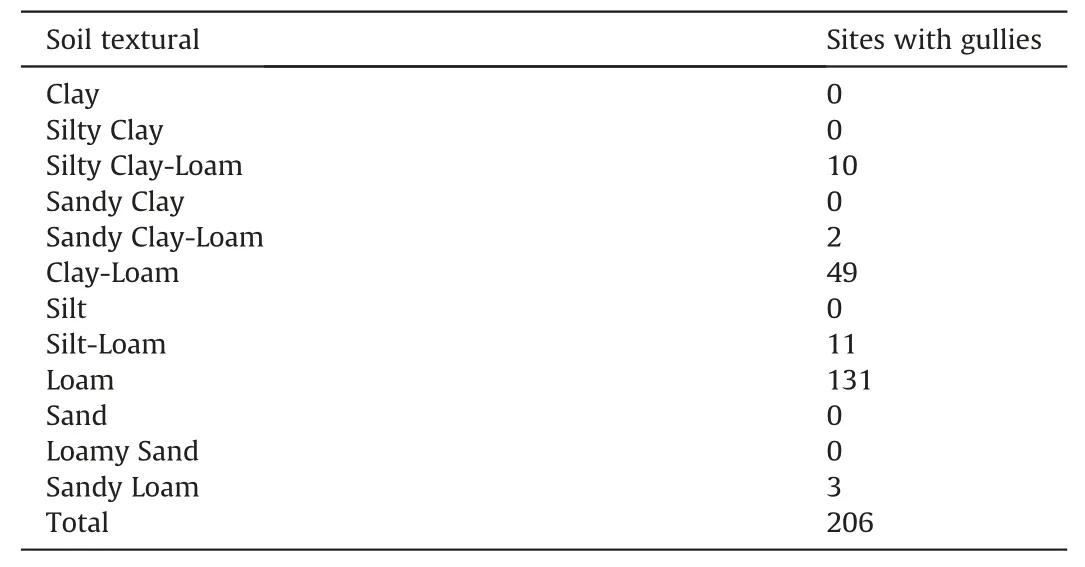
Table 3Number of sites with gullies aggregated per soil textural class(USDA classification(Ballabio et al.,2016),).
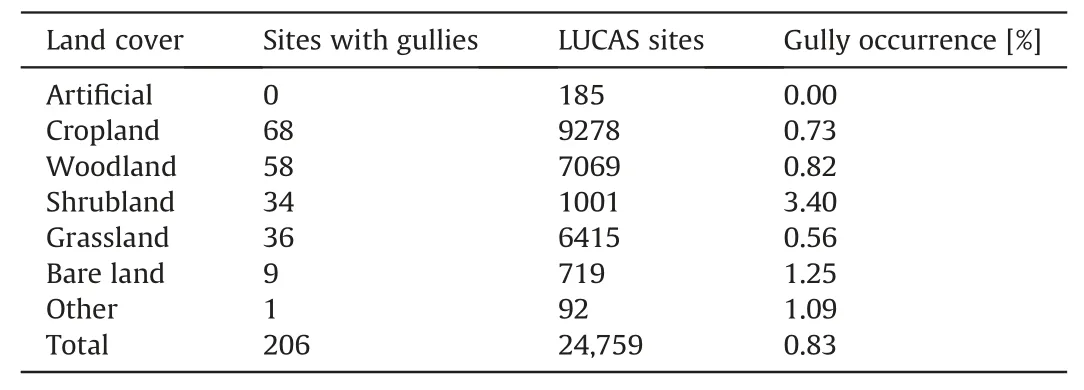
Table 4Distribution of sites with gullies per land cover category in 2018 LUCAS Topsoil sites.
3.2.Mapping performance evaluation
The procedure of post-survey validation showed that the great majority of the field observations could be confirmed through onscreen visual interpretation and included in the GE-LUCAS inventory.Only five sites(2% of total)reported to have gullies could not be validated and were classified as possible false positives.The remaining 206 field observations were verified as follows:i)50 sites(24% of total)based on the most recent Google Earth images,ii)117 sites(56% of total)with an in-depth procedure includinginterpretation of historical high-resolution satellite and aerial GE images and Street View terrestrial images,and iii)30 sites(14% of total)with LUCAS 2018 terrestrial photos.The remaining 9(4% of total)sites were validated using other high-resolution satellite images.Concerning the presence of possible false negatives,the onscreen visual assessment of the 250 randomly selected LUCAS Topsoil sites confirmed the presence of at least one gully erosion channel in 14 of the observed sites(equal to 5.6% of the total)(Fig.3).
3.3.On-screen mapping of gully heads using Google Earth
A total of 888 gully heads were detected through on-screen visual detection in the one square kilometre observation sites created around each GE-LUCAS site.Fig.4 illustrates one of the square kilometre observation sites with a high incidence of visible gully heads.The mapping activity was developed using Google Earth images,with the goal of testing the suitability of remote sensing to expand gully mapping across Europe.The observation sites were a randomly selected one third(n=70)subset of the 206 sites reported in the GE-LUCAS inventory.
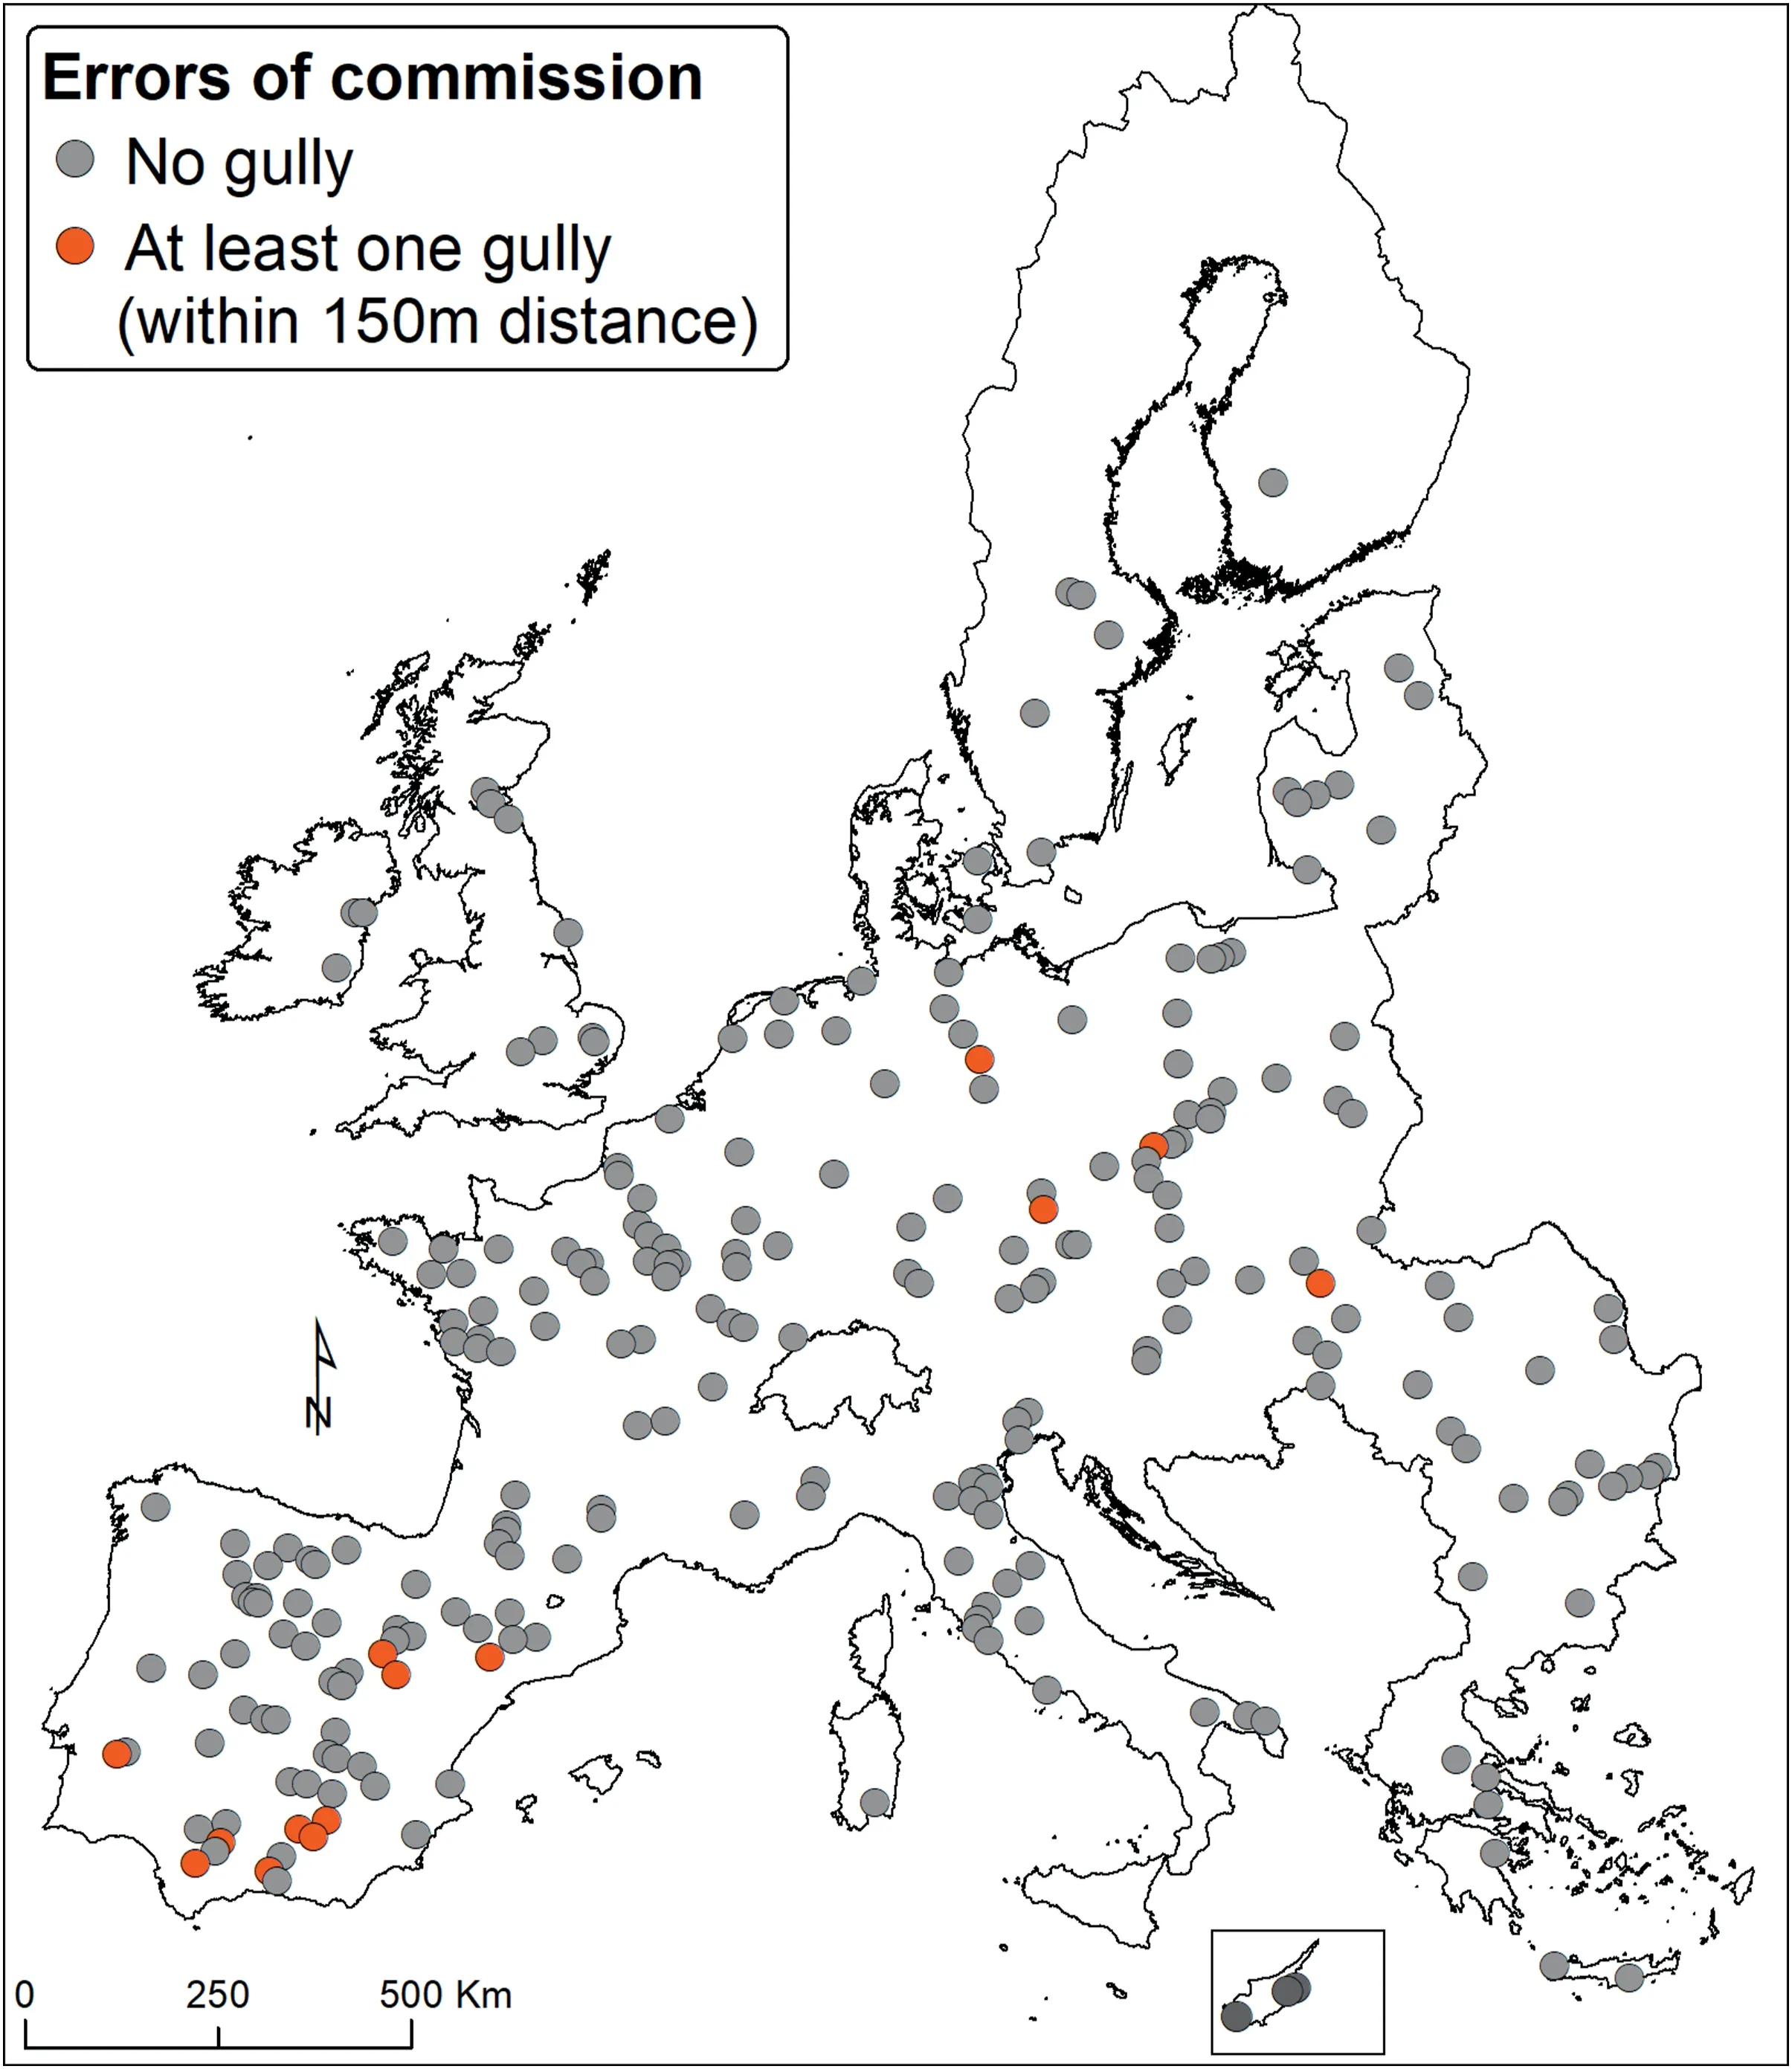
Fig.3.Representation of the 250 randomly selected LUCAS Topsoil sites for which field-based observations did not report gullies whereas on-screen observations(green dots)revealed the presence of at least one feature compatible with gully channels(i.e.,omission errors,possible false negatives).
The average gully heads in the observation sites range between 1 and 88,with an overall average value of 13.The majority of observed gully heads were found in Spain(n=619 sites,70% of total),mostly located in the Andalusian region(n=410,46% of total).The remaining 30% are primarily distributed in Greece(n=93,10.5%of total),in Romania(n=66,7.4%of total),and to a lesser extent in France(n=32,3.6%).The average gully heads mapped through on-screen operations in the countries with high incidence are 15 in Spain,12 in Greece,and 11 in France and Romania.The highest gully heads value occurs in the province of Cordova(n=152)and Ja′en(n=152)(Fig.4),both in Andalusia.
4.Discussions and future perspectives
Poesen(2018)reported that gully channels appear typically in 1—5% of total landscape observations.New insights from the first data-driven gully head density world map suggest for Europe a value which may well-exceed 10% of total landscape observations(Vanmaercke,Panagos,Vanwalleghem,&Hayas,2021).The results of this preliminary EU-wide(incl.UK)field-based monitoring system confirm an order of magnitude of gully erosion in line with the findings reported by Poesen(2018)for Europe.However,with ca.1%of verified gullies(n=206)found in 24,759 LUCAS Topsoil sites visited,this value falls into the lower end of the range reported by Poesen(2018).The low incidence of gully erosion observations in the LUCAS Topsoil visited sites is likely caused by a general underestimation of ephemeral gullies in cropland.Given the very narrow time window in which ephemeral gullies can be observed,these may not have been present at the specific time of the field observation or the Google Earth image.In fact,while permanent gullies can be observed in the field throughout the whole year,ephemeral gullies,which are generally dominant in sloping croplands,tend to be quickly overgrown by weeds(and in the case of shallow ephemeral gullies by crops)in the weeks following their formation making them very difficult to detect in the field or on remote sensing images taken months later.If crops have just germinated,farmers tend to re-drill a crop in the levelled ephemeral gully zone.If this is not possible or not done,farmers are likely to erase most ephemeral gully channels during the next soil tillage operation(Poesen,1993).This typically happens soon after the date of crop harvest(usually within 3—4 months following the ephemeral gully formation)making the ephemeral gullies shortlived.

Fig.4.Example of a LUCAS Topsoil observation site used to map the gully erosion channels through on-screen visual interpretation(black points)of GE images.All visible gullies and channel head bifurcations were mapped.The black square indicates the overall area(1×1 km),while the orange lines indicate the nine(ca.0.11 km2)sub-sectors.The illustrated site is in Andalusia(Spain)38.29°N,3.57°W(image date November 16,2019).The insert(black dotted rectangle)provides a zoom on some clearly visible gullies.
In a recent review study involving over 224 research papers dealing with gully erosion in Europe,Vanmaercke et al.(2021)stated that“overall,gully erosion mainly received significant fieldbased research attention in some particular countries,i.e.,Belgium,Germany,Italy,Spain,Romania and the UK”.The authors continue describing how“most of the observed studies focused on a single gully channel or on a limited number of selected gullies in a particular study area”.Gully inventories for extensive areas(>10,000 km2)mainly rest on aerial imagery interpretation located in Slovakia(Buˇcko & Mazúrov′a,1958)Poland(Gawrysiak &Harasimiuk,2012),Romania(Radoane et al.,1995),France(Colbeaux et al.,1997),Russian Federation(Golosov et al.,2018)and Hungary(Kert′esz & Kˇreˇcek,2019).Concerning the geographical distribution of the mapped gully erosion channels,we observed a rather diverse picture with a marked tendency to be located in the Mediterranean biogeographical region,especially in concomitance with loam and clay-loam soil textures.This is in line with the fact that soils with similar textures are also the most susceptible to sheet and rill erosion(Poesen,1993;Wischmeier et al.,1978,pp.1—69)especially if the soil organic matter content is below 2.5%.The observed patterns tend to be more clustered than previous EUwide representations from the reviewed field-based and aerial image interpretation gully erosion research(Vanmaercke et al.,2020;Vanmaercke,Panagos,Vanwalleghem,& Hayas,2021).Overall,our findings combined with those of Vanmaercke et al.,2020;Vanmaercke,Panagos,Vanwalleghem,& Hayas,2021 suggest that although gully erosion channels are found to be distributed across Europe,when systematically mapped at a given moment,they tend to be clustered in specific regions where they tend to concentrate(e.g.,parts of Spain,Western France,Eastern Romania,Bulgaria,and Greece).Some of the regions where gullies tented to be particularly clustered in our research study,such as Greece,Bulgaria and some sectors of France and Spain,appear to be under-researched in previous literature.By contrast,in regions highly studied like Italy,Belgium and UK,only few gullies were observed in LUCAS sites.
Potentially,the clustered patterns of the LUCAS Topsoil in-field mapping could also reflect a bias due to the qualitative nature of the observations,possibly affected by dissimilar judgments/interpretations of the national surveyors.It is worth stressing,however,that inconsistencies induced by surveyors are considered unlikely,as all surveyors were trained pedologists that attended LUCAS trainings.In addition,gullies are frequent,clearly visible landforms that are difficult to miss or confused with other landforms.It seems also rather unlikely that gullies are confused with ditches,which have their specific LUCAS classification among other linear landscape elements(e.g.,ditches,grass verges,hedges,dry stone walls).To further reduce doubt about possible bias about the activities of the national surveyors,procedures to assess commission and omission errors of field-based records were carried out with the aim to i)to exclude the presence of the aforementioned inconsistencies,and ii)to introduce validation procedures to evaluate the overall reliability of the field assessments.A strong agreement between field data and channels remotely identified using Google Earth imagery and the LUCAS field photos was observed.The presence of channels compatible with gullies in locations described by surveyors(who provided directions and estimated distances in meters)were found in 98%of the LUCAS Topsoil sites.Five possible false positives were flagged.These will be subject to further observations during the next LUCAS surveys if their sites are be included in the revisiting scheme.We could not classify them as proven false positives,as we could not exclude that these were accurate acquisitions of ephemeral gullies that could be obliterated by routinely tillage operations or permanent channels with sizes not detectable from available imagery.The error of omission(presence of false negative)of the 250 randomly selected locations yielded a rather low value(ca.5.6%).In this regard it is worth highlighting that one cannot interpret this as proved false negative,as gullies can be ephemeral in nature and erased by tillage operations within days or months following their formation.Therefore,some of these false negatives could have not been present during fieldwork activities.In addition,gullies may be located in areas visible in the aerial photos but of limited visibility for the survey transect,e.g.,hidden by the topography or vegetation(crops).This could be the case reported in Fig.5a,where despite the visible gully occurrence in the area,the combination of hilly topography and olives trees may have affected the ground detection mapping of the surveyors.Gullies tend to develop in small planform concavities not always easy to observe from the ground under conditions of limited visibility.Another example of limited ground visibility is shown in Fig.5b,where a gully channel is located ca.100m North of the LUCAS point.Here,despite the limited distance between the two points,the gully clearly visible in the aerial photos is hidden by the tree lines near the road.A further source of false negative could be related to the difficulties to assess the depth of the gullies using aerial photos.Some of the observed false negatives are relatively wide(Fig.5c)ephemeral gullies(clearly detectable in the aerial photos)but with a possible shallow depth(<30 cm).With a depth less than the critical channel depth defined in LUCAS's field survey protocol for gully assessment(>30 cm),these were,strictly adhering to the definition,probably not mapped by the surveyors.Accordingly,only about a handful of the 250 randomly selected locations used to assess the omission errors could be considered with high degree of certainty as false negative(Fig.5d).Despite these limitations,the rather low values achieved during the assessment of the commission and omission errors,indicate the overall fair reliability of the monitoring procedures.
On the basis of the insights gained during the validation procedures,we can preliminarily interpret the spatial desalination between LUCAS Topsoil in-field observations and literature findings(Vanmaercke et al.,2020;Vanmaercke,Panagos,Vanwalleghem,&Hayas,2021)as a fact that the latter may not necessarily reflect the regional relevance of gully erosion processes across Europe,but rather as spatial concomitance of gully erosion research.This highlights the need to introduce harmonized EU-wide soil erosion monitoring systems in addition to the well-established modelling systems(Borrelli,Robinson,et al.,2017;Cerdan et al.,2010;Panagos et al.,2015;Van Oost et al.,2009),following the example of the U.S.National Resources Inventory(NRI)(USDA,2015).The integration of a soil erosion module into the LUCAS Topsoil surveys program represents a first concrete step in this direction.Albeit limited to ca.10% of the total LUCAS sites,the sampling density tested in the current study(one surveyed point every 199 km2)could be considerably increased by fully implementing it in all LUCAS sites starting from 2022(one surveyed point every 14 km2).At the same time,given the ephemeral nature of a large portion of gullies,it is recommended to invest resources to further strengthen mapping activities based on remote sensing.The results of this study indicate a mismatch between the gullies mapped in the field and those observed using aerial and satellite imagery,which is too small to relegate it to the status of mere supporting activity of the in-field observations.Despite the limitations related to the spatial resolution of the images,often inadequate for mapping smaller gullies,the higher frequency of observations compared to LUCAS(threeyear time intervals)constitutes a non-negligible advantage compared to field surveys.This can be observed by an omission error,which is considerably smaller than the commission error.According to the insights gained in this study,the following recommendations can be made for the next LUCAS survey in 2022:i)remote sensing activities to detect and systematically map gully channels should be further explored and strengthen,and ii)in-field activities should dedicate more attention to gully measurements(e.g.,shape,depth,width,slopes,and vegetation cover)as well as the application of the soil conservation measures,environmental and other standards currently required by cross-compliance in the context of the Common Agricultural Policy(CAP)(Borrelli et al.,2016).

Fig.5.Examples of the 250 randomly selected locations used to assess the error of omission(presence of false negative).A)Site with limited ground visibility due to the presence of olive trees and complex topography(Spain,38.18°N,-2.93°W).B)Gully not visible from the LUCAS Topsoil sites due to tree lines(Slovakia,48.15°N,18.85°E).C)Site with several channels,most probably being shallow(<30 cm depth)ephemeral gullies(Hungary,47.94°N,20.65°E).D)A site for which the surveyors did not report the presence of gullies despite their existence in substantial size(Spain,37.44°N,-5.15°W).The circle within the black dotted rectangle indicates the location of a LUCAS Topsoil site.
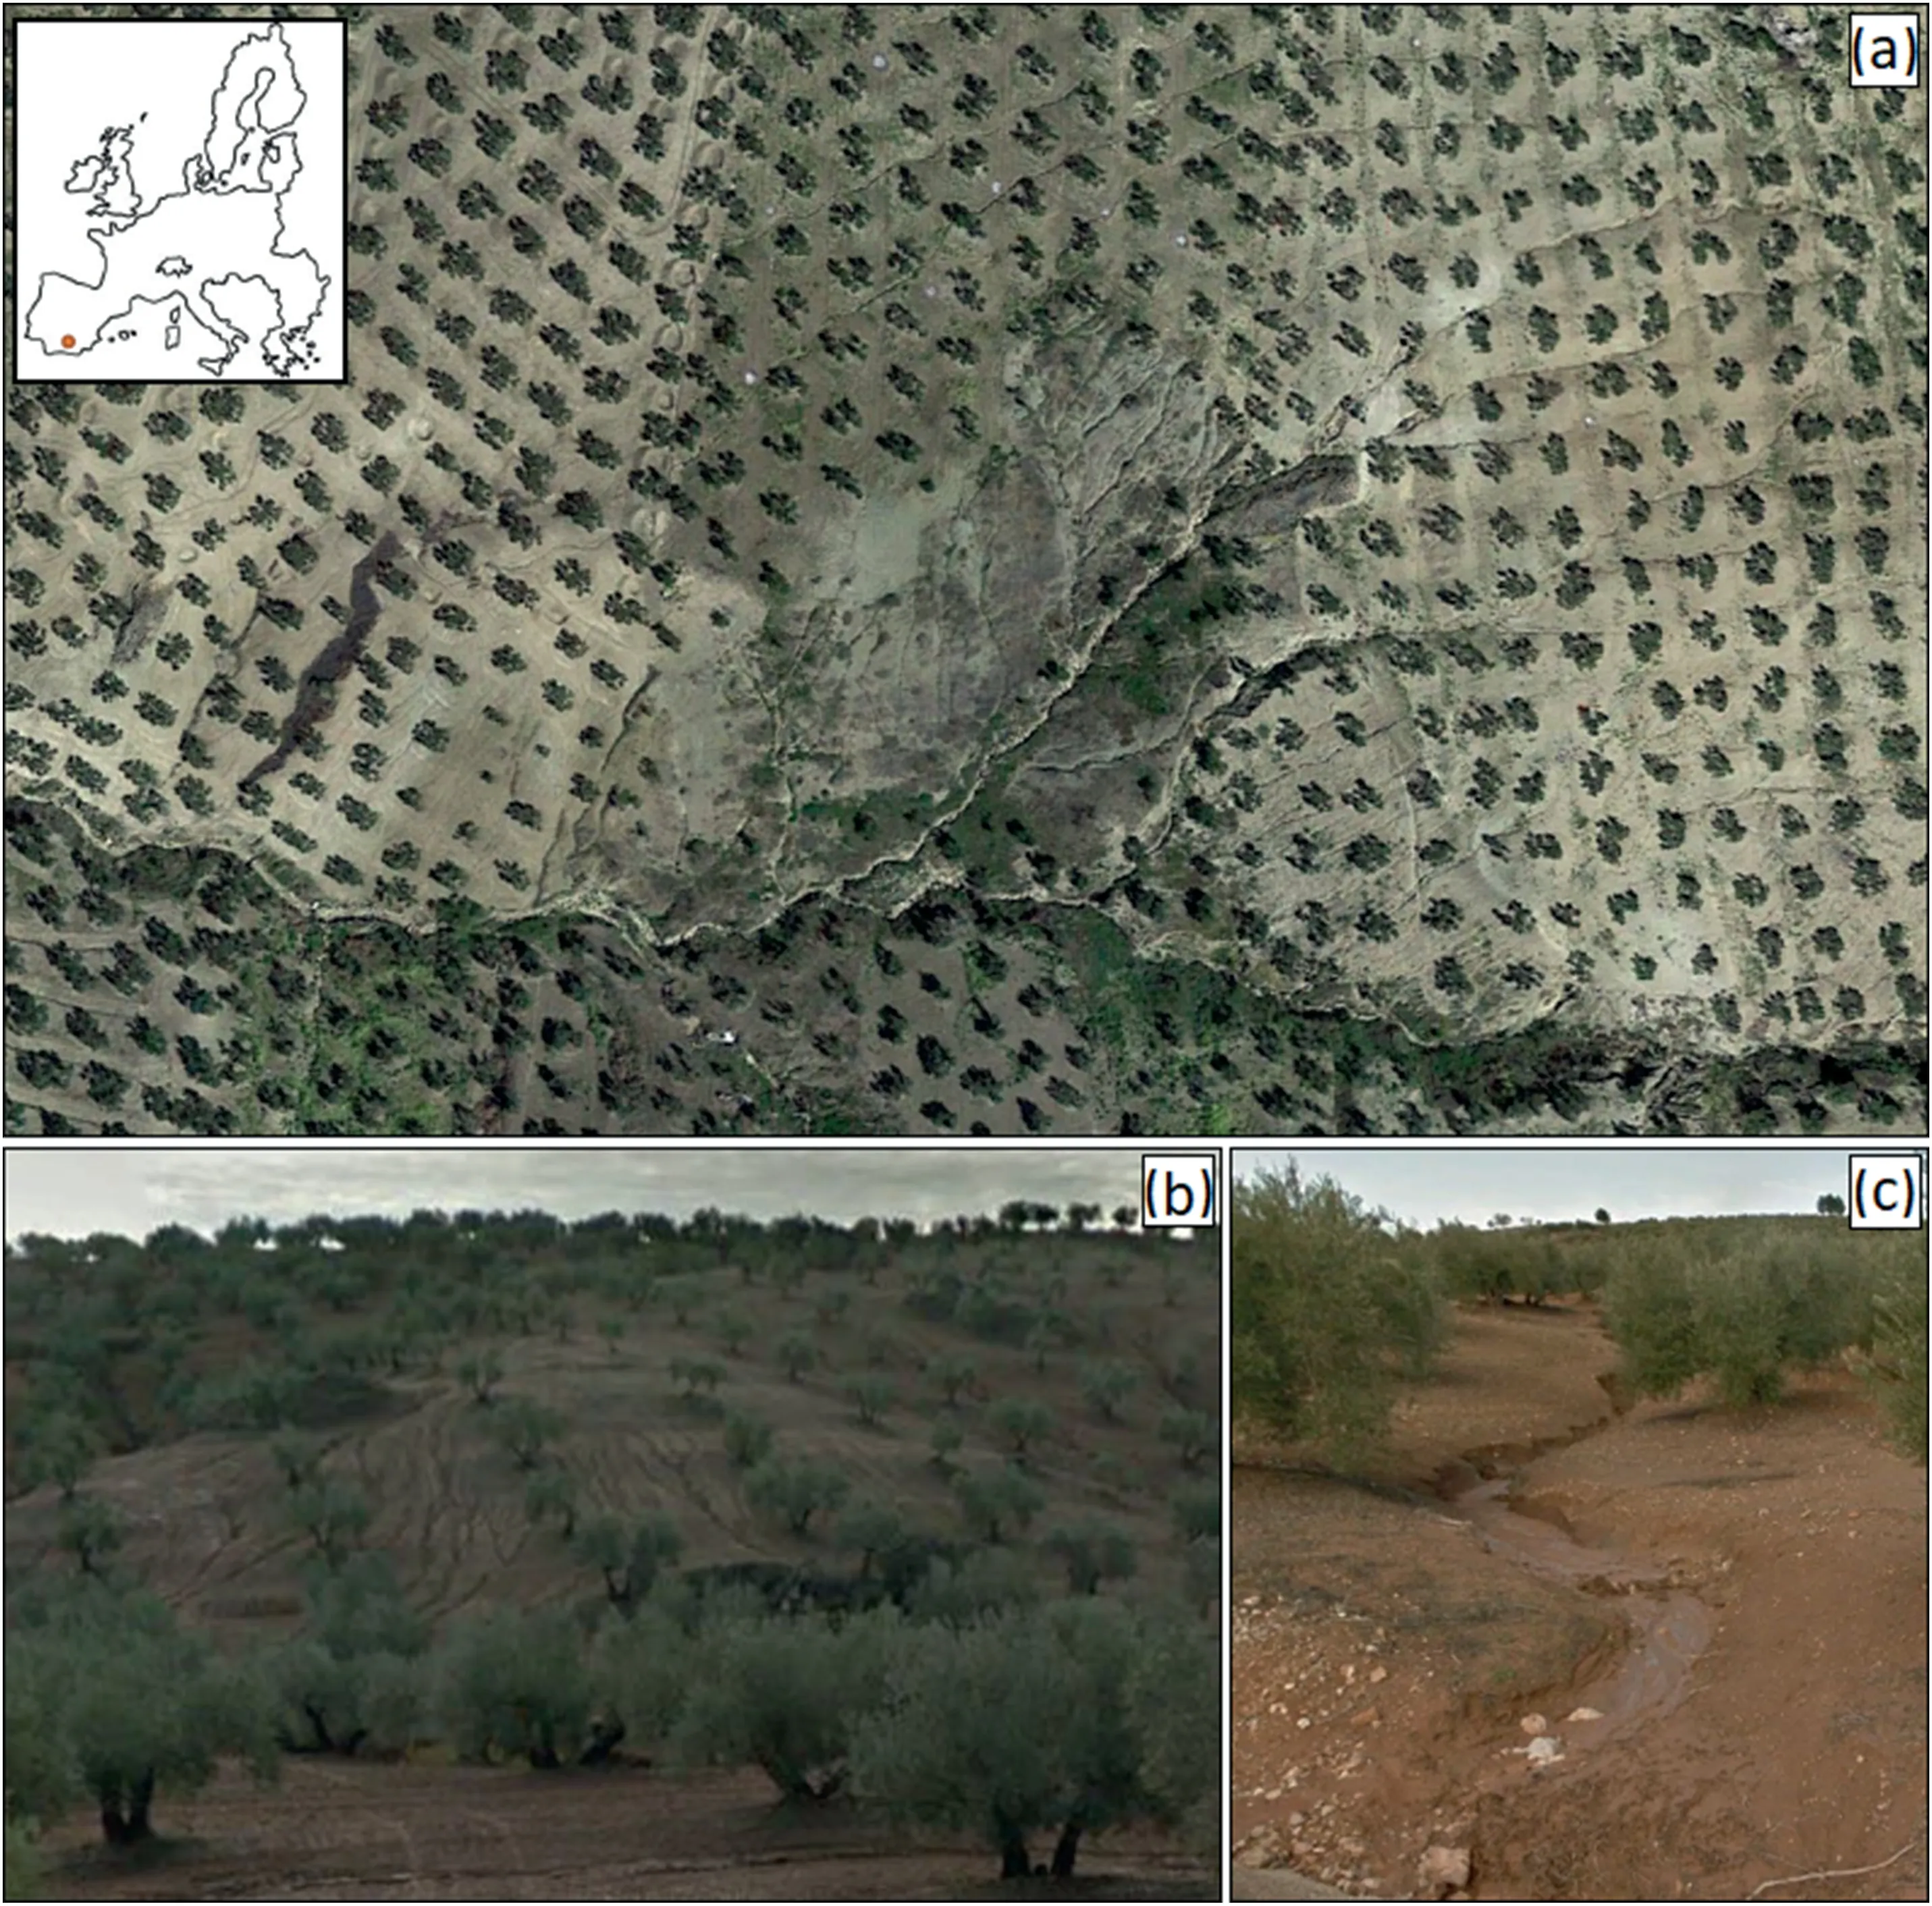
Fig.6.Example of olive groves prone to gully erosion in Andalusia(Spain—37.846N°,-3.931W°)shown on aerial and terrestrial Google Earth imagery.
As indicated by the results of our analysis,an inventory of gully erosion channels across the EU could improve the assessment of this geomorphic and soil degradation process,especially because research lacks an adequate knowledge of its spatial patterns.Contrary to wind erosion(Borrelli,Robinson,et al.,2017),sheet and rill erosion(Panagos et al.,2015),piping(Bernatek-Jakiel & Poesen,2018),landslides(Wilde et al.,2018)and soil loss by harvesting crops(Panagos et al.,2019),for which there are scientific assessment,for gully erosion a similar pan-European assessment is still missing.We considered and discussed the possibility of using the GE-LUCAS inventory to derive a preliminary EU gully erosion susceptibility assessment.A first attempt could already help to support ex-ante and ex-post policy evaluations while,scientifically,highlight areas where further in-depth research and fieldwork observations may have to be carried out.In this regard,it is worth mentioning that while performing on-screen detection quite a few highly degraded lands were recorded,such as the location in Andalusia shown in Fig.6.We intentionally decided to postpone any modelling activities to a later stage in order to ensure greater data availability.Until 2022,when the next LUCAS survey will be conducted,we will enhance our remote sensing mapping capabilities and expand the research group with further scholars.In addition,we will also continue to study promising perspectives that this explorative analysis provided,such as the importance of loamy soils and olive orchards with regard to gully erosion occurrence.Paying particular attention to the reconstruction of recent climate conditions(trends in heavy rain events)and land use land cover changes.
With regard to the activities related to the on-screen mapping of gully heads using Google Earth,a considerable number of gully heads(n=888)was mapped in the 70 LUCAS sites that were observed.This approach was particularly suitable for the detection of gullies in cropland and grasslands,while it could only offer a limited support in areas covered by wooded vegetation,which is the case in most RGB-based remote sensing approaches.AlthoughGoogle Earth imagery presents a marked spatial and temporal fragmentation across Europe,we found that in all observed LUCAS sites(n=70)the spatial resolution of the available images was adequate to map gullies in at least two different time periods.Indepth observations of the area illustrated in Fig.4(Andalusia,Spain)suggest that in areas where high spatial resolution images are available(25 cm or higher),the minimum gully top-width could be as low as approximately 2m.It is worth mentioning that such estimates are related to optimal conditions,and that the minimum gully top-width is locally influenced by several factors,such as gully depth,steepness of the channel sides,the presence of a shadow which is also influenced by several factors(time of image acquisition,direction of the gully,latitude)and ground conditions.A possible way to further exploit the LUCAS 2022 survey to better understand the minimum gully top-width and the reliability gully inventories using aerial imagery interpretation change across Europe are by implementing:
·A procedure to explore the opportunity of using drones that by means of LIDAR or Structure from Motion techniques can map the morphology and volume of gully channels.Both LUCAS sites and LUCAS 250m straight line transects(to East)could be mapped using the aforementioned approaches.The information acquired could also be useful to better define some of the other 105 variables collected with the general LCUAS survey.
·A procedure that will allow the surveyors to perform field measurements of gully top-width,floor-width and hydraulic radius for at least a sufficiently number of gullies across Europe.This information will then be used as ground truth to estimate the errors associated with mapping operations based on drones or Google Earth images
5.Conclusions
Field monitoring of gully erosion channels is labour intensive and may require conspicuous financial and human resources.As a consequence,field-based gully erosion inventories in Europe tend to be limited to local/regional scales and unevenly distributed across the continent(Torri & Poesen,2014;Vanmaercke et al.,2020;Vanmaercke,Panagos,Vanwalleghem,& Hayas,2021).The elaboration of LUCAS Topsoil field observations on gully erosion channels combined with on-screen interpretation allowed to create of a first EU-wide gully erosion inventory.This constitutes,to the best of our knowledge,the first attempt to systematically monitor gully erosion channels across the EU and UK.Therefore,it represents a novelty in the context of the scientific debate about monitoring versus modelling soil erosion(Evans & Boardman,2016;(Panagos et al.,2016)).Evaluation procedures confirmed the good performance of the proposed method,and therefore mapping gullies is suitable for the integration of the soil erosion module in the entire LUCAS survey programme.Our findings leave no doubt that LUCAS soil erosion monitoring surveys,as soon as at full capacity,will constitute a powerful tool to identify gully erosion hotspots and areas of concern.The information provided in this preliminary study offers a sound knowledge base on which targeted monitoring/modelling may build upon.Despite the observed good performance,in the light of the rather low incidence of gully erosion observations in cropland,the implementation of some criteria adjustments for mapping ephemeral gullies may be necessary.Comprehensive field observations(e.g.,Nachtergaele &Poesen,1999)showed that some ephemeral gullies,despite their small depth(<30 cm),may be rather wide(up to 10m).This situation is corroborated by our omission errors analysis.Accordingly,in the next LUCAS surveys a critical channel cross-section(Poesen et al.,2003)criterion,rather than a channel depth criterion,should be considered to separate gullies from rills forms.In addition,it seems to be important to further instruct the field surveyors to distinguish between ephemeral and permanent gullies during the next LUCAS operations.Meanwhile,the spatial patterns emerging from the LUCAS Topsoil surveys will be further investigated to gain a better understanding of the role of local soil,climate and environmental conditions play for the development of gully erosion across the EU and UK.
Data availability
The Gully Erosion LUCAS visual assessment(GE-LUCAS)inventory(in ESRI's Shape file and KML formats)including GE pictures are freely available for download at the European Soil Data Centre(ESDAC-https://esdac.jrc.ec.europa.eu/)web repository(Panagos et al.,2012).As we make this inventory available,public users are free to reuse,modify or enhance the current version 1.0 of GE-LUCAS.
Declaration of interests
The authors declare that they have no known competing financial interests or personal relationships that could have appeared to influence the work reported in this paper.
Declaration of competing interest
The authors confirm that there is no conflict of interest with the networks,organisations and data centres referred to in this paper.
Acknowledgements
The authors are thankful to LUCAS surveyors for collecting the soil samples and recording the soil erosion assessment and the European Commission's DG ESTAT,DG ENV and DG AGRI for supporting the LUCAS soil survey.Pasquale Borrelli was funded by the EcoSSSoil Project,Korea Environmental Industry & Technology Institute(KEITI),Korea(Grant No.2019002820004).
杂志排行

International Soil and Water Conservation Research的其它文章
- GUIDE FOR AUTHORS
- A detailed reconstruction of changes in the factors and parameters of soil erosion over the past 250 years in the forest zone of European Russia(Moscow region)
- Changes in hydrologic components from a mid-sized plots induced by rill erosion due to cyanobacterization
- Organic manure input and straw cover improved the community structure of nitrogen cycle function microorganism driven by water erosion
- Soil properties characterization for land-use planning and soil management in watersheds under family farming
- Land surface roughness impacted by typical vegetation restoration projects on aeolian sandy lands in the Yarlung Zangbo River valley,southern Tibetan plateau