Bearing fault diagnosis with cascaded space projection and a CNN
2022-03-02YunjiZhaoMenglinZhouLiWangXiaozhuoXuNannanZhang
Yunji Zhao·Menglin Zhou·Li Wang·Xiaozhuo Xu·Nannan Zhang
Abstract Fault diagnosis is essential for the normal and safe operation of dynamic systems.To improve the spatial resolution among multiple channels and the discriminability among categories of the original data collected from actual operating equipments and to further achieve high diagnostic accuracy,this paper proposes a method for fault diagnosis by cascaded space projection(CSP)and a convolutional neural network(CNN)model.First,one of every kind of sample is selected from the original data to calculate the PCA transformation matrices.Second,the original data are expanded to 10 dimensions by the W2C projection matrix provided by Google-image searching,which is the main part of CSP.Third,the ten-dimensional matrix is multiplied by the PCA transformation matrix, which corresponds to its fault type, to make the data more representative by reducing unnecessary dimensions.Finally,the processed data are converted into images to input into a CNN,the backbone structure for fault diagnosis.To verify the effectiveness and reliability of the proposed method,the Case Western Reserve University(CWRU)and Xi’an Jiaotong University(XJTU-SY)rolling bearing datasets are used to perform experiments.Comparison with other methods is carried out to show the superiority of the proposed method.The experimental results demonstrate that the method proposed in this paper can effectively achieve 100%accuracy.
Keywords Color names·Fault diagnosis·Principal component analysis·CNN
1 Introduction
In recent years, bearing fault diagnosis has played an important role in many research areas, such as industrial manufacturing processes for maintaining normal and safe industrial systems. In prognostics and health management(PHM),accurate fault diagnosis is an essential task for advantages both economically and securely and for the avoidance of any potential risk.In this context,various fault diagnosis methods have been investigated and proposed. In the early days of fault diagnosis researches, the methods based on the experience of expert transcendental knowledge and the techniques based on mathematical models have been extensively used.The above methods require a great deal of prior knowledge and expert work[1,2].With the development of computer technology and artificial intelligence,data-driven methodologies based on deep learning have attracted extensive attention[3–5].
Most data-driven fault detection and diagnosis methods based on deep learning achieve diagnosis tasks by applying different deep learning models or improving them. For example,Liang et al.proposed a WT-GAN-CNN approach to achieve high diagnostic accuracy under the change of working conditions and the disturbance of noise [6,7]. Ding et al.[8]proposed a comprehensive diagnosis network named the stacked autoencoder sparse filter for rotating components to extract invariant features. In addition, Wang et al.[9]constructed a batch-normalized autoencoder network by adding batch normalization after every layer of the normal autoencoder network and directly feeding raw data into the constructed deep learning network. All the above methods rely on the feature extraction function of neural networks to achieve high fault diagnosis accuracy while ignoring the spatial features contained in the data. Accurate fault diagnosis based on a complex network will negatively affect the efficiency of diagnosis.
To maximize the use of time-domain or frequency-domain fault signals, some studies have focused on the influence of data more than networks and preprocessed raw data by decomposing the original faulty signals or fusing multichannel data.For example,Jiang et al.used motor current signal analysis (MCSA) to study the characteristic frequencies of fault data to accomplish diagnostic tasks[10].He et al.developed a variational mode decomposition (VMD) method to fully extract complex nonlinear and non-stationary characteristics contained in the collected fault data[11].To reduce the dimensions of raw bearing vibration signals, Zhu et al.used adopting principal component analysis(PCA)method for data processing and faulty signatures were consequently extracted in terms of primary eigenvalues and eigenvectors by DBN deep learning[12].Furthermore,Pan et al.proposed a method based on wavelet transform(WT),PCA,and selfcorrelation noise reduction to extract the combined faults from rolling bearings[13].PCA is proved to be effective in the preprocessing of fault data for faulty signature extraction.However,PCAhasflawsinthediscriminabilityamongdifferent categories.Encouraged by PCA,we consider proposing a new space projection method for data preprocessing to improve the spatial resolution among fault data and the discriminability among different categories.
Therefore, aiming at improving the spatial resolution among different fault data types to further reduce the complexity of the network, in this paper, we explore a data preprocessing method for bearing fault diagnosis:cascaded space projection (CSP, a combination of color names (CN)and PCA). To make the collected fault data more specific and discriminative, the original raw data are projected into a ten-dimensional space by CN, which subdivide the raw fault features into different and specific sections. Although the projected data are subdivided into more discriminative space, the ten-dimensional data are superfluous, and some dimensions are useless. Therefore, PCA is used after CN to extract principal fault features and reduce dimensions by projecting the ten-dimensional data into a new coordinate system.Due to the superiority of preprocessed data,CNNs,the classic and relatively simple deep learning method,can achieve high-accuracy fault diagnosis.
The data preprocessing methodology of cascaded space projection can effectively enhance the spatial resolution and separation of different types of data. The proposed bearing fault diagnosis method with CSP and CNN is verified on two common bearing datasets, the Case Western Reserve University (CWRU) bearing dataset [14] and Xi’an Jiaotong University (XJTU-SY) dataset [15]. Experimental results show that the proposed method outperforms the state-of-art fault diagnosis methods in accuracy and stability.
The innovations and main contributions of this paper are described as follows:
· A novel CSP data preprocessing method based on CN and PCA is developed to effectively improve the spatial resolution among multiple channels and discriminability among categories of the collected fault data.
· A new fault diagnosis method based on CSP and a CNN deep learning algorithm is proposed to achieve 100%diagnostic accuracy within a short time.
· Comprehensive experiments are designed and carried out to fully verify the effectiveness of CSP and the CNN model by comparison with un-preprocessed data.
2 Materials and methods
2.1 CSP
The proposed CSP preprocessing method is a combination of color names(CN)and principal component analysis(PCA),which can enhance the spatial resolution and discriminability of different types of data.The explanation of CN and PCA is explained in detail as follows:
Color names,also named color attributes,have had a great impact on image recognition and object detection fields in recent years[16–18].They are linguistic color labels to represent different colors in the real world. In the linguistic world, there are 11 basic color labels: red, orange, yellow,purple,pink,green,gray,brown,blue,black,and white[19].The main method of CN is to transform the original RGB image into 11 dimensions.However,due to the uselessness of grayscale-dimensional images,in this paper,we transform the original three-dimensional images into ten-dimensional images via a W2C32,768×10matrix learned by Google-image searching[20].The sum of the ten-dimensional color representations is 1.Transform process is presented as Eq.(1)

where W2C32,768×10is the CN projection matrix provided by Google-image searching.X1(i, j)denotes the value of every fault point of the original data.X0(i, j)represents the transformed value after projection.
CN can extract all features of the object and divide them into ten channels according to the difference of the extracted features. Because of the importance of the choice of color features for the success of objective detection, it is crucial to select representative data for fault diagnosis. Therefore,it is worth using the CN scheme for reference to effectively classify fault characteristics and extract representative fault features.
PCA is a popular and widely used data analysis method.PCA transforms the original data into a set of linearly independent representations of each dimension through linear transformation, which can extract the main characteristic components of the data. It is often used for dimensionality reduction of high-dimensional data.The specific dimensionreducing steps are as follows:
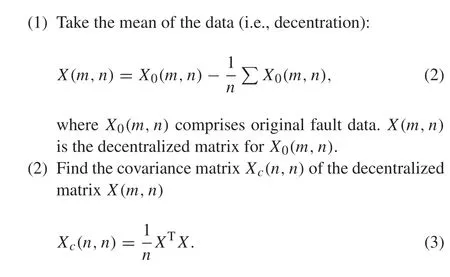
(3) Calculate the eigenvalues and eigenvectors of the covariance matrixXc(n,n),and arrange the eigenvalues from largetosmall.Then,determinethenumberofeigenvaluesk(k <n).In this paper,4 is chosen forkto subsequently reshape the fixed size of the image matrix for training and testing.The eigenvector matrix,which consists of eigenvectors corresponding to the eigenvalues,isP(n,k).
(4) The data after dimension reduction are

In this paper,m= 784,n= 10, andk= 4. In most fault diagnosis works, 784 data are selected for each sample, so the value ofmis 784.Because of the specific mapping matrix of CN,nis equal to 10.Not all ten-dimensional characteristic data obtained from CN contribute to fault diagnosis,so PCAis used to reduce dimensions to reduce the computational complexity of the subsequent network.
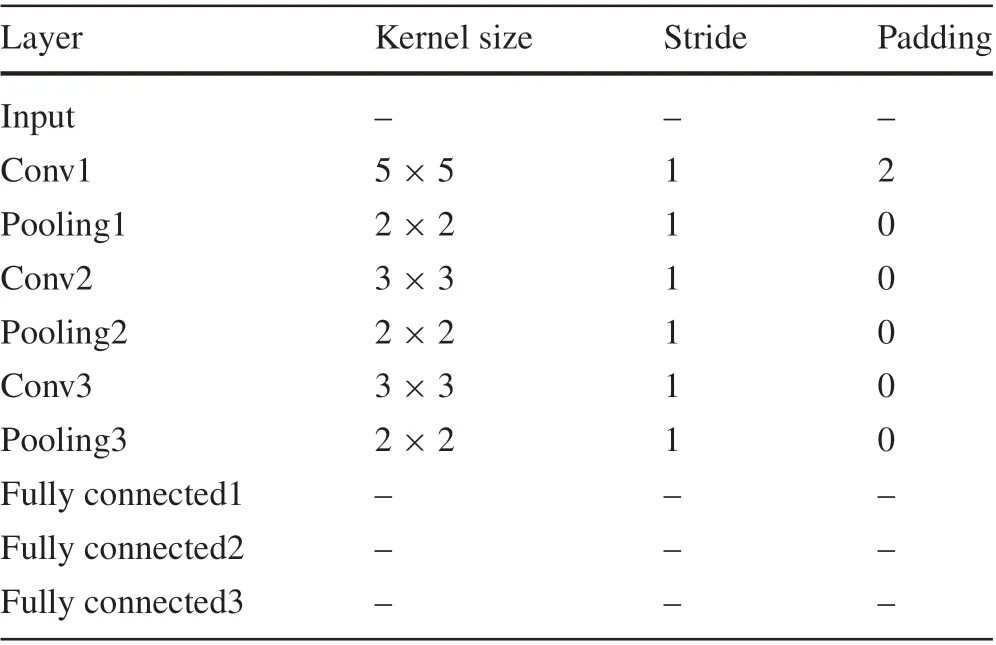
Table 1 The structure of the CNN model used in this paper
2.2 Convolutional neural network
As one of the most representative methods of deep learning,convolutional neural networks(CNNs)have performed well in image recognition and object detection.It generally consists of three parts: convolution layers, pooling layers, and fully connected layers. Convolution is the core of CNNs.First, using a certain number of filters, the feature maps of an image can be obtained after convolution layers.Second,pooling layers can compress the input feature maps.On one hand,pooling layers make the feature maps smaller and simplify the computational complexity of the network. On the other hand,feature compression is carried out to extract the main features.Finally,the fully connected layers connect all features and send the output value to the classifier.
In this paper, the CNN model consists of three convolution layers and max pooling layers and three sequential fully connected layers.The model finally outputs five fault types.The results show that the simple network CNN can effectively achieve excellent fault diagnosis after space mapping of the original data.The structures of CNN used in paper are shown in Table 1.
3 Bearing fault diagnosis with cascaded space projection and CNN
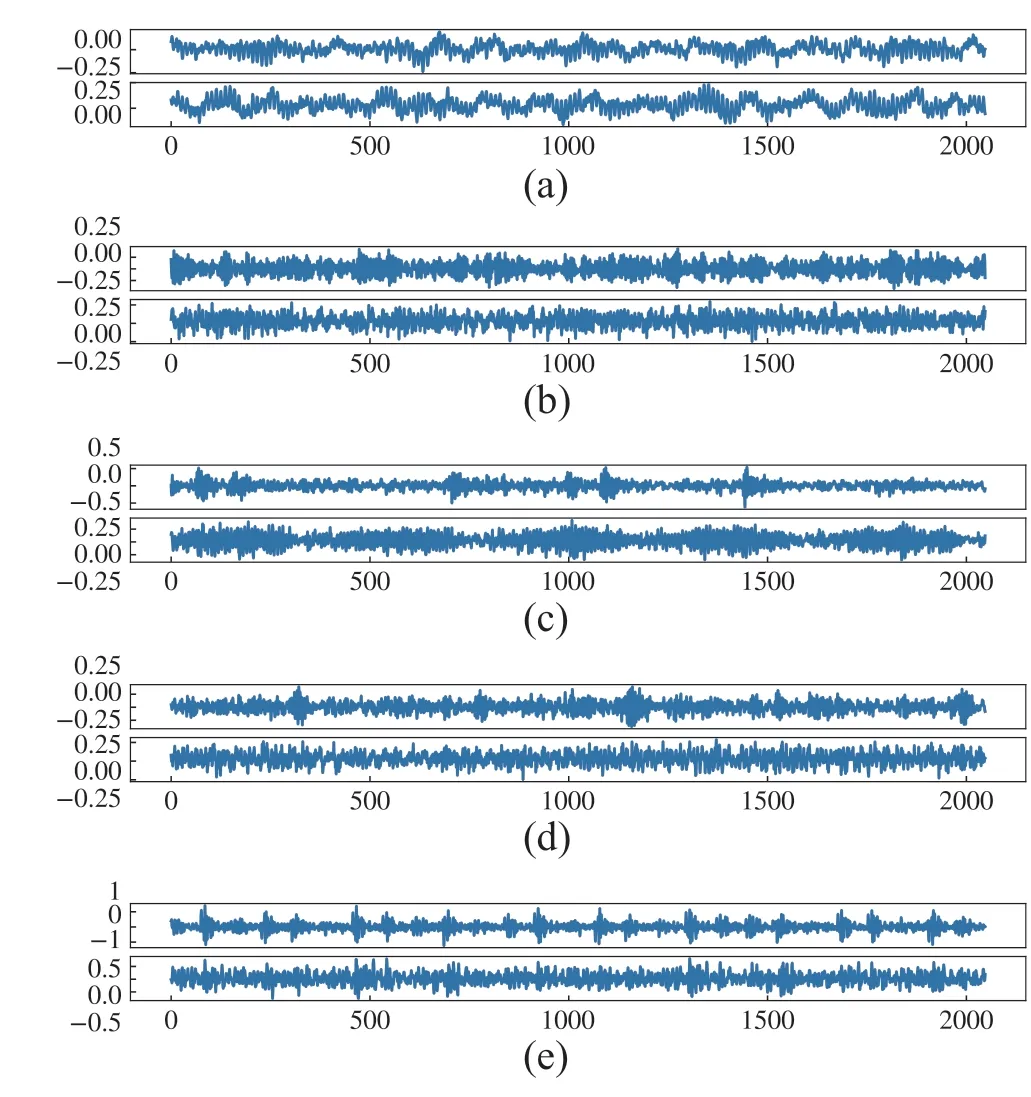
Fig.1 Five original types of CWRU fault data.a Type 1.b Type 2.c Type 3.d Type 4.e Type 5
Most intelligent data-driven fault diagnosis methods achieve highly accurate classification rate through two approaches.One is converting the original fault data into images and applying different convolutional networks.The other is converting the original fault data into images by applying improved models based on basic CNNs such as multiscale convolutional neural networks(MCNNs)[21],transfer convolutional neural networks(TCNNs)[7],and partly interpretable convolutional neural networks [22]. However, the above methods extract fault features by the convolutional layers of neural networks,whose calculations are complex.To consider the negative influence of noise data and take advantage of most data features S and the correction among them, the data preprocessing method CSP is proposed for fault diagnosis in this paper. After data preprocessing, the simple trained CNN model can effectively achieve accurate fault diagnosis within a short time.
To verify the validity of the proposed method,the CWRUbearing dataset and XJTU-SY dataset are used to conduct experiments. Taking CWRU as an example, Fig.1 shows the five collected original types of fault data.Figure2 shows images converted from raw data and images converted from preprocessed data.As shown in Fig.2,the data preprocessing method CSP(i.e.,combining CN and PCA)can effectively lower the likelihood ratio of two random types of faults and elevate the spatial resolution characteristics of highdimensional data.
As mentioned earlier,directly converting the original data into images and feeding into networks will perplex the calculation and cost time.It is essential to improve the spatial separability of random two types of faults.A schematic diagram is shown in Fig.3 to present an effect that the two random types of faults with low spatial differentiation have obvious spatial differentiation after data preprocessing.
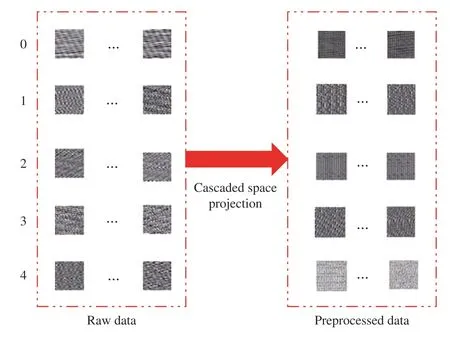
Fig. 2 Images converted from raw data and images converted from preprocessed data
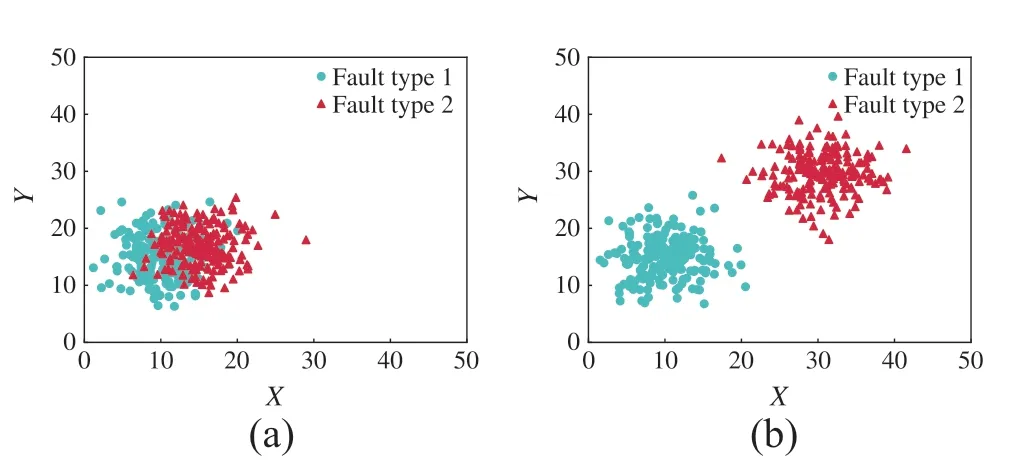
Fig.3 A schematic representation of data preprocessing functionality.a Original data.b Preprocessed data
To further reduce the calculation complexity,the PCA process is different from the common algorithm.We first select five different types of faults as representative samples from alldatasamplestobeprojectedbyCN.WecalculatefivePCA transformation matrices whose sizes are 10×4.Therefore,after projection by CN,all subsequent samples directly multiply the 10×4 PCA projection matrix,which corresponds to their fault type.The specific CSP process is shown as Fig.4.
The CSP method is used in data preprocessing to effectively exploit features and information of original data.Before the CNN starts to train a model and test, the preprocessed data are converted into images.Three consecutive 2D convolution layers and max pooling layers are stacked to extract global features in CNN and to reduce parameters and preserve the main features.Then,three fully connected layers are used at the end of the network to finally classify the five rolling bearing fault types.The flowchart of the method proposed in this paper is shown in Fig.5.
By comparing the results of using various networks,which are shown in the Sect. 5, it is verified that the simple convolutional neural network we used in this paper can achieve great performance. There are two significant advantages of preprocessing the data and using CNN to train and test.First,CN and PCA can make most data not only extract global and specific features but also eliminate useless information.Second,as a relatively simple network in the deep learning field,CNN is used as the backbone for training and testing,so that the diagnosis speed can be faster,while the accuracy is maintained.

Fig.4 The process of CSP
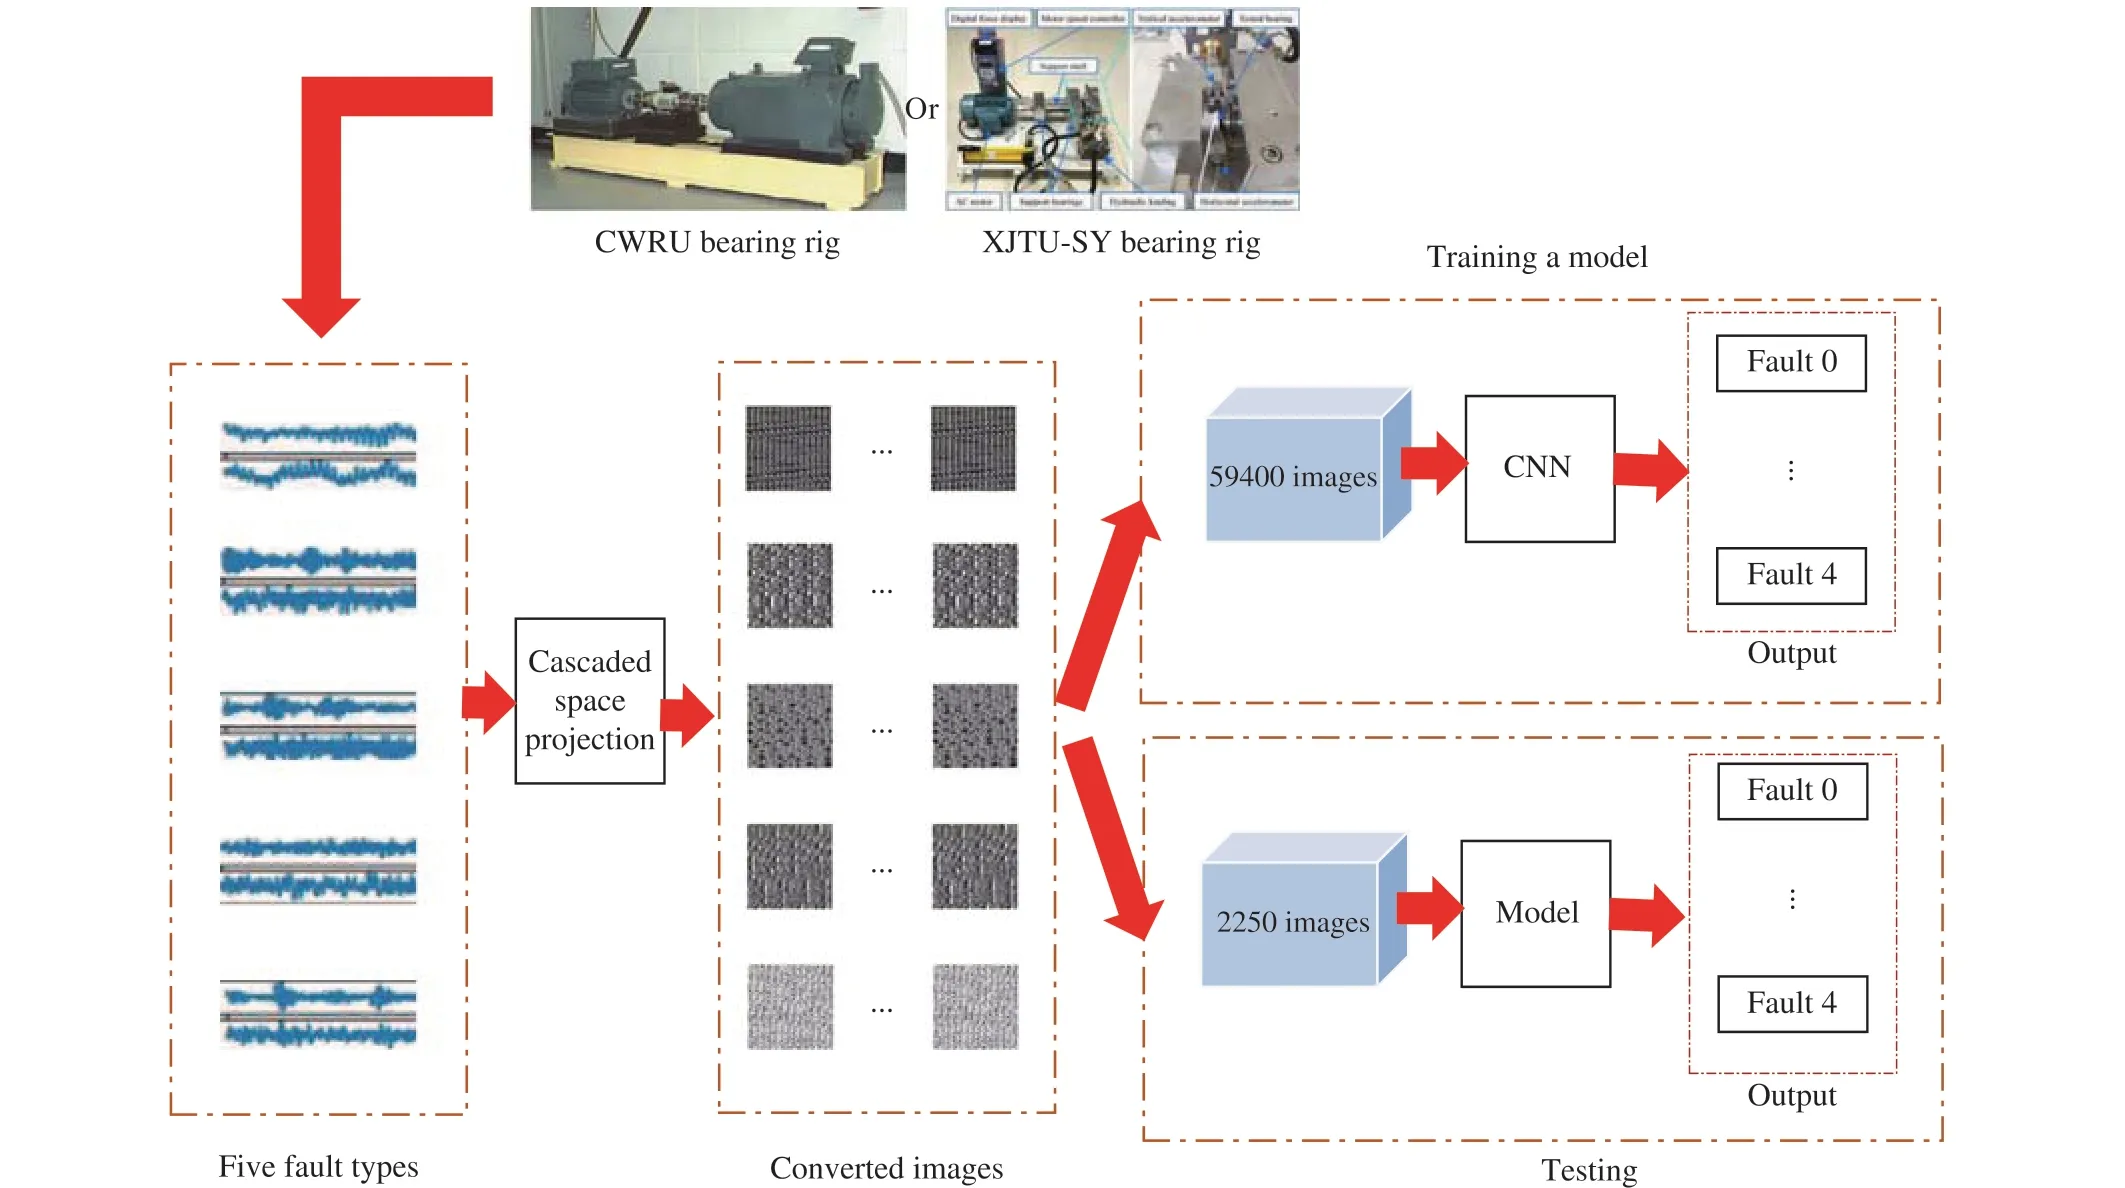
Fig.5 The framework of the fault diagnosis method is based on CSP and CNN.The data including five fault types are collected from the CWRU bearing rig and converted into numbers of images after CSP.CNN extracts features from inputted images and trains a fault diagnosis model
4 Experiment
4.1 Data acquisition
As two of the most important benchmarks in the field of fault monitoring, the CWRU rolling bearing dataset [14]and XJTU-SY bearing dataset [15], which both have five classes of faults,were used in this paper to perform experiments.The XJTU-SY dataset has three working conditions:2100r/min (35Hz) and 12kN; 2250r/min (37.5Hz) and 11kN; 2400r/min(40Hz)and 10kN. Each working condition has five kinds of faults.To be consistent with the CWRU dataset,only the five kinds of faults at 2100r/min(35Hz)and12kN are used in this paper.The five fault types of the CWRU dataset and XJTU-SY datasets used in this paper are shown in Tables2 and 3,wherek=1000.
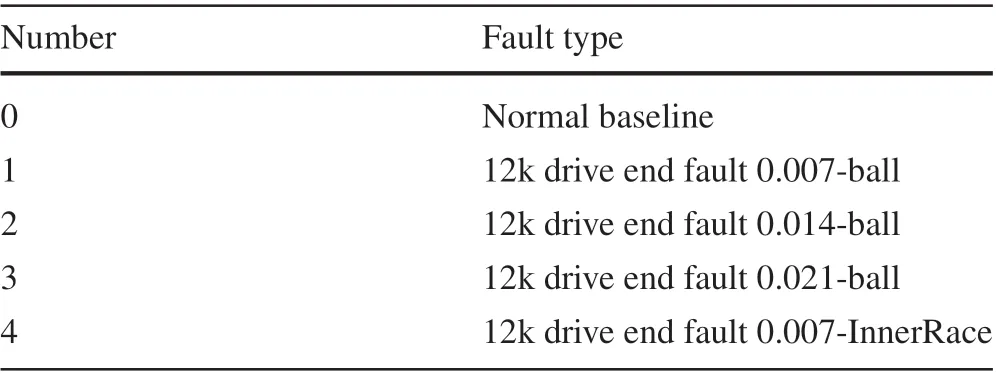
Table 2 Five fault types of the CWRU dataset
The CWRU dataset used in this paper has 9900 training datasets and 375 testing datasets. Each set of data is composed of two-dimensional data of 2048×2. To avoid inadequate training due to a small amount of data,we repeat the selection based on the original data. Analogous to the three RGB channels of input data in image detection,three channels of data from the original are selected to multiply the W2C transform matrix.Three channels of data are convertedto ten channels after multiplying the W2C matrix.Therefore,the size of each set of data is 784×10 by the first projection of CN after simply selecting 784 data for one channel.
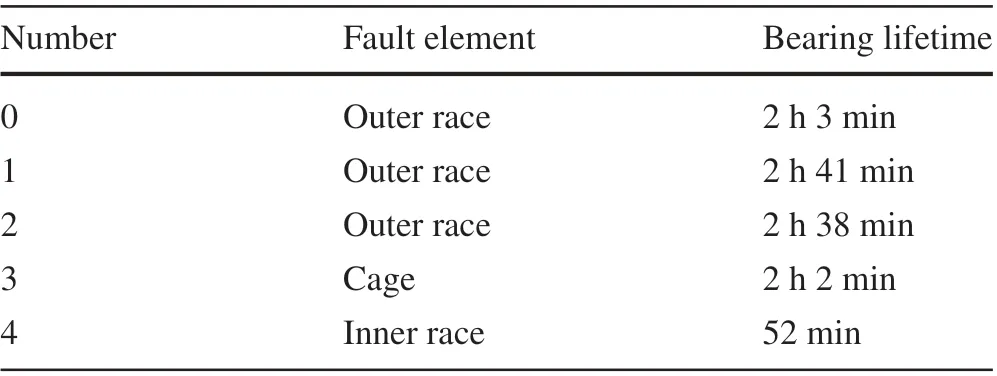
Table 3 Five fault types of the XJTU-SY dataset under 2100r/min(35Hz)and 12kN working conditions
However, the amount of computation on the subsequent network is large due to the complexity of the data.The PCA method is used here to reduce the dimensionality of the data and reserve useful information. Ten-dimensional data converted from CN become four-dimensional by the calculated PCA projection matrix corresponding to the fault types,whose size is 10×4.At this point,the final form of each set of data is 784×4,and they are transformed to images whose size is 56×56.
Every kind of fault type data of the XJTU-SY rolling bearing dataset is composed of two-dimensional horizontal vibration signals and vertical vibration signals.Only horizontal vibration signals are used in this paper for the preparation of other data,and the experimental results show that dimensional vibration signals are enough to achieve high diagnostic accuracy.Data that have not been preprocessed by cascaded space mapping are also converted into images by simply selecting 784 data from each set for the subsequent comparative experiment to make our theory more convincing.
4.2 Experiment settings
Images that have been transformed from preprocessed rolling bearing fault data of CWRU and XJTU-SY will be input into the CNN to train a deep learning model and test. In training and testing sessions, the batch size is 128 and the learning rate is 0.001. The training is performed with 20 epochs. Experiments are repeated to ensure the stability of the results. The results demonstrate that the accuracy and loss fluctuate within a very small range. The comparative experimentisconductedusingthemeanvalueoftheresultsof the two groups.Both experiments use CNN as the backbone network to train and test.
We test our method on a Windows system with an Intel(R)Core(TM)I7-9700K processor,32.0 GB of memory and an NVIDIA GeForce GTX 1080. PyCharm is used as an integrated development environment, and Python is used as a compiled language.
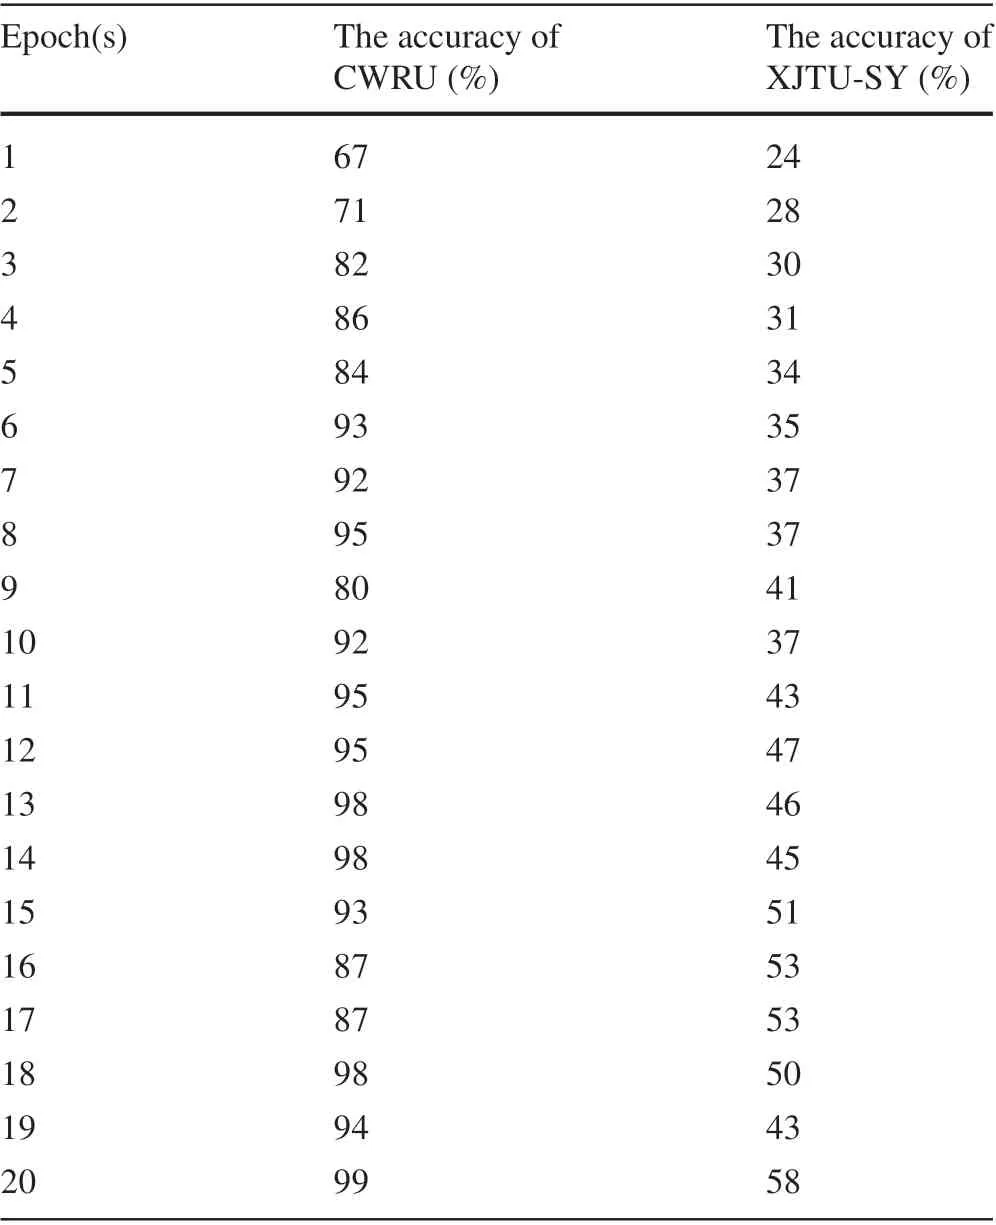
Table 4 The testing accuracy of un-preprocessed data on CWRU and XJTU-SY datasets
The overall experimental process is divided into two parts.Experiments on images transformed from raw data and transformed after the preprocessing of CSP are verified. The experimental results are compared to show the excellent performance of the method proposed in this paper.
5 Results and discussion
5.1 Results
Three-channel data collected from rolling bearings of CWRU andXJTU-SYareconvertedintotendimensions after thefirst projection by CN, which settles the problem of deficiency of raw data. At the same time, as the number of channels increases, so does the amount of computation. The dimension reduction method of PCA can reduce the number of channels and make the data more representative.To further reduce the computational complexity,the PCA projection is first calculated by selecting five fault samples.Therefore,then×10 projection matrices can be reduced ton×4 by directly multiplying the 10×4 PCA projection matrix,which corresponds to its fault type.Table4 shows the testing accuracy of the un-processed data on the CWRU-and XJTU-SY-bearing data.
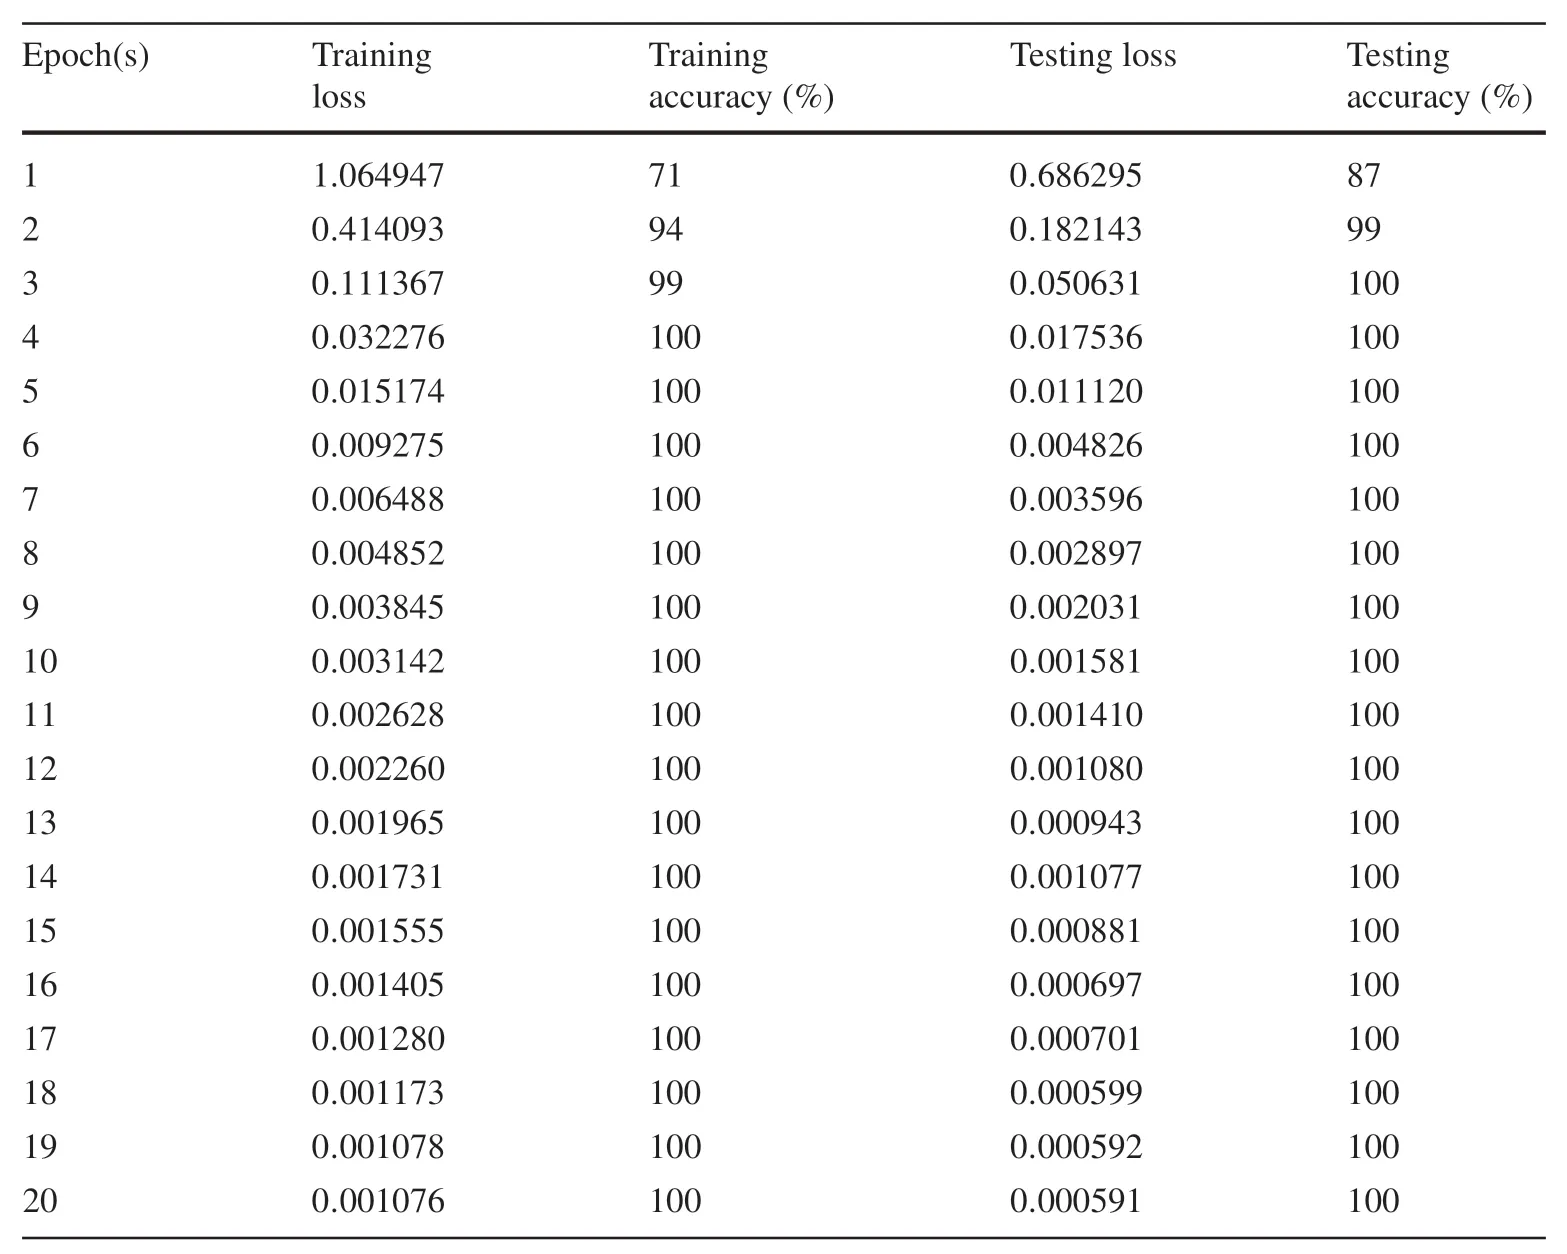
Table 5 The loss and accuracy of training and testing based on CSP and CNN on the CWRU dataset
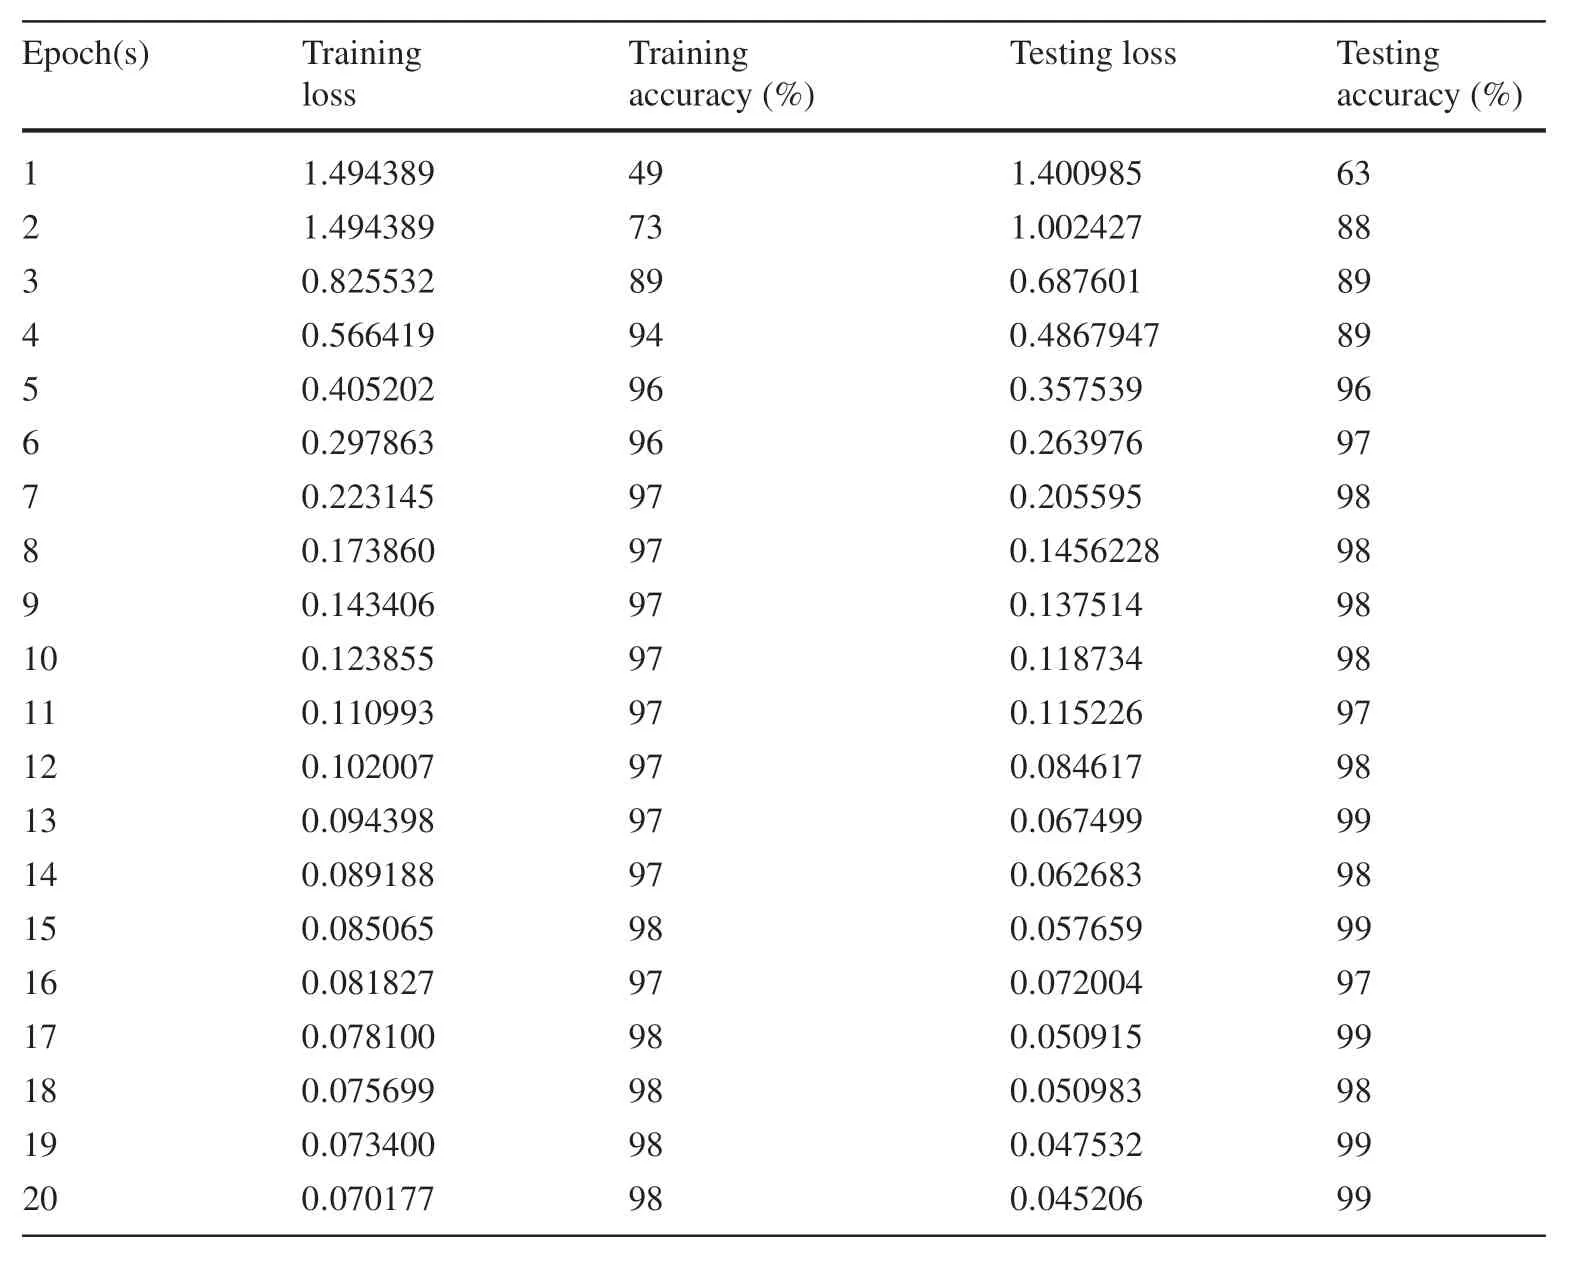
Table 6 The loss and accuracy of training and testing based on CSP and CNN on the XJTU-SY dataset
The accuracy results of the experiment using the preprocessed CSP data and the original CWRU and XJTU-SY data are presented in Tables5 and 6,respectively.
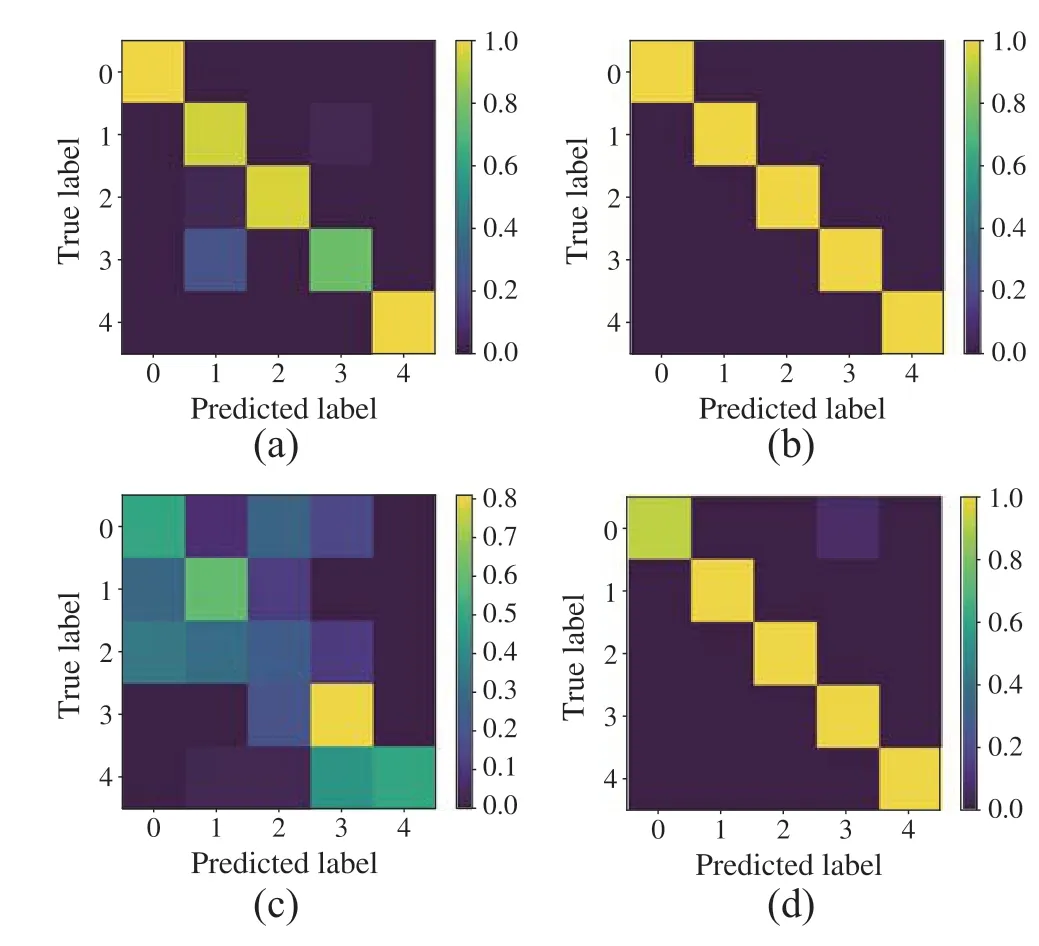
Fig.6 Confusion matrix of the last testing epoch using the data preprocessedbyCSPandoriginaldataonCWRUandXJTU-SY.a CWRUdata with original.b CWRU data with CSP.c XJTU-SY data with original.d XJTU-SY data with CSP
As shown in Tables4, 5, and 6, the highest accuracies of un-processed CWRU and XJTU-SY are 98% and 58%,respectively.The highest accuracies of the CWRU and XJTU-SY data preprocessed by CSP are 100% and 99%,respectively,which are extremely high for bearing fault diagnosis.In addition,the diagnostic efficiency is promising.It is shown that the method proposed in this paper,which introduces CSP as data preprocessing,can achieve high accuracy compared with un-processed data.
The confusion matrix is a situation analysis table that summarizes the prediction results of the classification model in machine learning. In the form of a matrix, records in the dataset are summarized according to the criteria of real classification and classification judgment made by the classification model.It is very easy to indicate whether there is confusion between categories such as one class is predicted to be another class. Therefore, Fig.6 shows the confusion matrices of the last testing epoch using the data preprocessed by CSP and original data on CWRU and XJTU-SY.
5.2 Discussion
Figures7 and 8 show the testing accuracy and testing loss between preprocessed and original data,respectively,on the CWRUandXJTU-SYrollingbearingdatasetsmoreintuitive.Because of the characteristics of CWRU, deep learning methods can achieve more than 90%accuracy with original fault data[14,23].XJTU-SY is an accelerated life test dataset of rolling bearings, which contains more than just failure information.Therefore,the accuracy curves of preprocessed and un-processed samples in Fig.7 are close,while those in Fig.8 are very different.To further verify the validity of data preprocessing, the spatial distribution of the original data and CSP preprocessed data are presented in Fig.9, which comprehensively proves that the proposed CSP method can improvethespatialresolutionandthediscriminabilityamong fault categories.
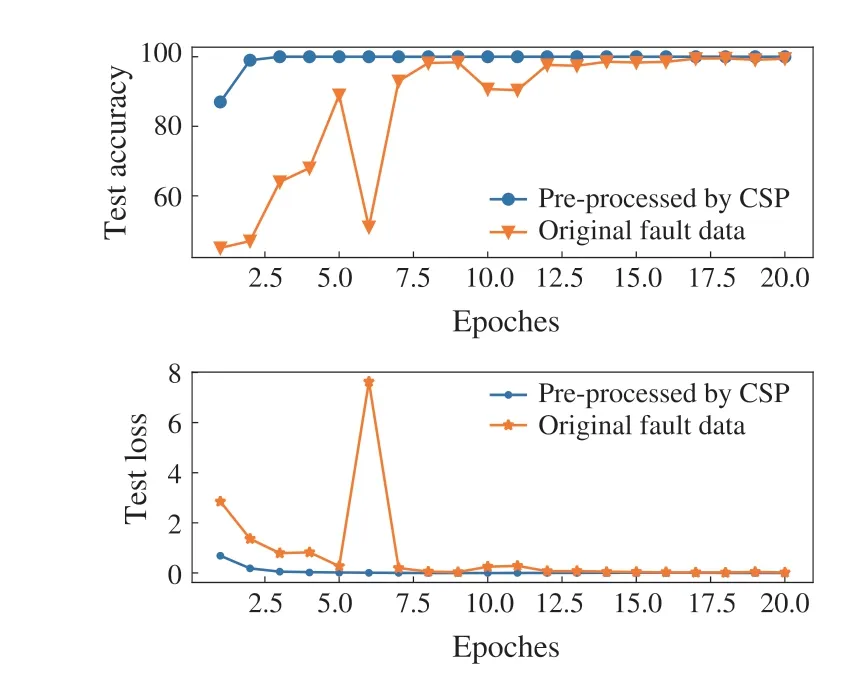
Fig. 7 Contrast figure of testing accuracy and testing loss between preprocessed and original data on the CWRU-bearing dataset
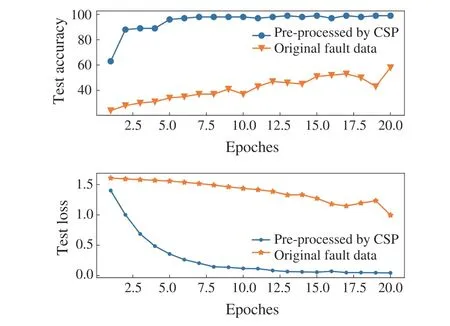
Fig. 8 Contrast figure of testing accuracy and testing loss between preprocessed and original data on the XJTU-SY bearing dataset
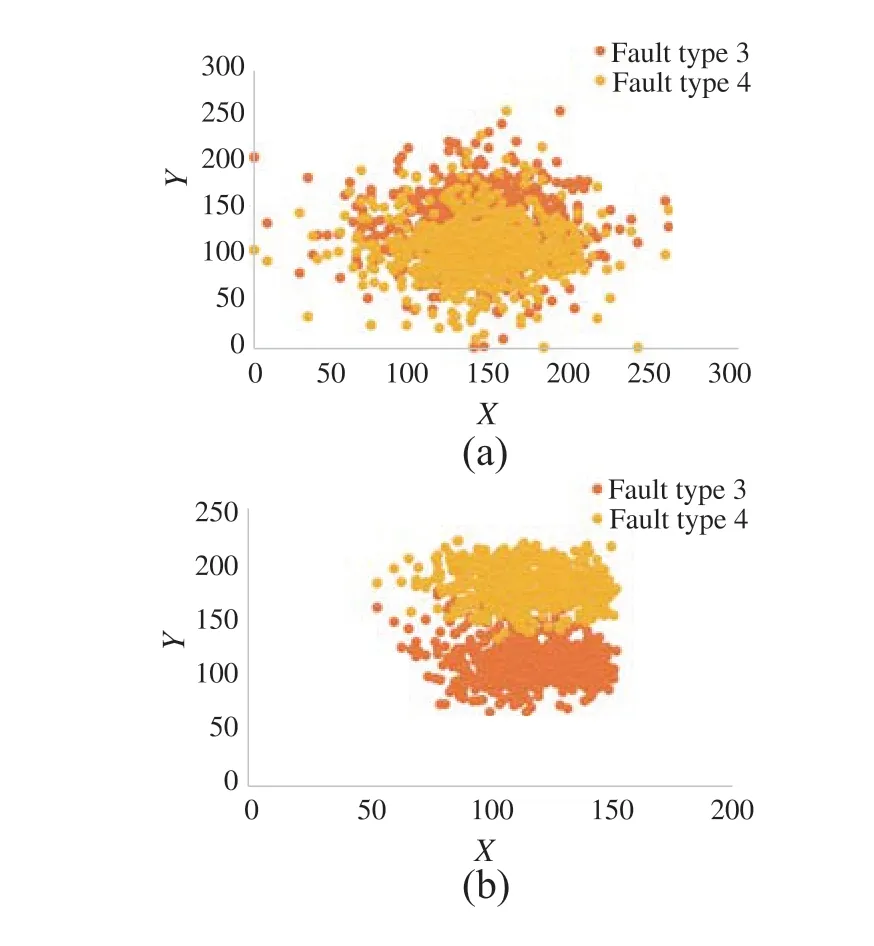
Fig.9 The spatial distribution of original data and CSP preprocessed data.a Original data;b CSP preprocessed data

Table 7 Diagnostic accuracy of the proposed method and other methods on CWRU dataset

Table 8 Accuracy and computational complexity comparison of CNNs with different convolutional layers
With the improvement of spatial resolution and the discriminability among categories of the original data,even the simple CNN network can effectively achieve high diagnostic accuracy.Table7 shows the excellent performance of the proposed method in accuracy compared with a siamese neural network based on deep convolutional neural networks with wide first-layer kernels (WDCNN) [14], multiscale CNN(MCNN)[21],transfer CNN(TCNN)[7],and residual network(ResNet)[23].
The spatial separation among fault categories has been improvedafterthepreprocessingofCSP,whichwouldreduce the burden on the network. To prove the point and achieve an effective diagnosis, CNNs with different convolutional layers are used to conduct experiments and calculate the number of parameters (Params) and floating-point operations(FLOPs).Params and FLOPs are measurable indexes to showthecomputationalcomplexityofadeeplearningmodel.Params denote the weight and the total amount of bias in the model.Flops are the calculation quantity index of the model,which presents the computational complexity of the model.It is can be seen from Table8 that the CNN model with three convolution layers (the model used in this paper) contains the least number of Params and FLOPs.Therefore,the CNN model used in this paper has high diagnostic accuracy and small computation.
Besides, the method proposed in this paper is better in terms of not only accuracy but also diagnostic speed.It needs only 20 min to complete the diagnostic task for CWRU based ontheCSPandCNNmethod,while90minareneededinRef.[14]. Compared with [23], which combines space mapping(SM)and a deformable convolutional network(DCN)on the CWRU dataset,the time of data preprocessing is the same,while the network diagnostic time used in this paper is much less.Because of the amount of data,less time is required to diagnose the XJTU-SY dataset.Table9 shows the time cost of the proposed methods,[14,23],which are abbreviated as original+WDCNN and SP+DCN,respectively.Furthermore,Table10 presents the accuracy, Params, and FLOPs of the above methods to highlight the advantages of the proposed method. Although SM+DCN has the lowest FLOPs, CSP+ CNN has the best overall performance on the accuracy,Params,FLOPs,and the cost of time.
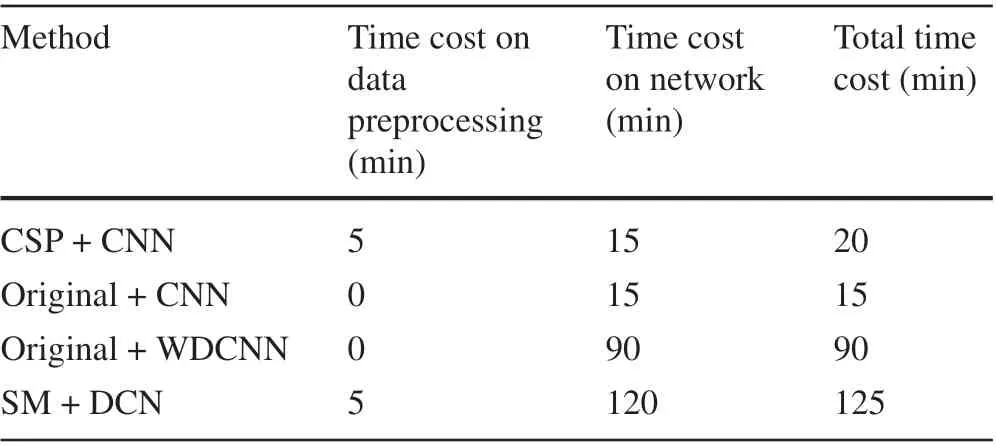
Table 9 Time cost of the proposed method and other methods
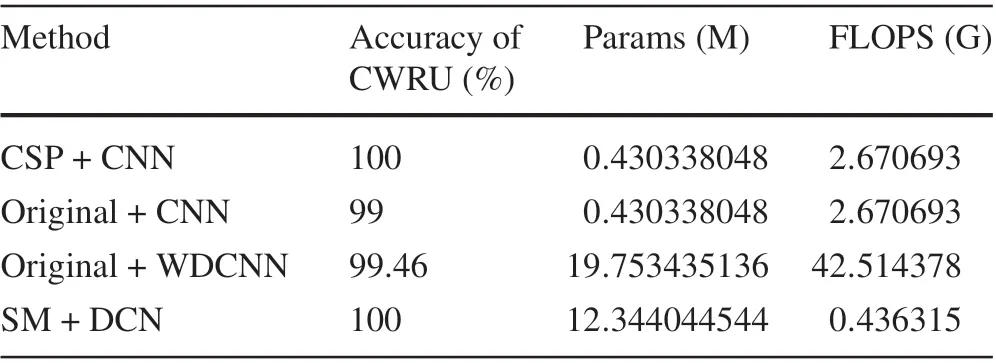
Table 10 Accuracy and computational complexity comparison of the proposed method and other methods
In summary, experiments show the effectiveness of the proposed method.Tables4,5,and 6 and Figs.6 and 7 present the accuracy of the proposed CSP and CNN methods. The spatial distinction among fault categories has a great impact on the accuracy of fault diagnosis.Figure8 demonstrates the function of CSP.The deep network does not have to be complicated when the spatial resolution among data categories is discriminative. Therefore, CNN, a classic and relatively simple deep learning network, can achieve high-accuracy diagnostic tasks.Table7 shows the efficiency and fast diagnostic speed compared with WDCNN and DCN.
6 Conclusions
In this paper,we introduced a method for data-driven bearingfaultdiagnosisbyaddingcascadedspaceprojection(CSP,i.e.,combined CN and PCA)in data preprocessing and using CNN as a backbone network to reduce the complexity of computation.The comparison with un-processed data shows that using CN and PCA in data preprocessing can not only extract all global features of input images and divide them into different channels according to the difference of features,but also effectively reduce the computation by reducing the dimensions,while the data are more representative.To verify the validity and reliability of the method proposed in this paper,CWRUandXJTU-SYrollingbearingdatasetsareused to perform experiments. Experimental results have demonstrated that the method proposed in this paper can achieve high diagnostic accuracy and fast speed.
As next steps,with the successful application of cascaded space projection in data preprocessing,one can explore different lighter backbone networks to achieve online training and testing under the promise of ensuring accuracy, stability,and speed of fault diagnosis.This will address the fault diagnosis task in a more concise and efficient way.
Acknowledgements We wish to thank the anonymous reviewers for their valuable suggestions and comments on this paper. We also wish to thank the authors of CN for providing the source code.
杂志排行
Control Theory and Technology的其它文章
- System identification with binary-valued observations under both denial-of-service attacks and data tampering attacks:defense scheme and its optimality
- Adaptive output regulation for cyber-physical systems under time-delay attacks
- Distributed robust MPC for nonholonomic robots with obstacle and collision avoidance
- Sparse parameter identification of stochastic dynamical systems
- Constrained nonlinear MPC for accelerated tracking piece-wise references and its applications to thermal systems
- Adaptive robust simultaneous stabilization of multiple n-degree-of-freedom robot systems
