State of health based battery reconfiguration for improved energy efficiency
2022-02-11LeYiWangGeorgeYinYiDingCaipingZhang
Le Yi Wang·George Yin·Yi Ding·Caiping Zhang
Received:20 May 2022/Revised:9 October 2022/Accepted:11 October 2022/Published online:13 December 2022
©The Author(s),under exclusive licence to South China University of Technology and Academy of Mathematics and Systems Science,Chinese Academy of Sciences 2022
Abstract
Keywords Battery system·State of health·Battery aging·Capacity utilization·Energy efficiency·Battery regrouping
1 Introduction
Battery systems for vehicle and power grid applications are critical components whose efficiency and reliability are dominant factors for robust and sustained operations of electric vehicles and renewable energy systems.Due to unpredictable chemical processes, dependance on charge/discharge rate and depth, temperature, and environment conditions, the aging processes of battery modules are highly uneven,stochastic,and difficult to predict,either prior to their deployment or over a long horizon during operation. Electric vehicles for passenger cars and industrial systems encounter diverse environment conditions, demand faster charging time,and endure deeper discharge depth for sustained operating ranges.All these factors impose high stress on battery modules and imply faster and uneven aging processes. As a result, to ensure endurance of battery systems, it is critically important that battery systems remain operational and efficient under reduced and increasingly uneven battery capacities.
Typical large-scale battery systems in vehicle and grid applications consist of battery modules that are interconnected by serial connection to increase voltage and parallel connection to increase ampere-hour(Ah)capacity.Such network structures introduce a physical relationship between battery modules’states of health(SOHs)and the SOH of the entire battery system.
This paper analyzes the system-level SOH and its dependence on the SOHs of its battery modules in a stochastic framework. Based on estimated SOHs of battery modules,we investigate how the SOH of the entire system deteriorates as a stochastic process that is conditional on its members’SOH aging processes. When disparity of battery capacities becomes wider due to aging,the entire system’s SOH decays rapidly. Using battery reconfiguration, the overall battery available capacities can be used more fully and efficiently,leading to extended operational ranges of the battery system. Stochastic analysis on the properties and benefits of battery reconfiguration is performed rigorously.Simulation case studies are presented to evaluate and demonstrate the methods introduced in this paper.
Battery aging has been extensively studied at cell levels,including their basic mechanism [1], SOH estimation [2],cycle depths that affect aging processes[3],and temperature effects [4]. Several battery aging models have been introduced to facilitate real-time SOH prediction[5].The typical features of the aging process, characterized by slow aging first,followed by accelerated aging,then rapid aging after a certain keen point, have been observed and analyzed [6,7].Typical battery aging models have been proposed [8,9]. In our recent work, data-based aging analysis [10,11], online SOH estimation[12],and SOH-based charging process[13]have been investigated.
Battery regrouping has been studied for battery systems in different applications.Thermal fields and temperature distributions of Lithium-Ion battery packs were estimated and computationally constructed for studying battery stress and aging in[14].Dynamic grouping and regrouping of EV battery systems were investigated in their usage for distributed charging stations to support electric markets in [15]. To address the issues of combining diversified battery types and capacities of retired battery modules to support secondary usages of battery systems,[16]introduced a fast sorting and regrouping method on the basis of charging curves and a machine learning algorithm. Various methods for regrouping retired battery systems were reviewed in[17].
This paper has a different focus and addresses the issue of uneven aging processes in battery systems in vehicle or stationary applications during their primary operations. By employing stochastic aging models, our analysis captures the random aging processes and develops new strategies for enhancing battery capacity utilization. This paper contains the following contributions: (1) It introduces certain measures of battery capacity utilization at the system level.(2)A method of stochastic analysis is developed that captures the random battery cell aging processes and their impact on the system-level SOH. (3) An optimal regrouping algorithm is introduced.(4)Impact of SOC estimation errors on battery capacity utilization is presented.(5)Based on the stochastic analysis method,a potential optimization problem for maintenance scheduling is proposed. A preliminary conference version of this paper presented the main ideas of battery reorganization for improved battery efficiency without verbatim analysis and details in[18].
This paper is organized as follows. Section 2 describes the basic battery system structures considered in this paper.Battery aging processes and their models are summarized in Sect. 3.Statistical analysis of system-level battery efficiency is presented in Section 4.Under uneven battery capacities,we introduce the notions of total usable energy,maximum operational energy,and maximum energy efficiency and capacity utilization. Section 5 considers the detrimental impact of uneven states of charge(SOC)of battery modules on capacity utilization.Section 6 investigates the impact of battery aging on the system-level SOH. Battery regrouping strategies are introduced and the efficiency improvement by regrouping is analyzed.A maintenance scheduling problem is formulated as a multi-objective optimization problem.The analysis and battery regrouping method are evaluated using case studies in Section 7.Finally,some closing remarks are given in Section 8.
2 Battery systems
In this paper,the basic battery unit for building a networked battery system is abattery modulethat can be as simple as a battery cell or a pre-packaged battery system itself. This paper aims to understand the properties of the battery network structure and overall efficiency, impact of individual battery module’s health conditions,and SOH-based management strategies.

Battery charge and discharge processes are highly diverse,depending on load variations. In this paper, starting from a givenSOC,theAhthroughputratioTiscalculatedasthetotal amount of accumulated Ah charge/discharge divided by the battery module’s rated capacity after it returns to the same SOC.The Ah throughput ratioTis viewed as the“time”in evaluating a battery module’s rate of aging and describing“fast”or“slow”loss of capacity,etc.In our analysis, we use thepermitted SOCof a battery module as its operational range labeled as fromSmintoSmax.The permitted SOC range is typically much smaller than a battery’s chemical SOC range. In commercial applications,the permitted SOC range is often defined as the lower and upper bounds of the battery protection circuits that safeguard thebatteryfromover-chargingandover-discharging.Itisalso a common practice to normalize the range so thatSmin= 0 andSmax=1.To concentrate on and simplify SOH analysis,we impose some basic assumptions.
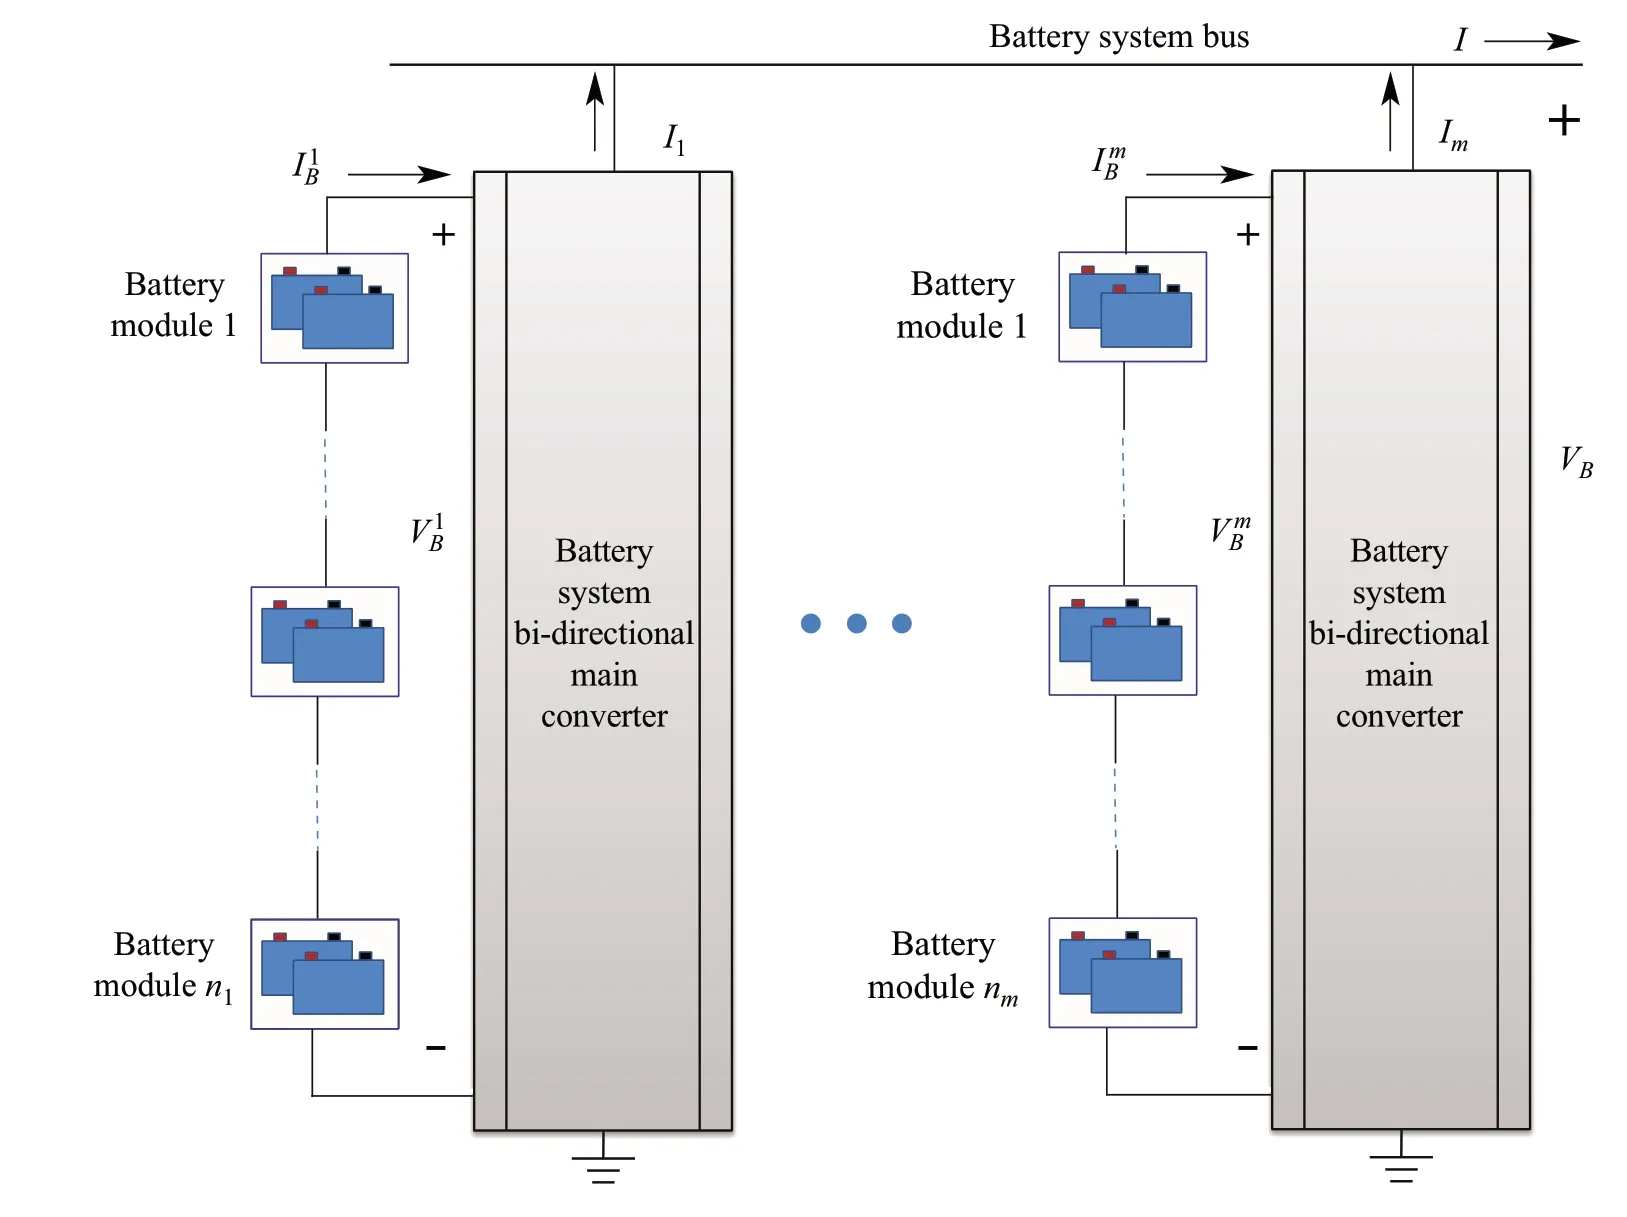
Fig.1 System structure of a battery system
Assumption 1
1. The power converter circuits are lossless.
2. The capacity variations between charge and discharge,under different temperatures,due to time-varying rates of charge/discharge or unequal depths of charge/discharge for a specific battery module and at a specific time will be ignored.The average capacity will be used as a representative SOH afterTthroughput ratio.
3. We use a uniform range[Smin,Smax]for all modules.In a string of battery modules,the charge process must stop when any of its modules reachesSmax.The discharge process must stop when any of its modules reachesSmin.
4. Although during charge/discharge processes,the terminal voltages of battery cells or modules change with time,to focus on the main theme of energy efficiency in this paper all voltages are the average voltages in the range of operation.This is based on the following observations:If a battery module is fully charged or discharged under a constant currentI0over a time intervalT,then the total energy is

whereV=v(t)dt/Tis the average voltage variation.This simplification will be used in the remaining sections of this paper.


Letbe the open-circuit voltage(OCV)of thejth module in theith string.As a result,the string terminal voltage is,which implies that
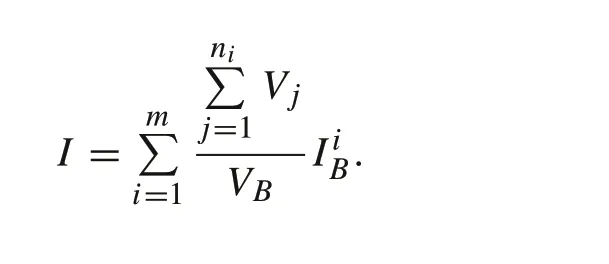
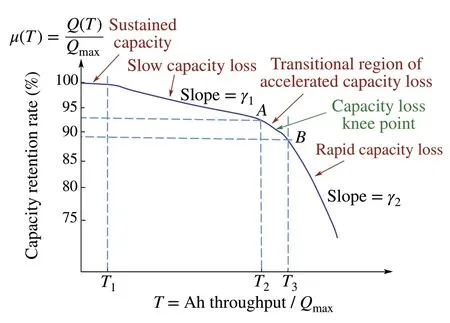
Fig.2 Typical capacity reduction of lithium-ion batteries
3 Stochastic battery aging processes
When battery systems are new,it is possible to select modules that are relatively uniform in their capacities and OCVs in a string.However,during battery operation,the actual capacities will change due to aging.The capacities of the modules in a string decay at different rates that are stochastic processes.
Most common aging features of battery cells are depicted in Fig.2;see[2,3,5,9,10]for detail.The Ah throughput ratioT,defined as the battery Ah usage divided by the rated Ah capacity,is a continuous variable representing battery usage,similar to a vehicle’s mileage. Battery aging is characterized by the loss of usable capacity. For a specific battery which will depend on a characterizing parameterθ, to be detailed later,the agingμ(T,θ)=Q(T,θ)/Qmaxis defined as the ratio of the current usable capacity to the rated maximum capacity when the battery is new.The typical battery aging curve in Fig.2 is characterized by several key parameters.ForT∈[0,T1]a relatively new battery maintains its capacity.FromT=T1toT2,the battery shows slow aging that can be modeled by a nearly constant (negative) slopeγ1. Then the battery aging accelerates in a relatively small interval [T2,T3], reducing its values fromμ(T2,θ) =Atoμ(T3,θ) =B. The middle point(T2+T3)/2 is called theknee pointthat may be used as an approximate point between slow and fast aging.AfterT3,the battery experiences rapid capacity loss with rateγ2,and|γ2|≫|γ1|.
For each battery module,under a given parameter setθ=[T1,T2,T3,A,B,γ1,γ2],the functionμ(T,θ)in Fig.2 will be represented by the following mathematics model:
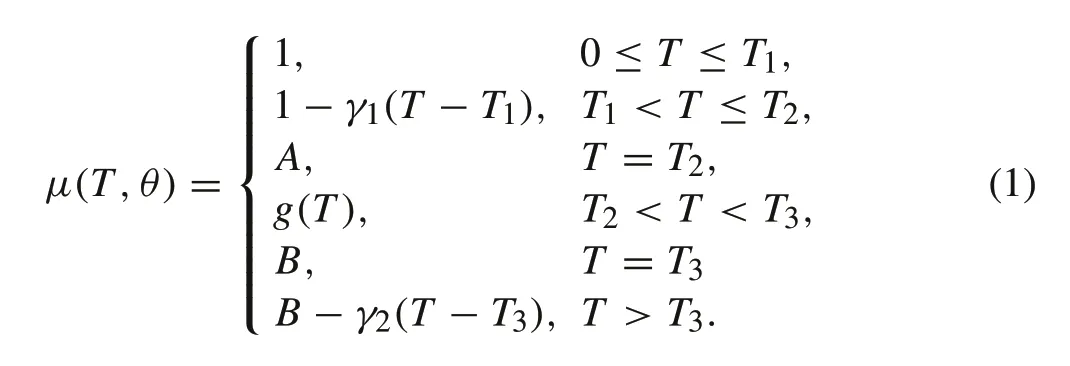
For the functionμ(T)to be continuous,

In this paper, the functiong(T) is a spline fitting, satisfying the boundary conditions:g(T2) =A,g(T3) =B.For example,a simple straight line interpolation is

But other smoother spline curve fittings can also be used.
The capacity retention curve in Fig.2 is affected significantly by several factors. The most significant factors are temperature,C-rate,and SOC operational ranges during battery usage.Typically,the higher the operational temperature is,the faster the capacity loss process becomes;the higher the charge/discharge C-rate is used, the faster the battery ages;the wider the SOC ranges are,the faster the battery deteriorates.
On the other hand, battery cells are highly non-uniform in their aging processes.Even under exactly the same operating conditions, many cells demonstrate a wide range of variations in their SOH dynamics. As a result, in studying system-level SOH, it is necessary to treat battery systems in a stochastic framework with random parameter vectorθ. In other words, the characteristic parameter setθ=[T1,T2,T3,A,B,γ1,γ2]is unknown and stochastic.
Example 1Consider a battery system that consists ofn=100 modules,with rated voltage 24(V)and rated new maximum capacityQ=100(Ah).The modules are grouped into four(m= 4)strings of 25 modules each(n1=n2=n3=n4= 25). As a result, the battery terminal rated voltage is 600 (V) and system-level rated capacity is 400 (Ah). This amounts to a battery system of energy capacity 240 (kWh)when it is new.A 1C charge for the entire battery system is 400(A),but in normal and idealized operation it is equally distributed to be 100(A)for each string.
Each battery module has unknown aging characteristic parameter set

depicted in Fig.2.For this study,we assume that the ranges of the parameters are as defined in Table 1.
Since battery aging processes are stochastic, we assume that such processes are independent and identically distributed(i.i.d.).Prior to simulations,for each battery module,its parameter set is selected randomly and independently with uniform distributions in the ranges of Table 1.Itsθvalue is then fixed without further alternation in simulation.
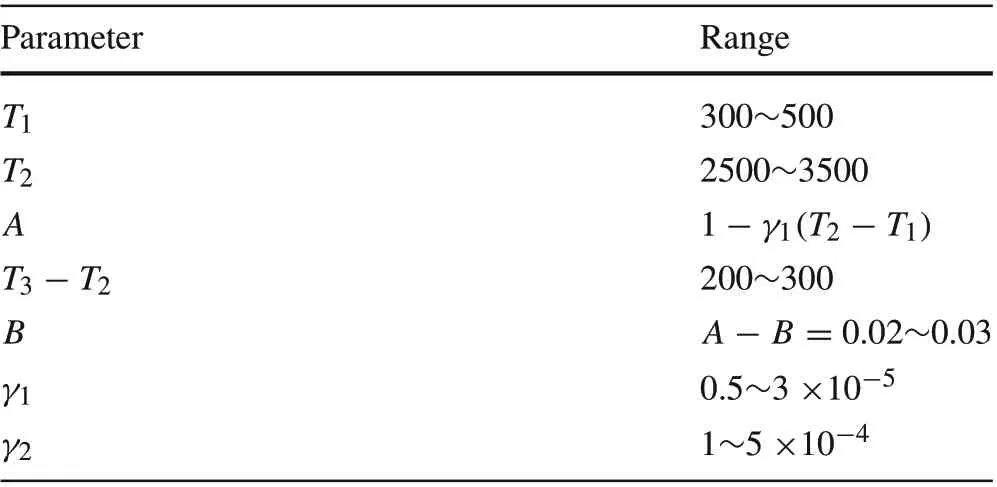
Table 1 Parameter ranges
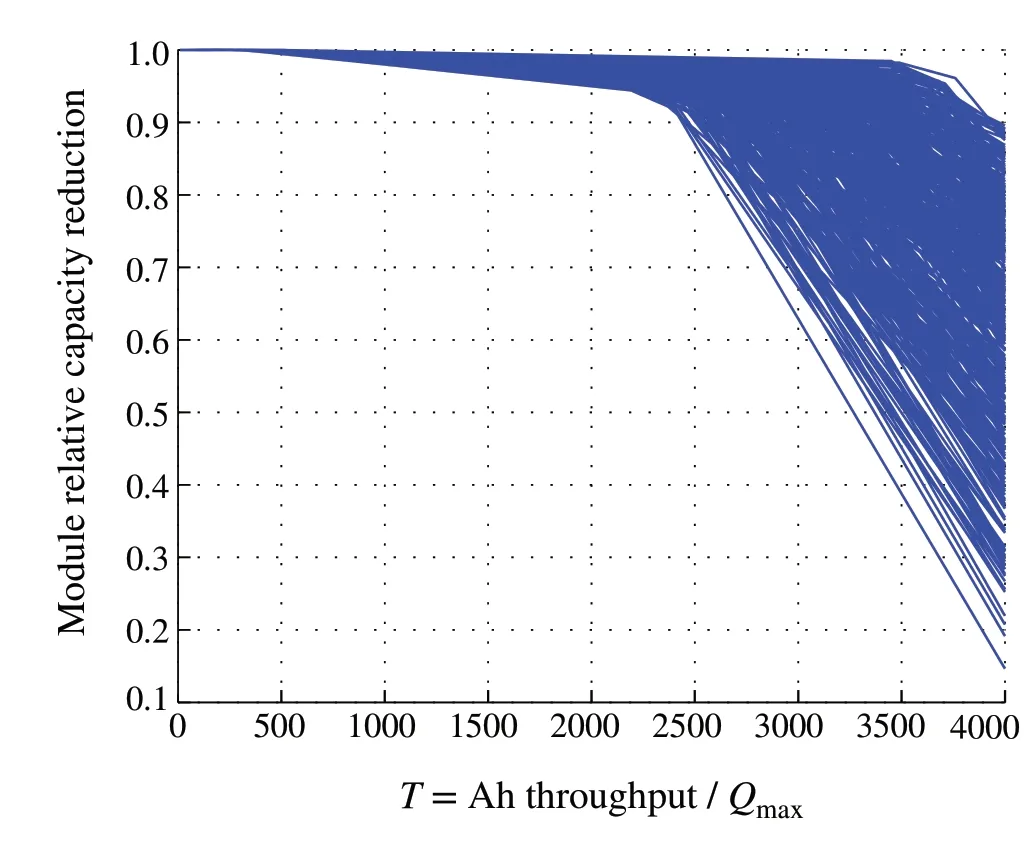
Fig.3 Randomly generated 100 battery aging curves for this case study
The initial capacity values are all equal to the rated capacity 100(Ah).The aging curves are derived using(1)with

Figure 3 demonstrates a sample of the 100 aging curves generated randomly by our simulation program.
4 System-level SOH analysis
4.1 Capacity efficiency
Due to uneven aging processes and dependence of battery SOH on stochastic environment conditions, the capacityQij(T)of thejth module in theith string afterTthroughput is a stochastic process.Let the capacities of the battery modules in theith string be denoted byQij(T),j= 1,...,ni,and define

which are also stochastic processes.
Assumption 2For a giveniand at the givenT,thenirandom variables{Qij(T),j= 1,...,ni}are independent and identically distributed(i.i.d.)with probability density function(PDF)f(x)and cumulative distribution function(CDF)F(x).
In our analysis,we will start using the accurateSOCvalues in our capacity efficiency analysis.Let the SOCs of the battery modules at timetof a discharge operation be denoted by
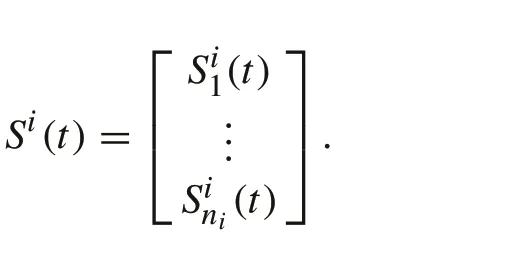
Suppose that one starts fromSi(0),with possible unequal initial SOC values among the modules.
Suppose that the battery string is discharged with the currentI(t). When any module reachesSmin, the discharge process must stop.
Theorem 1
1.The maximum discharge time τi for the ith string satisfies

2.The ending SOCs of the modules in the ith string are

3.Suppose that all modules are fully charged before discharge.Then τi satisfies

and the ending SOCs of the modules are

Proof(1) For thejth module in the string,its dischargeable electricity before reachingSminisQij(T)(Sij(0)−Smin).It follows that the discharge time is determined by the minimum dischargeable electricity,leading to(3).
(2) Each module has the same discharged electricity atτi,implying that
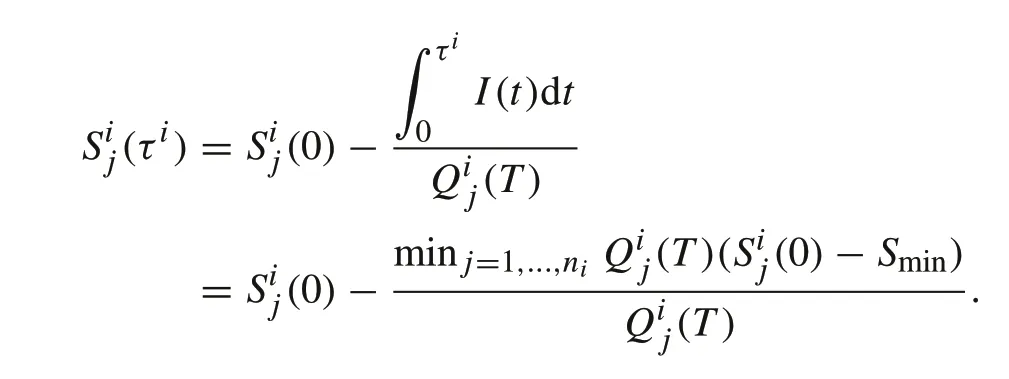
(3) In this case,we haveSi(0)=Smax11,where 11 is the vector of all 1s.Thenτiin(3)is simplified to(5).Similarly,the ending SOCs in(4)is simplified to(6).
■
Atτi,letbe the average voltage of the string.Then thetotal discharged energyfor the string is

Thetotal available energy, if total available electricity from all the modules att=0 is fully discharged,is

Theenergy efficiencyfor this string afterTis

Example 2For a numerical illustration, consider a battery system of 16 modules, that are divided into 4 strings with 4 modules in each string. All modules have uniform rated terminal voltage 12(V)and rated maximum capacityQ=50(Ah)when they are new.The battery system’s terminal rated voltage is 48(V)and system-level rated capacity is 200(Ah).This amounts to a battery system of rated energy capacity 9.6(kWh)when it is new.For safety,the SOC range is limited to[0.3,0.85],namelySmin=0.3 andSmax=0.85.
Suppose that after battery aging, the 16 modules have degraded capacities. Suppose that SOC variations are not considered.Table 2 lists capacity values and string capacity efficiencies.

Table 2 Battery capacities(Ah)after degradation and maximum capacity utilization
4.2 Capacity statistics
Since each module has its own aging process in which its capacity is a function of the random vectorθin (2), its capacityQij(T) is a stochastic process. Consequently, the quantities discussed in this section, including total usable energy, discharged energy, and energy efficiency are also stochastic processes.As a result,the energy efficiency must be defined in a stochastic framework.
Lemma 1Under Assumption 2,the maximum capacityax(T)has cumulative distribution function
Fmax(x)=F(x)ni,
and the minimumin(T)has cumulative distribution function
Fmin(x)=1 −(1 −F(x))ni.
ProofSinceax(T)andin(T)are the largest and smallest of a set of i.i.d.random variables,they are special cases of the order statistics[19].The expressions of the accumulative distribution functions are then obtained from the order statistics. ■WhenF(x) is known, the conclusions of Lemma 1 can be used to compute the expectation and variance ofax(T)andin(T).Since the results of this paper are related only toin(T),we will present a detailed analysis on its expectation and variance.For the common uniform distribution in battery capacity aging analysis,we can derive the following expressions.
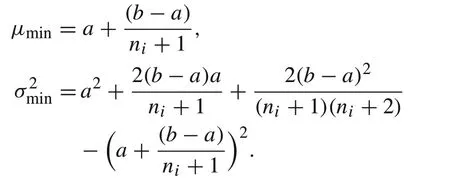
Theorem 21.Suppose that(T)is uniformly distributed in the range[a,b].Then the mean μmin=Ein(T)and variancein=E(in(T)−μ)2ofin(T)are
2.For large ni,

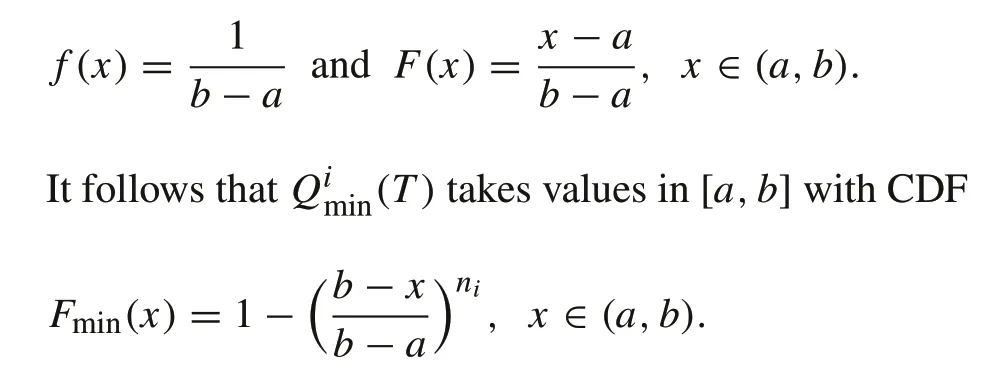
Proof(1) For the uniform distribution,the probability density function and the cumulative distribution function are given by
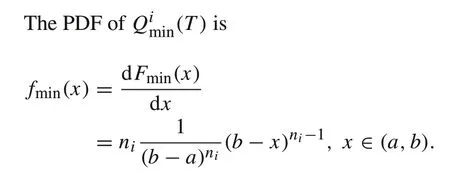
As a result,
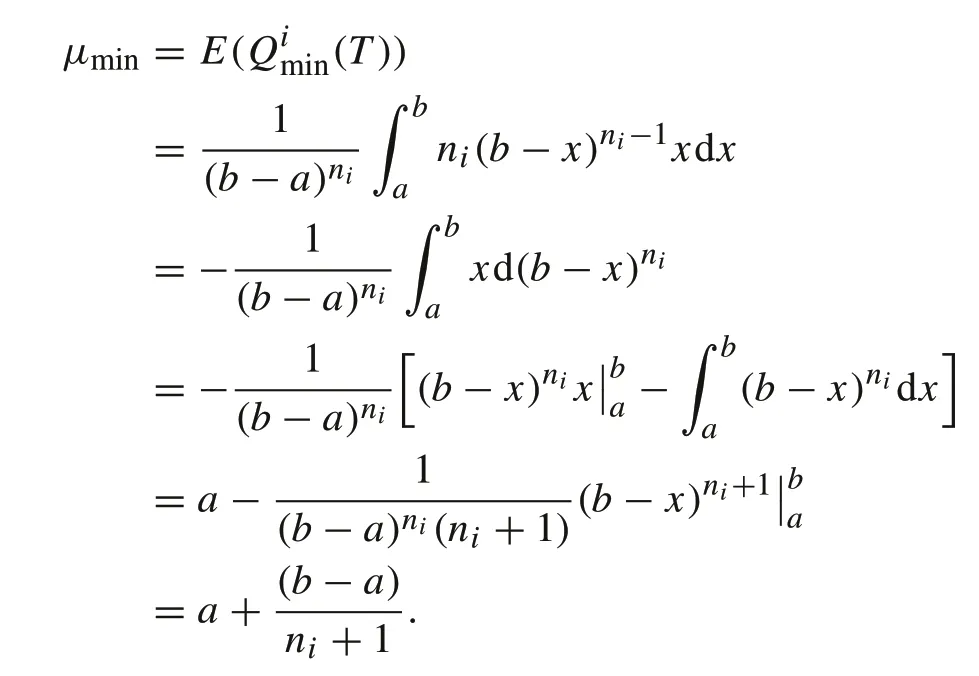
Furthermore,
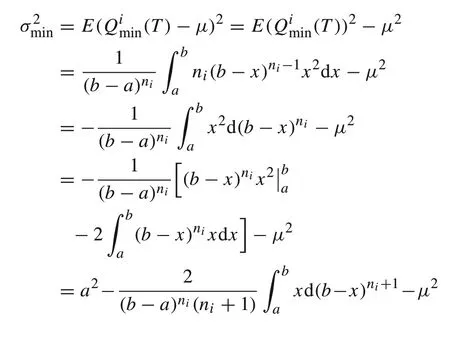
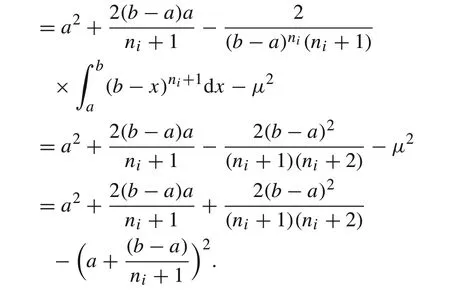
(2) These limits are the direct results from the expressions ofμandσ2,
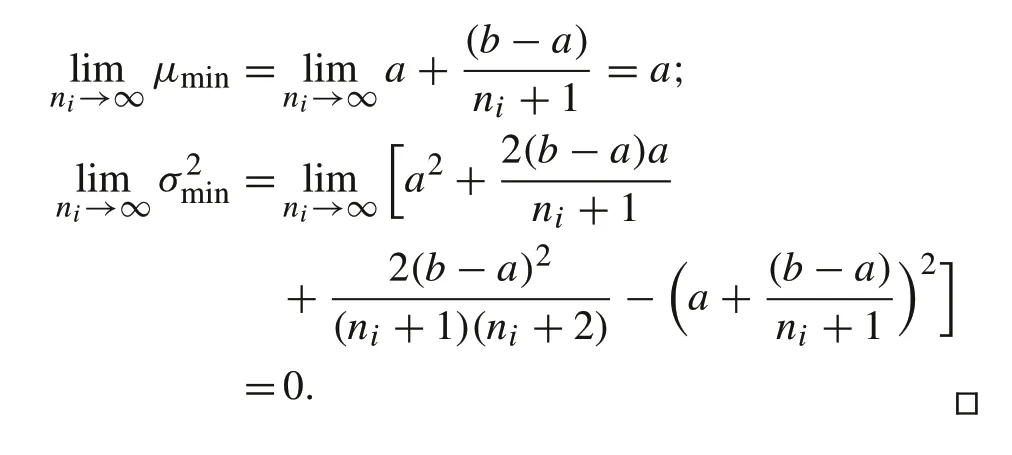
Theorem 2 Part 2 means that for large strings, the minimum capacity is always close to the lower boundain mean-square. Since smallerin(T) in (7) implies lower capacity utilization, this conclusion indicates that for large strings, the capacity utilization ratio is always close to the worst-case scenario without management.
Consider now the average capacity in a string(T)) =
Corollary 1
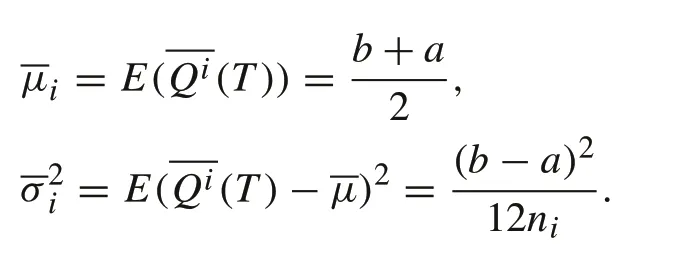
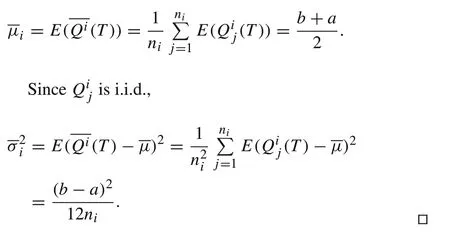
ProofIt is noted that the sample averageQi(T)is the average ofnii.i.d.uniformly distributed random variables,As a result,it has the expectation and variance
5 Impact of SOC management on capacity utilization
Since the SOC of a module cannot be directly measured,it is either estimated by certain SOC estimation algorithms or simply replaced by the measured battery voltage.In both cases,SOC estimation errors occur.
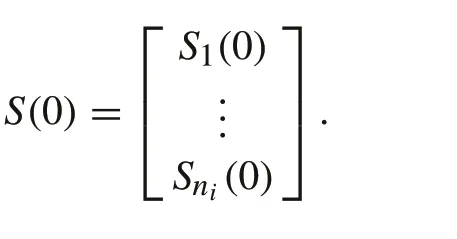
During battery operation, SOCs of battery modules become uneven, which in turn reduce capacity utilization.Suppose that at the starting timet=0 of discharge the SOCs are
Theorem 31.When the initial SOC values are not equal,the capacity utilization is reduced from ηi in(7)to

2.If the minimum capacity module also has the lowest starting SOC,then


Since discharge must stop when one module reaches its lower limit,the string discharge time is
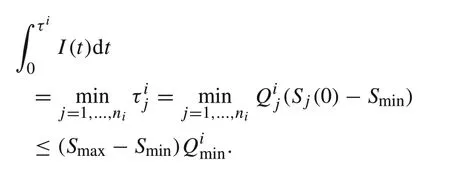
It follows that the total discharged energy is

and the actual capacity utilization is
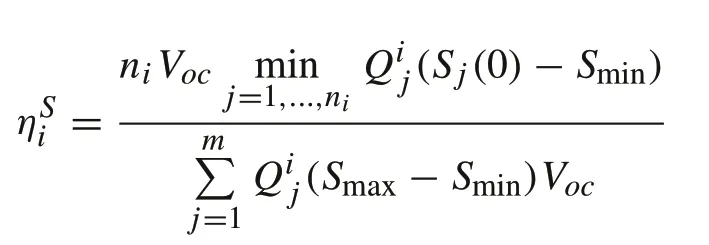

Table 3 SOC imbalance on maximum capacity utilization

(2) In the worst-case scenario, when the minimumcapacity module has the lowest SOC,arg minj=1,...,ni Qij=arg minj=1,...,ni Sj(0).When this scenario occurs,the lowest capacity utilization occurs withExample 3Impact of SOC imbalance on capacity utilization can be numerically demonstrated using the data in Example 2.We will use the first string as an example.For this string,Qmin=38 and=43.25.

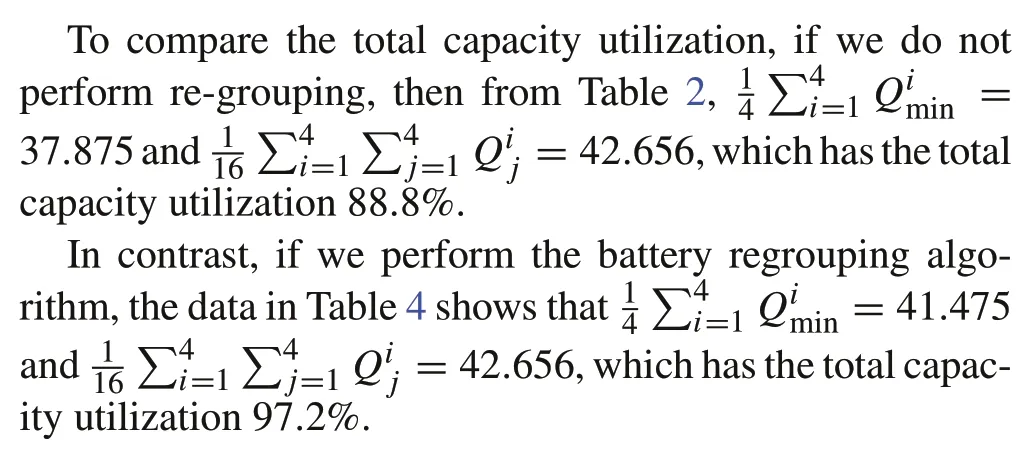
Suppose that for this string, there are 10% variations of SOCS(0) belowSmax= 0.85. We assign randomly such SOC deviations to the four battery modules in Table 3.These values result in minj=1,...,4Q j(Sj(0) −Smin) = 19.874,(Smax−Smin)=23.79,which reduces the string capacity utilization from 90%to 83.5%.
6 Battery regrouping
6.1 System-level SOH
During operation, the actual usable capacity at a givenTcan be estimated, using data points on the SOH valuesQ(T)/Qmax.Estimation of SOH is beyond the scope of this paper. Instead, we will assume that such data are available for our efficiency analysis and battery regrouping strategies.
Individual aging features of battery modules in a string define collectively the SOH dynamics of the system-level SOH.Consequently,when modules lose capacity gradually,the total capacity utilization of the string will deteriorate.
Under the assumption of uniform OCVs, identicalSminandSmax,and equal distribution of the total charge/discharge current to strings,the total usable energy of the entire battery system is


Table 4 Improvement of maximum capacity utilization by regrouping

In the special case thatnandmare fixed,n/m=ℓis an integer, and each string has the same numberni=ℓof battery modules,the energy efficiency(8)is simplified to

6.2 Optimal battery regrouping
The energy efficiency(8)depends critically on how the battery modules are grouped. We now introduce a regrouping algorithm by sorting battery modules on the basis of their capacity values.
Battery regrouping algorithm:
1.H1={Q1,...,Qn}.
2. Fori=1,...,m,selectGito be the set ofkmodules of the smallestQvalues inHi.
3.Hi+1=HiɵGi.
The following theorem shows the optimality of the regrouping algorithm of battery modules.
Theorem 4Suppose that n and m are fixed,n/m=ℓ is an integer,and each string has the same number ℓ of battery modules.Then the battery regrouping algorithm is optimal in the sense of achieving the highest energy efficiency.
ProofThis is proved by induction.Suppose that for a givenHi,is the optimal energy that can be used by grouping withinHi.Note thatis monotone non-increasing if one battery module inHiis replaced by a module of smaller capacity.
Now, suppose that from the givenHi,Giis selected by the battery grouping algorithm.ThenHi=Hi+1⊕Gisuch that for anyQa∈Hi+1and anyQb∈Gi,we haveQa≥Qb. Suppose we exchangeQa∈Hi+1andQb∈Giwith
the used energy for the newGicannot increase.Since this is valid for alli,by induction,the battery regrouping algorithm is optimal. ■
Example 4We now use the data in Example 2 to show the benefits of regrouping.Suppose that for the group of battery modules in Table 2, we now apply the battery regrouping algorithm. The resulting new strings and the string energy efficiencies are shown in Table 4.
6.3 Discussion on maintenance scheduling
The statistical analysis of capacity utilization of a given set of battery modules introduces a stochastic processη(T).According to the capacity utilization expression (9),η(T)is a random process that is a function of the aging processes(T)of the battery modules.Regrouping is a decision variableβ(T):β(T)=1 means a regrouping is implemented atT;andβ(T)=0,otherwise.It follows thatη(T)becomes a function ofβ(T)as well,denoted byη(T,β(T)).
Without regrouping(i.e.,β(T) = 0),η(T,0)is continuous atT.On the other hand,if a regrouping is implemented,a jump inη(T)occurs,with after-regroupingη+(T,1)larger than the before-regroupingη−(T,1).The efficiency gain isδ(T)=η+(T,1)−η−(T,1).This efficiency gain carries a benefit,over a certain future horizon of battery operation,that can be represented by the positive and monotone increasing benefit functionB(δ(T))>0.On the other hand,regrouping incurs a costC.
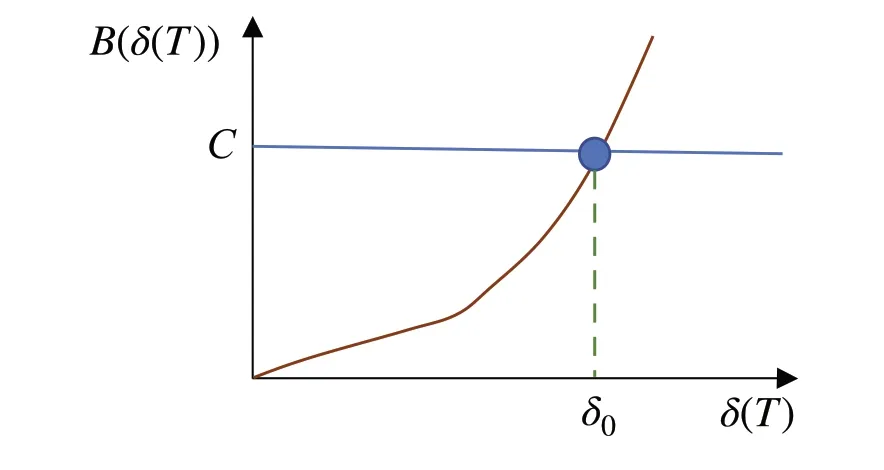
Fig.4 Maintenance decision point computation
Consequently,the regrouping decision can be formulated as a weighted multi-objective optimization problem

The actual predicted/estimated benefit functionB(·)and the valueCare application specific. Since this is a binary decision process,the decision point is calculated as a thresholdδ0of the efficiency benefit, shown in Fig.4. Then the maintenance decision becomesβ(T) = 0, ifδ(T) ≤δ0;β(T)=1,ifδ(T)>δ0.
The following example illustrates how the jump in capacity utilizationδ(T)can be calculated.
Example 5Consider the battery system in Example 1. We start with the scenario of battery operation without regrouping.The 100 battery modules with random aging characteristics are grouped into four strings of 25 modules each.Without any regrouping, the top plot of Fig.5 shows the maximum capacity utilization of the strings.Since the capacity utilization of a string is highly dependent on capacity variations within the string,over time when battery aging takes effect,the capacity utilization becomes substantially reduced.This leads to substantial loss of energy efficiency for the entire battery system,illustrated in the bottom plot of Fig.5.
On the other hand,if we apply the battery regrouping algorithm, the capacity utilization of the entire battery system can be significantly improved. Figure 6 compares capacity utilization trajectories of three scenarios: no grouping,regrouping everyT=1000,and regrouping everyT=500.Efficiency improvement atT=4000 isη=0.4581 without regrouping;η=0.6857 when regrouping is applied at everyT= 1000 interval;η= 0.7748 when regrouping is applied at everyT=500.
In terms of the total available energy(Wh)afterToperation range,Fig.7 demonstrates how much available energy actually cannot be used under different grouping strategies. Similarly, Fig.8 shows how much available battery energy is unused due to Battery regrouping issues.Over the totalT= 4000 operation range, the total available battery electricity amounts to 3.5550 (MWh). Without battery regrouping, the actual usable energy is only 3.1935 (MWh),a loss of battery energy capacity 0.3615 (MWh). In comparison,if the battery system is regrouped everyT= 1000 range,3.4015(MWh)is realized with a much lower loss of 0.1535(MWh).Further improvement is shown with regrouping everyT= 500 range, with 3.4258 (MWh) realized energy and a further reduced loss to 0.1292(MWh).
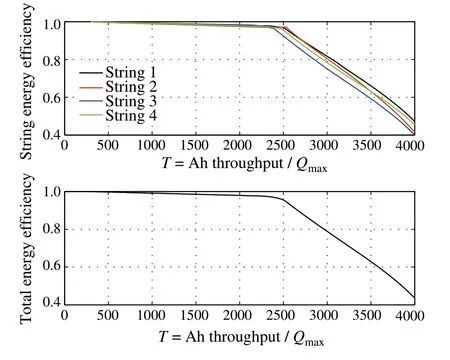
Fig.5 Capacity utilization trajectories of the four strings and the entire battery system. Top Plot: The energy efficiencies of the four strings.Bottom Plot:The capacity utilization of the entire battery system
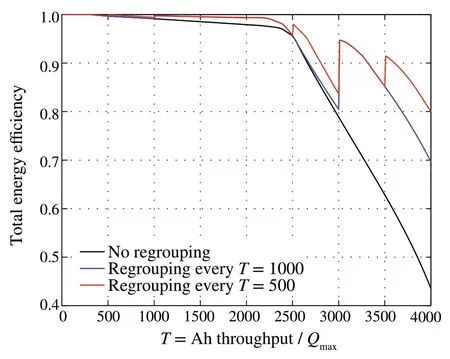
Fig.6 Capacity utilization improvements of the entire battery system using regrouping at different intervals
6.4 Discussions on hardware realization
Implementation issues were discussed in [18]. For selfcontainment,we reproduce the contents here.
“Battery regrouping can be achieved by manually reassigning battery modules to different strings as a maintenance procedure, or by designing electric switches to reconnect battery modules without moving them physically,or by employing suitable power electronic circuits that can change networking structures of battery modules.Fig.9 illustrates a conceptual scheme for such a reconfiguration system.
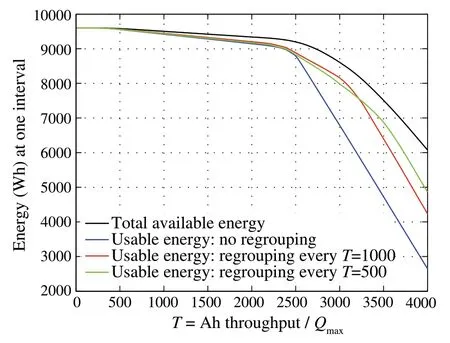
Fig.7 Comparison the total available energy(Wh)of the battery system after T operating range with the actually usable energy due to different strategies of battery regrouping
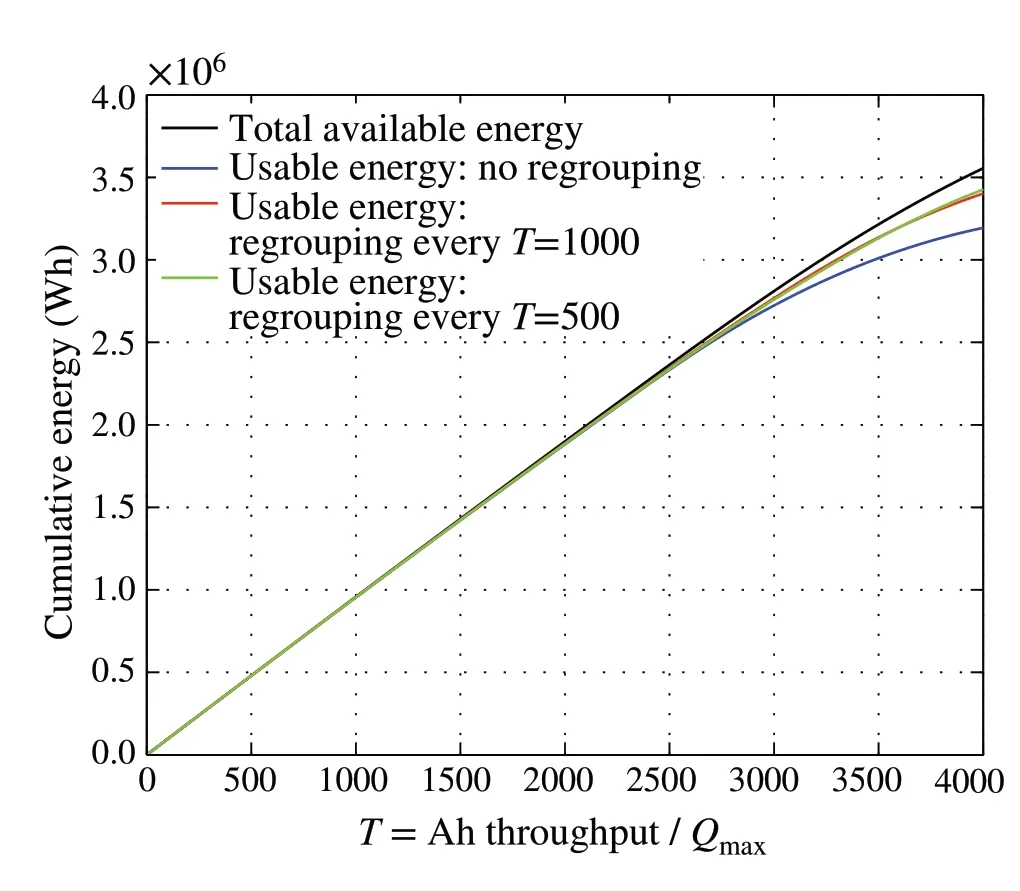
Fig.8 Comparison the total cumulative available energy (Wh) of the battery system within T = 4000 with the actually usable cumulative energy due to different strategies of battery regrouping
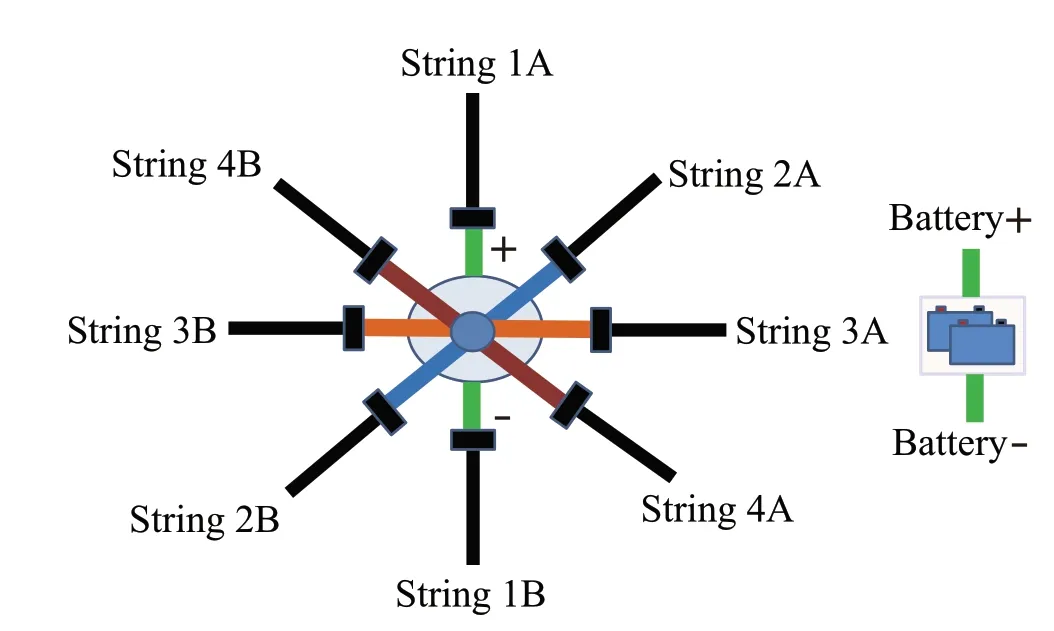
Fig.9 A functional scheme for battery module reconfiguration
In this scheme,illustrated with four strings,each battery module can be freely assigned to any string.If it is assigned to String 1,then all other strings will be automatically disconnected from this module.Since group reorganization occurs only periodically over a relatively long time,such switches may offer simplicity,low cost,and low power loss.”
7 Illustrative case study
In this section,we illustrate the main issues and methods of this paper by using real-world battery systems.
Example 6This case study uses real-world battery aging data to demonstrate the importance of battery regrouping.To validate the proposed battery reconstruction method,a pack of 95 battery cells that were used in an electric vehicle for three years were tested for their aging processes.The battery pack was rated 18.5 (kWh) and operated under air cooling. The packconsistsofprismaticbatterycellswithLiFePO4cathode and graphite anode,rated voltage 3.2(V)and rated capacity 60(Ah).The battery protection circuit has charging cut-off voltage 3.65(V)and discharging cut-off voltage 2.5(V).
The battery pack test platform consists of an Arbin BT2000 battery test system, a battery management system and a temperature sensor. Among them, the Arbin BT2000 battery test system was used to charge and discharge the battery pack. The battery management system was used to collect the voltage of all battery cells in the battery pack,and the temperature sensor was used to monitor the temperature of the battery pack during the test. The battery pack was placed at thermostat to be kept in a specified temperature environment.The battery pack was first charged under the constant-current–constant-voltage charging regime,and then fully discharged at constant current to obtain the capacity.The battery pack was then disassembled into single cells to evaluate the inconsistency of the battery pack. The cell capacities and internal resistances were obtained through serial experimental procedures.
For a suitable comparative analysis of the regrouping methods in this paper,the first 88 cells in the original order were selected.The cells are first divided into 4 string of 22 cells each,according to the original order without regrouping.The rated string voltage is 3.2×22=70.4(V).
The capacities of the selected cells after the 3-year aging process are listed below.
String 1(#1 −#22):
52.08,50.47,50.33,50.94,50.91,51.09,
49.39,52.10,50.21,47.71,50.76,
47.12,49.37,49.80,50.96,50.09,50.87,
50.25,49.56,49.81,50.57,50.50;
String 2(#23 −#44):
49.43,50.11,48.45,49.98,48.15,49.62,
49.79,48.62,51.08,49.51,48.07,
47.56,48.81,48.54,44.23,48.46,47.21,
49.51,50.70,48.14,49.21,47.86;
String 3(#45 −#66):
50.53,49.78,51.37,50.44,50.37,49.14,
50.59,49.69,50.83,50.35,50.63,
50.13,49.61,50.60,51.19,49.69,50.98,
50.15,52.13,48.89,50.60,47.63;
String 4(#67 −#88):
47.44,49.91,49.97,49.81,47.96,48.99,
50.16,50.95,48.47,48.36,48.73,
46.55,49.03,47.67,50.68,46.80,49.65,
49.23,49.20,45.77,45.71,45.57.
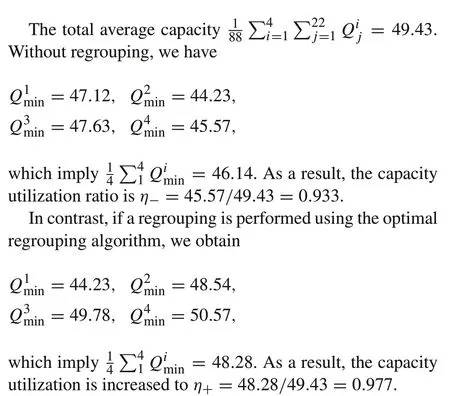
The efficiency improvement amounts to the additional energy(48.28−46.14)×4×70.4=602.62Wh,which can be used for battery operation in one charge/discharge cycle.
8 Concluding remarks
This paper introduces notions of battery capacity utilization that capture the impact of uneven battery capacities on the system-level energy usage and the lost capacity.Mathematics analysis establishes relationships between individual battery modules’ aging processes and the system-level SOH, that indicate potential remedies for improving capacity utilization of the entire battery system.Optimal battery regrouping methods are introduced.
This paper has left several important topics that are of interest for further methodology and algorithm development and for practical applications. First, the statistical analysis methods of this paper are based on operational data for extraction of probability distribution information.This paper does not cover the topic of data acquisition and estimation of distribution functions in battery applications.Second,the main theme of this paper is to establish a statistical foundation for rigorous analysis of battery energy efficiency in the life spans of battery systems and for development of enhanced battery management strategies in practical applications. Due to diversified application aspects of battery systems, actual regrouping strategies must be adapted to specific applications.Third,costs and maintenance time for battery regrouping depend on specific applications.It will be highly interesting to explore the types of battery systems for which the methods of this paper are uniquely useful.Furthermore, although some conceptual hardware systems for realizing battery regrouping are discussed in this paper,the actual design and costs on physical switches or power electronic circuits remain open issues. Finally, it is also important to combine real-time SOC and SOH estimation and the regrouping process so that comprehensive real-time battery management methods can be developed to further improve battery system efficiency and durability.
杂志排行
Control Theory and Technology的其它文章
- Design of semi-tensor product-based kernel function for SVM nonlinear classification
- Non-iterative Cauchy kernel-based maximum correntropy cubature Kalman filter for non-Gaussian systems
- Strong observability as a sufficient condition for non-singularity and lossless convexification in optimal control with mixed constraints
- Cooperative distributed state estimation:resilient topologies against smart spoofers
- Bipartite consensus for nonlinear time-delay multiagent systems via time-varying gain control method
- Discrete-time sliding mode control with power rate exponential reaching law of a pneumatic artificial muscle system
