Seismic fragility analysis of bridges by relevance vector machine based demand prediction model
2022-01-21SwarupGhoshandSubrataChakraborty
Swarup Ghosh and Subrata Chakraborty
Department of Civil Engineering, Indian Institute of Engineering Science and Technology, Shibpur, Howrah 711103, India
Abstract: A relevance vector machine (RVM) based demand prediction model is explored for efficient seismic fragility analysis (SFA) of a bridge structure. The proposed RVM model integrates both record-to-record variations of ground motions and uncertainties of parameters characterizing the bridge model. For efficient fragility computation, ground motion intensity is included as an added dimension to the demand prediction model. To incorporate different sources of uncertainty, random realizations of different structural parameters are generated using Latin hypercube sampling technique. Mean fragility, along with its dispersions, is estimated based on the log-normal fragility model for different critical components of a bridge. The effectiveness of the proposed RVM model-based SFA of a bridge structure is elucidated numerically by comparing it with fragility results obtained by the commonly used SFA approaches, while considering the most accurate direct Monte Carlo simulation-based fragility estimates as the benchmark. The proposed RVM model provides a more accurate estimate of fragility than conventional approaches, with significantly less computational effort. In addition, the proposed model provides a measure of uncertainty in fragility estimates by constructing confidence intervals for the fragility curves.
Keywords: bridge structure; seismic fragility analysis; seismic demand model; relevance vector machine
1 Introduction
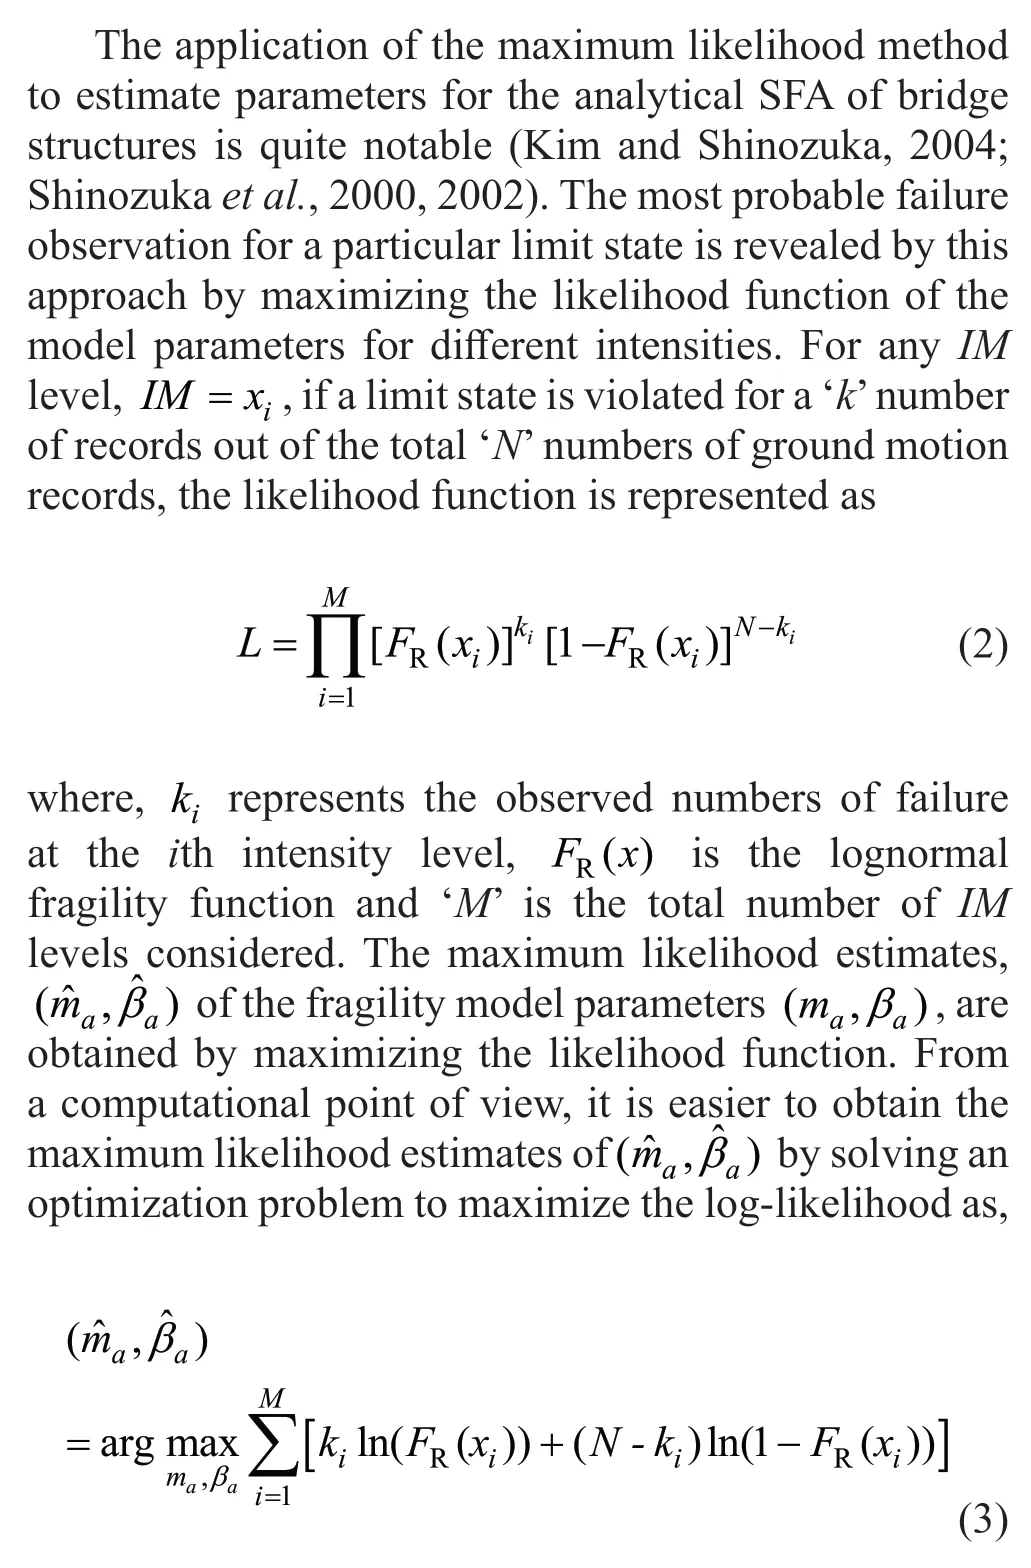
Highway bridges are an important part of a transportation network and the most vulnerable component in the network under seismic excitations.Damage to bridges not only disrupts transportation facilities but also limits post-earthquake disaster management by restricting the movement of vehicles and disaster relief operations. Because of these factors,the seismic safety assessment of bridges has received significant research attention. Such assessments are generally rooted in the probabilistic evaluation of vulnerabilities of different components while considering various sources of uncertainties present in the system. Seismic fragility analysis (SFA) in the probabilistic performance-based earthquake engineering(PBEE) framework is the most viable tool in this regard.The fragility curves are developed by SFA; the curves provide the probability of exceeding various damage states in a structural system for varying levels of ground motion intensities. In current state-of-the-art knowledge,bridge fragility curves are constructed mainly through the use of three approaches, i.e., (i) based on damage data from past events, (ii) based on expert opinion and (iii) using numerical simulation-based approaches(Chenget al., 2019). Fragility curves based on damage data are expected to provide a more reliable estimate of fragilities. However, a sufficient amount of damage data for a particular type of bridge model may not always be available. Fragility results based on expert opinion are always sensitive to subjective judgments. Thus, the SFA-based approach, with numerical simulation in the framework of probabilistic PBEE, is the most viable alternative (Maranoet al., 2011). The present study deals with a numerical simulation-based SFA for highway bridges.
The developments on the numerical simulationbased SFA for bridge structures are remarkable (Dueñas-Osorio and Padgett, 2011; Maranoet al., 2008; Nielson and DesRoches 2007; Raffaeleet al., 2014; Songet al., 2019; Tolentinoet al., 2020; Wanget al., 2012;Xiaet al., 2021). The most accurate and conceptually straightforward method of SFA is based on the direct Monte Carlo simulation (MCS) technique. However,the accuracy of the direct MCS-based approach chiefly relies on a large sample size (Gaxiola-Camachoet al., 2018; Kefayatiet al., 2020; Kwon and Elnashai,2006). Performing several thousand nonlinear time history analyses (NLTHA) on the various replications of structures require enormous computational time. To circumvent this, regression-based approaches to estimate seismic demands have gained attention (Bakhshinezhad and Mohebbi, 2021; Ghoshet al., 2018; Jeonet al.,2019; Maikol Del Carpioet al., 2017; Seo and Linzell,2013; Tsompanakiset al., 2008). The regressions-based seismic demand model can be readily used, based on responses obtained from a limited number of NLTHA runs. Thus, the fragilities of real structures can be estimated with a lesser computational burden. The application of such approach to estimate the seismic fragilities of bridges is notable. For example, the power law relationship between median seismic demand and ground motion intensity (Nielson and DesRoches,2007) , support vector machines-based SFA of highway bridges (Mahmoudi and Chouinard, 2016), the artificial neural network-based SFA of prestressed and skewed concrete bridges (Cheng and Li, 2012; Mangalathuet al.,2018), and so on. It may be noted that such approaches require prior training in the models, taken from data, and the accuracy of such models largely depends on how well the model has been trained. Performing NLTHA for complex structures such as bridges requires considerable computational time due to the need to couple different nonlinear components. Hence, the number of NLTHA runs is limited in most cases. Thus, there will always be a lack of confidence in the estimated fragility, based on limited seismic responses. To this end, the Bayesian approach of SFA is found to be suitable, as the approach can provide a measure of uncertainty associated with the estimated fragilities.
In this regard, studies on regression-based fragility models in the Bayesian framework to provide confidence intervals on the fragility curve is notable(Box and Tiao, 1992; Gardoniet al., 2003; Gelmanet al., 2013; Koutsourelakis, 2010; Ramamoorthyet al.,2006; Singhal and Kiremidjian, 2002; Straub and Der Kiureghian, 2008). However, although the application of the approach to building structures is well known (Ghosh and Chakraborty, 2020; Gokkayaet al., 2015; Jalayeret al., 2015; Pujariet al., 2015; Xu and Gardoni, 2016), its applications to bridge structures seem to be scarce. The Bayesian approach in bridge vulnerability assessment is conventionally used for updating bridge fragility curves,with the addition of new data from experimental or numerical simulations. Gardoniet al.(2003) developed probabilistic deformation and shear demand models for RC bridges with single column bents, taken from experimental observation results that were updated using the Bayesian updating method, based on numerical simulation results. In subsequent studies, Zhonget al.(2008) extended the model for a two-column RC bents and Zhonget al.(2009) did so for bridge systems using the Bayesian updating method as taken from additional shake table tests data. The updated models are found to be more accurate, with reduced uncertainty, due to the addition of new data. However, this provides only a point estimate of fragility. Liet al.(2013) applied a twostep approach to improve the fragility estimate of a RC box girder bridge located near El Centro, California. The intial fragility curves generated by experimental data were updated using hybrid simulation data obtained from a numerical model of the bridge. The posterior modes of the model parameters were obtained to provide a point estimate of fragility. In recent studies, the application of Bayesian linear regression for a bridge fragility assessment is also notable. Jeonet al.(2019) developed parameterized fragility curves for a concrete box girder bridges curved-in plan using logistic regressions based on survival failure data obtained from a Bayesian linear regression-based response prediction model. This method integrates different sources of uncertainty. However, the computational requirement is high due to the requirement of calibrating different probabilistic models. Moreover,the amount of uncertainty in the fragility estimate cannot be measured by using this approach. Bayatet al.(2020)developed a Bayesian linear regression demand model for SFA for a concrete bridge pier by considering seismic intensity measures as the only predictor variable. The model incorporates only the record-to-record variation of ground motions by means of an incremental dynamic analysis (IDA) of the bridge model. The computational involvement utilized in the approach is significantly high due to the repeated scaling of accelerograme required for IDA. It has generally been noted that the existing studies have primarily focused on the improvement of the accuracy of bridge fragility assessment. However, the issues of accuracy and computational time have not been comprehensively addressed in most of these studies.Moreover, information on the amount of uncertainty present in the fragility assessment is not reflected in the generated fragility curves. Thus, a Bayesian framework that is used in a generic way to predict seismic demand for the fragility analysis of bridge seems to be significant, as this framework incorporates various types of randomness and addresses issues of accuracy and computational efficacy with regard to computing involvement.
The present study explores the relevance vector machine (RVM) based demand prediction model for efficient SFA for bridge structures. The RVM is a machine learning technique that uses Bayesian inference for regression and probabilistic classification(Tipping, 2001). Using a sparsity-promoting prior probability over the parameters of the model, the RVM attempts to select only the limited number of related basis functions that are only required to represent a model. The resulting sparsity in the dataset allows for more rapid computation of data for the fragility estimation. Additionally, the Bayesian framework provides a measure of uncertainty for fragility estimates.Thus, for complex nonlinear structures such as bridges,the application of RVM seems to be more convincing.The proposed RVM model considers both uncertainty causes due to record-to-record ground motion variations and randomness with regard to the characteristic of the model of the bridge, with a limited computational effort. The record-to-record variations are considered by preparing a suit of accelerograms compatible with the expected risk at the bridge location. These accelerograms are integrated into the RVM model by including seismic intensity as an additional parameter, along with structural parameters. Peak ground acceleration (PGA)is taken as the ground motion parameter, which is noted as the optimal intensity measure (IM) for bridges, taking into consideration efficiency, practicality, proficiency,sufficiency and hazard computability (Padgettet al.,2008). Thus, the response approximation is dependent upon the characteristic of the structure as well as seismic intensity. Structural parameter uncertainty is propagated by generating random realizations of the considered bridge from the probability distributions of the random structural parameters that characterize the bridge and combining them using Latin hypercube sampling (LHS).For different vulnerable components of the bridge, the mean fragility along with its dispersions are estimated based on the log-normal fragility model. Finally, system fragility is estimated from the available component fragilities. This approach also provides a confidence interval for the fragility curves that represents the amount of uncertainty present in the estimated fragility.The proposed RVM model is numerically elucidated for SFA for a typical highway bridge. The direct MCS-based fragility estimates are taken as the reference results for judging the effectiveness of the proposed approach.Due to the enormous computational time requirement for SFA for the entire bridge by employing the direct MCS technique, for the validation of the proposed approach, the SFA of a typical pier of a bridge system is considered first. Finally, a realistic three-dimensional representation of the considered bridge system is taken up to demonstrate SFA for a realistic bridge structure.
2 The proposed SFA of bridges
To investigate the efficacy of the present RVM model for fragility analysis, the SFA results of the present study are compared with fragility results estimated by the two most frequently used SFA approaches, namely, the power model and the maximum likelihood estimate. Thus,these two approaches are first briefly discussed in the following sub-sections before presenting the proposed RVM model-based approach of SFA.
2.1 SFA using the conventional power model
Analytical SFA for bridges is usually performed through a power law relation between median demand and ground motion intensity (Ghotbi, 2014; Nielson and DesRoches, 2007; Ramanathanet al., 2015; Zhanget al., 2008). It is based on a linear regression model that takes into account earthquake response and ground motionIMin the logarithmic domain. Based on these considerations, the component fragility is estimated as,

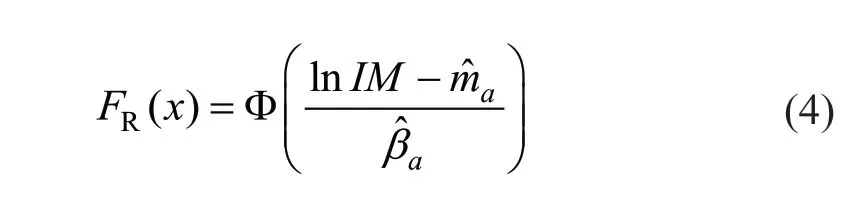
2.2 SFA using maximum likelihood estimates
Finally, the fragility is estimated as,
This method does not require a demand prediction model; rather, the fragility is estimated directly from the observed failure data. However, it may be noted that to obtain survival failure data for different components of bridge structures for varying ground motion intensities,the repeated scaling of ground motions at each of the considered intensity levels requires considerable computational time. This approach is referred as the‘likelihood’ method, as noted in further discussions herein.
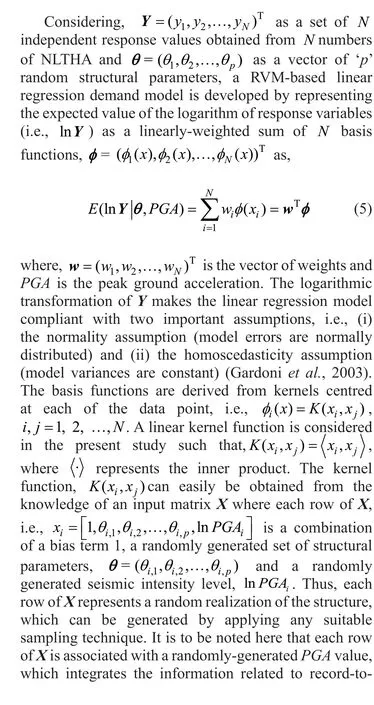
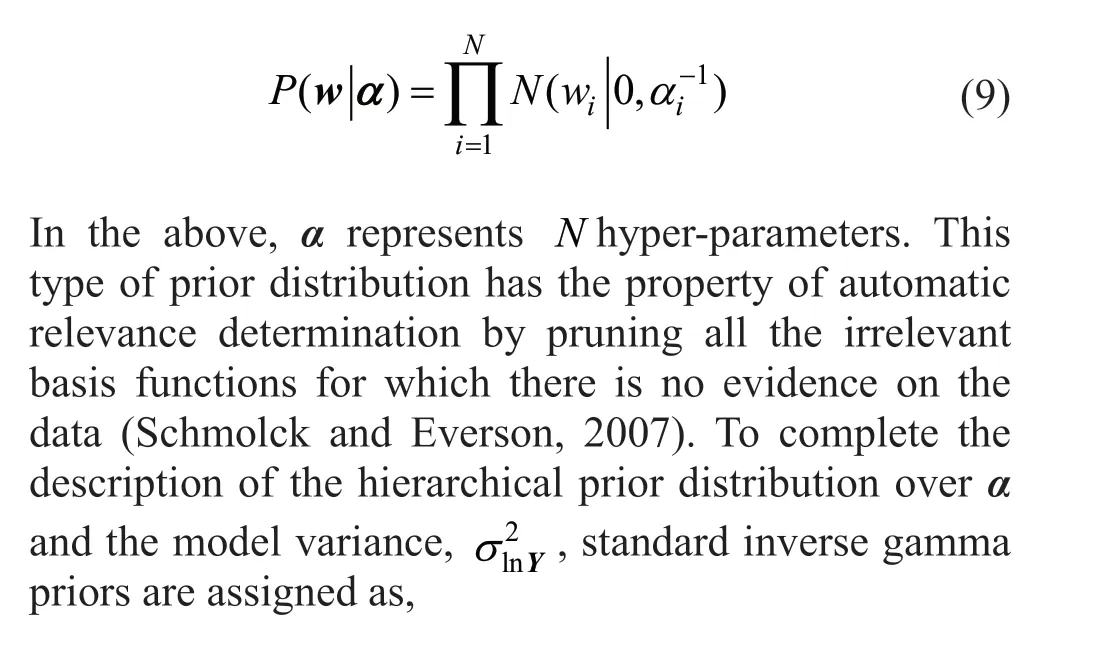
2.3 The proposed relevance vector machine-based demand model

To avoid over-fitting issues, the RVM constrains the model parameters by assigning an individual hyper prior over those. To do this, a Gaussian prior with a zero mean is defined as,


2.3.2 Mean fragility and its confidence intervals

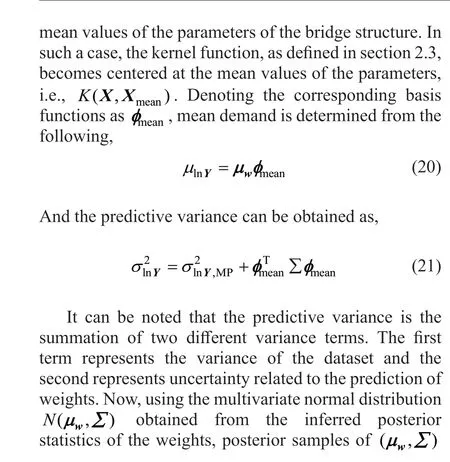

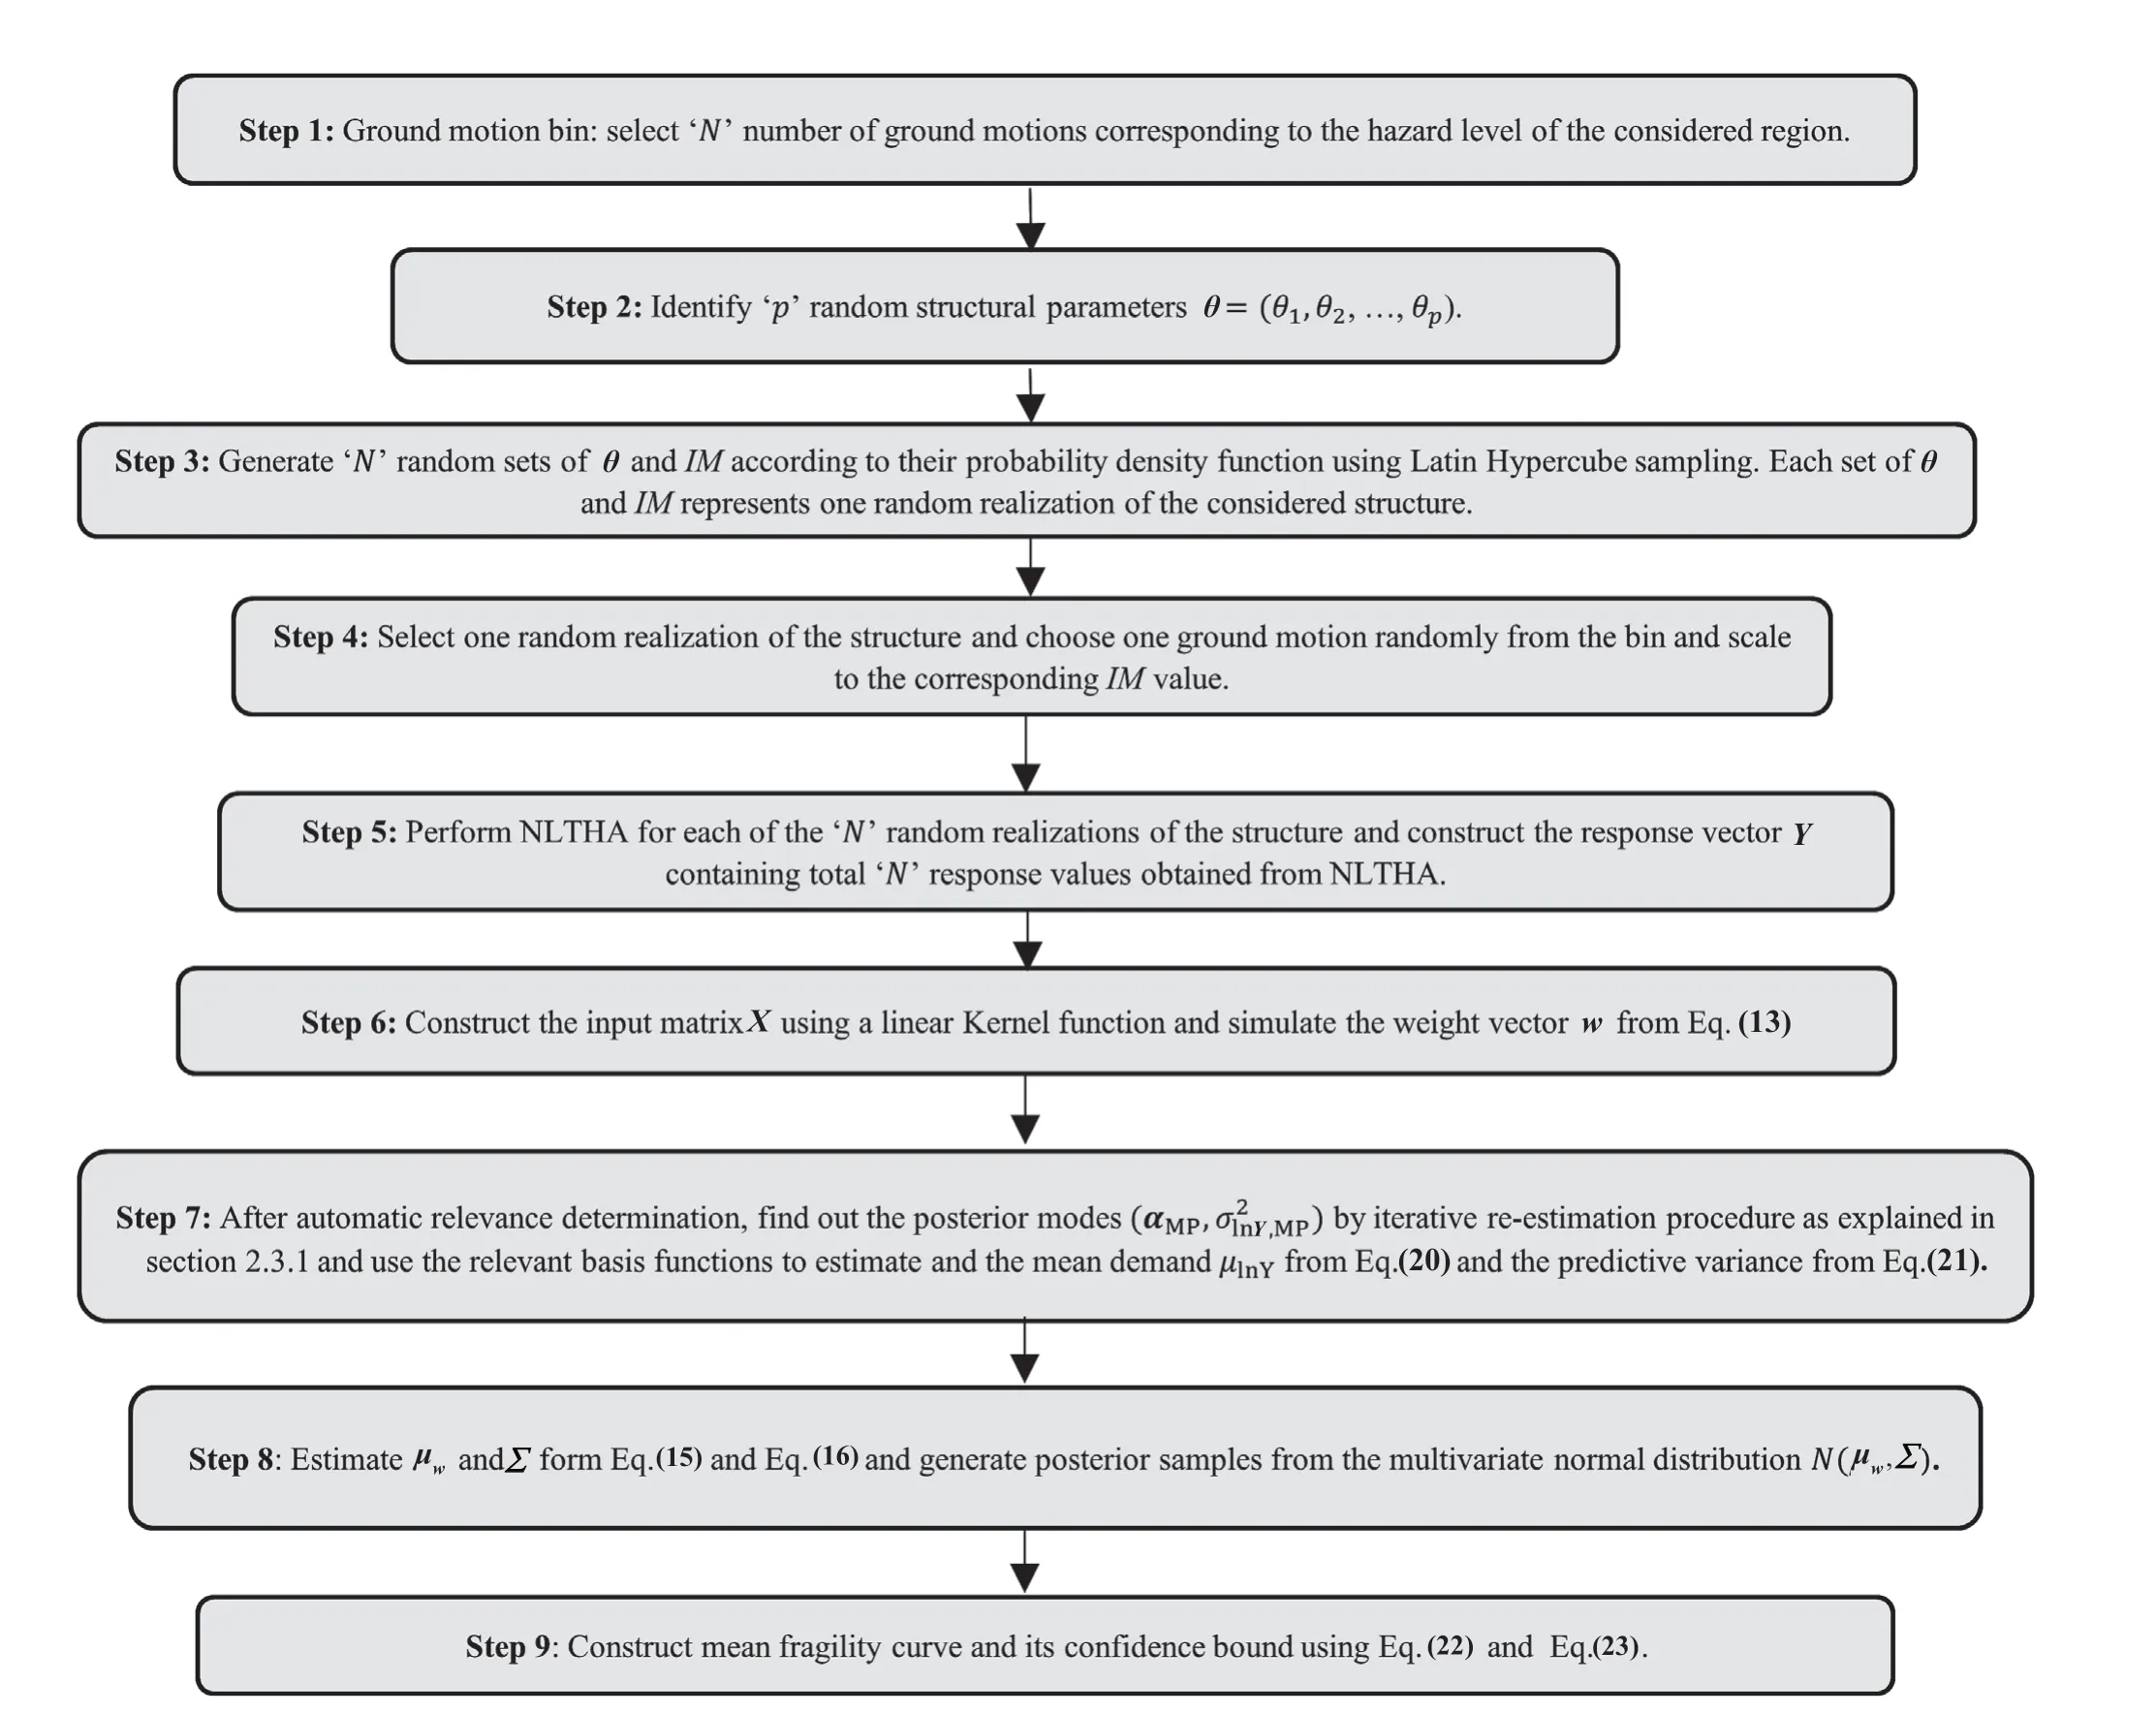
Fig. 1 Step-by-step procedure of SFA according to the RVM model
3 The ground motion suit
In the context of SFA of structures in the framework of PBEE, ground motion records are the most important parameter for the estimation of structural demands from NLTHA. In the PBEE framework, uncertainty related to record-to-record variation of ground motions is propagated through ground motion intensity parameters.The most acceptable source of input accelerograms is the recorded ground motions provided by a worldwide strong motion database. However, for a particular location and desired hazard level, there may not be sufficient recorded accelerograms available to perform a statistical study required for SFA in the PBEE framework. For such cases, the most viable alternatives are the generation of synthetic accelerograms from a stochastic simulation of fault rupture and a simulation of artificial accelerograms spectrally matched to a target spectrum for the location. In the present study, the bridge structure is considered to be located in Guwahati city in the northeast region of India, one of the major earthquake zones in the world. Due to the unavailability of sufficient numbers of recorded accelerograms for the study region,eight recorded accelerograms are selected from a strong motion database corresponding to the hazard level of the region. Further, to supplement this limitation, the ground motion database is augmented with a synthetic and artificial accelerogram. The stochastic point source model proposed by Boore (2003) is used to generate eight synthetic accelerograms. Further, eight artificial accelerograms are generated by a spectral matching technique considering the IS code (IS1893, 2016) that provides response spectra as the target spectra. Thus, the ground motion suit contains twenty-four accelerograms covering aPGArange of 0.1 g to 0.43 g, which are used for the NLTHA of the bridge structure. More about the generation of an earthquake acceleration time history for the location may be read in Ghosh and Chakraborty(2017).
4 Numerical Study
The example bridge structure considered in this study is a typical three-span, simply supported concrete highway bridge. The total length of the bridge is 45 m, with three spans of 15 m each. The bridge deck is supported on two intermediate piers and two seat-type abutments at each end. Each pier consists of three columns of 500 mm in diameter and 5 m high and are spaced at 4.2 m.The width of bridge deck is 11 m with 1.5 m-wide footpaths on each side. The girder system consists of four RC precast girders spaced at 3.667 m. Each column is supported on eight piles of 500 mm diameter and a 2.5 m× 2.5 m square pile cap. The girders are supported over a pier cap of 12 m length, 3.2 m width and 1 m depth.Each seat type abutment with a width 12 m is supported on a pile cap containing a 15 m × 4.5 m plan area. Each abutment pile cap is supported on 15 piles, each 500 mm in diameter. The concrete grade is considered as M35 and reinforcing steel grade as Fe500 (IRC21, 2000). The seismic design of the bridge is performed following the Indian Road Congress guidelines (IRC6, 2014; IRC21,2000). Figure 2 depicts the typical longitudinal section of the considered bridge.
To consider the effect of structural parameter uncertainties, twelve random structural parameters having significant influences on the seismic response of the bridge are identified. The statistical properties of the random parameters are depicted in Table 1. The ground motionIMparameter,PGAis also taken as random and assumed to be a uniform random variable over an intensity range of 0.1 g to 1.5 g. The probability distribution of the various uncertain parameters are adopted from Nielson (2005) and Jeonet al.(2019).
To understand the efficiency of the present RVM model-based approach of fragility analysis, the estimated fragilities obtained by the present RVM model are compared with those estimated by the usual cloud and the likelihood method. For this purpose, the fragility results obtained by the most accurate brute force MCS technique are considered as the reference results. As the direct MCS study involves enormous computational time due to the large number of repetitive NLTHA of the complete bridge, a typical pier of the bridge is considered first for the purpose of validation. The simplified twodimensional model of the considered bridge pier requires considerably less computational time for analysis and thus a large number of simulations can be performed within a reasonable amount of time, as required for the direct MCS-based SFA. This will enable an appropriate study of accuracy for the proposed approach. Finally,the SFA of the considered bridge employing a detailed analytical 3-D model of the bridge structure is performed to demonstrate the proposed RVM model-based SFA approach for highway bridges.
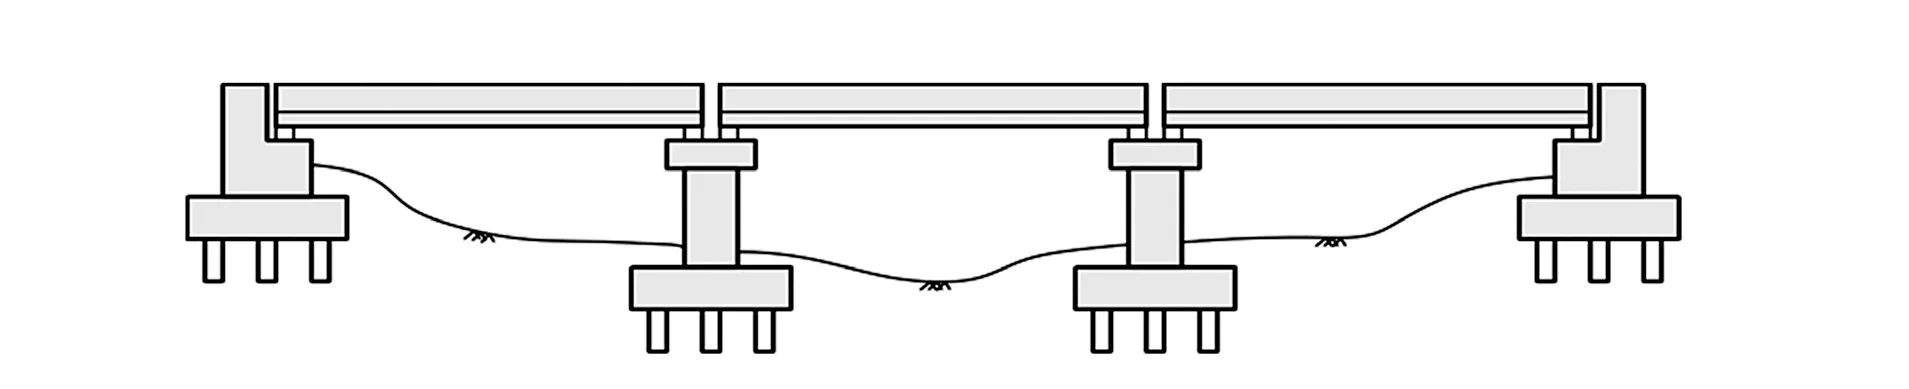
Fig. 2 The typical longitudinal profile of a bridge
4.1 SFA of a typical pier of the example bridge
The elevation of the considered bridge pier and the corresponding finite element model developed in the OpenSees (Mackie and Stojadinović, 2007) are shown in Fig. 3(a). The pier columns are modelled according to the distributed plasticity model, using displacementbased beam-column elements with fibre cross sections.The pier caps are also modelled with fibre cross sections using displacement-based beam-column elements.The fibre models of the beams and the columns are depicted in Figs. 3(b) and 3(c). For the core and cover concrete, the concrete04 and concrete01 models, which are available via OpenSees, are used. The reinforcing steel is modelled using steel02 material. To capture the spread of nonlinearity through different cross sections of the piers during vibration, the total length of the pier column is discretized into five segments and each segment is assigned five Gauss-Legendre integration points. The top and bottom of the columns are connected to the centre of the pier cap and pile cap by using rigid links. Pile behaviour is represented using linear springs for both translational and rotational degrees of freedom.The vertical displacement and in-plane rotations of the pile caps are restrained at respective degrees of freedom.
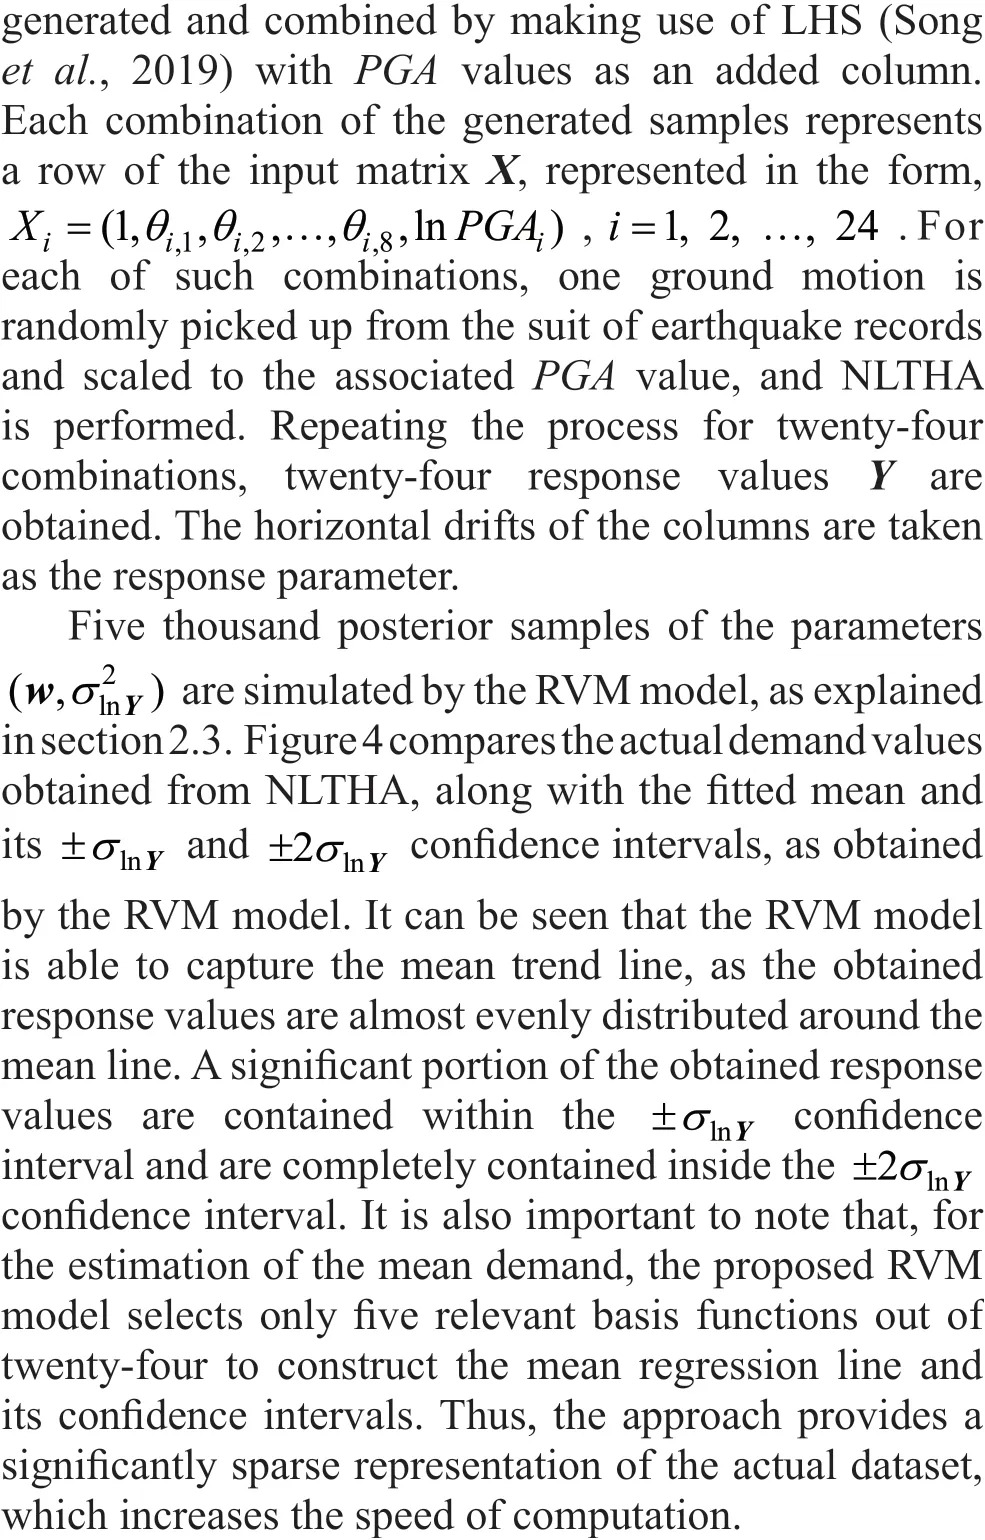

Fig. 3 (a) The elevation of the considered bridge pier and the corresponding OpenSees finite element model and the fiber discretization of (b) the pier caps and (c) pier columns

For the likelihood approach, twenty-four random bridge samples are generated, and each of these is linked with a seismic record from the bin. The NLTHA is performed for each of the realizations at differentPGAlevels. For this approach, sevenPGAlevels are considered as 0.1 g, 0.3 g, 0.5 g, 0.8 g, 1.0 g, 1.2 g and 1.5 g. For each of thePGAlevels, the numbers of ground motions that exceed the limit states are computed.The maximum likelihood estimate of the fragility parameters are obtained as explained in section 2.2. The fragility results obtained by the different approaches are compared considering the fragility estimate obtained by the brute force MCS as the reference results. For this,5000 random sample of the bridge pier are obtained by LHS following the probabilistic nature of the random parameters, as provided in Table 1. For each random sample of the pier, an earthquake time history is randomly selected from the bin of twenty-four accelerograms and scaled to a particularPGA. The NLTHA is performed for each of such 5000 realizations of the pier, and from the mean response and its standard deviation the fragility model parameters are obtained for eachPGAlevels. The fragility is computed accordingly. The fragility estimated by the different approaches are compared in Fig. 5. It can be noted from the plots that the RVM model yields fragility with better accuracy compared to the other two most commonly used analytical methods. However, at lower performance levels (LS1 and LS2), the differences between the estimated fragilities of the three methods are small, but at higher performance levels (LS3 and LS4) significant deviations in the fragility estimates can be observed from the results obtained by the brute force MCS technique. However, the fragility curve generated by the RVM model shows better accuracy in capturing the trend. In this regard it may be noted that the proposed RVM model requires 24 NLTHAs, as is required in case of cloud method of analysis. Whereas, a total 168 NLTHAs is involved in the case of the likelihood method, given that the approach requires the scaling of ground motions at differentPGAlevels. On the other hand, the cloud method requires the same numbers of NLTHA, as is necessary for the proposed RVM model.The accuracy of the fragility results by using the cloud method is the least when compared with the direct MCSbased fragility results. Moreover, a separate capacity analysis is involved in the cloud method to incorporate the influence of structural parameter uncertainty. Thus,apart from less accuracy, the analysis effort required by the cloud method is substantially more than the proposed RVM model. The analysis effort required by the likelihood method is significantly higher than the proposed RVM model due to the repeated scaling of accelerograms. Moreover, the RVM approach reflects the amount of uncertainty in the fragility results, as represented by the confidence intervals of the SFA results, which the other two approaches cannot provide.This helps the RVM model to reflect the designers′confidence in the estimated fragility and provides the ability to augment newly available data in the future,an approach that can further reduce uncertainty and increase confidence levels in predictive ability.

Table 1 The properties of the random parameters of the bridge

Fig. 4 The predicted mean demand line, along with its ± σlnY and ± 2σlnY confidenceintervals
4.2 SFA of the entire three-dimensional model of the bridge
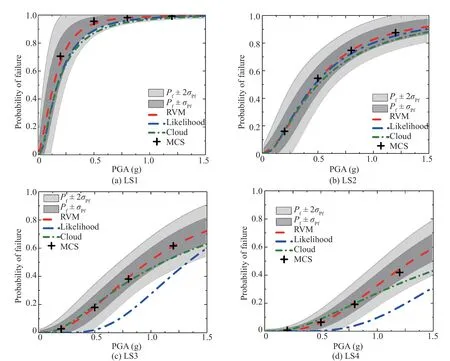
Fig. 5 A comparison of fragility curves developed by different methods for (a) LS1, (b) LS2, (c) LS3 and (d) LS4
A realistic finite element model of the entire bridge is now developed in the OpenSees for a demonstration of the RVM-based SFA of full-scale bridge structures. The three-dimensional finite element model of the bridge is shown in Fig. 6. The structural properties of each member of the superstructure are obtained by considering the gross cross-sectional properties of the deck-girder system. A typical cross section of the deck-girder system is shown in Fig. 3(a). The superstructure element is connected to the four bearing points over the abutments and the pier caps using a rigid link element. The bridge superstructure is considered to behave elastically during an earthquake, as the failure of superstructures results in the dysfunctionality of the bridges for a longer period and thus is modelled using an elastic beam-column element (Fig. 6). The expansion joints between the deck and the abutment and between the decks above the pile caps are modelled by using nonlinear springs connected in series and parallel, representing the force deformation behaviours of the elastomer bearings (for both piers and the abutments), pounding (between the deck and the abutment and between decks above pier caps), abutment passive stiffness (for abutment responses) and abutment pile stiffness (for abutment responses). The modelling details are explained in Figs. 7(a) and 7(b). The bearings are modelled by zero length springs. Two different types of bearings are considered. One end of the girders is supported on an elastomeric bearing with a fixed steel dowel and the other end on an elastomeric bearing with an expansion dowel. The composite behaviour of the bearing is achieved by combining the force deformation behaviours of the elastomeric pad and the steel dowels.The elastomeric pads are modelled using elastic perfect plastic material and the steel dowels are modelled using hysteretic materials with an initial gap. For fixed steel dowels, the initial gap is considered to be 3.2 mm and for expansion dowels 25.4 mm. During deformation,the steel dowels only act following the gap closure. The stress strain properties of the bearing pads and the steel dowels are adopted from Nielson (2005) (Figs. 8(a) and 8(b)). The poundings between the two adjacent decks and between the deck and the abutment are modelled using impact material available in OpenSees (Fig. 8(c)).The initial and the post-elastic stiffness of the impact material are considered to be 1116 kN/mm and 384 kN/mm(Nielson, 2005). The pounding gap is considered to be 25.4 mm. The passive soil stiffness of abutments is modelled by hyperbolic gap material (Fig. 8(d)) with an ultimate resistance of 0.37 MPa. The failure ratio is considered to be 0.97 (Shamsabadiet al., 2007).Abutment piles are modelled by nonlinear springs. The effective stiffness of each pile is considered to be 7 kN per m width of the abutment. The corresponding initial and the post-elastic stiffness of the nonlinear springs are obtained from Nielson and DesRoches (2007) (Fig.8(d)). The lateral resistance of the abutments under transverse seismic loading is provided by the transverse stiffness of the abutment piles, which is assumed to be the same as that of the longitudinal stiffness (Caltrans,2004). The pier cap and the piers are modelled by using displacement-based beam column elements with an associated fibre section. The modelling of the piers and the pile foundations remain the same, as discussed in the previous section. From the modal analysis of the bridge,the fundamental mode is observed to be a longitudinal mode with a time period of 0.6 s and the second mode is a transverse mode with a time period of 0.42 s.
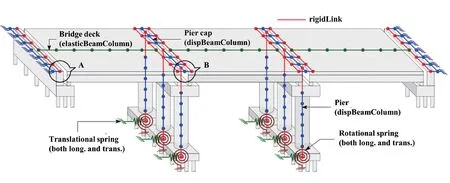
Fig. 6 The OpenSees three-dimensional finite element model of the bridge
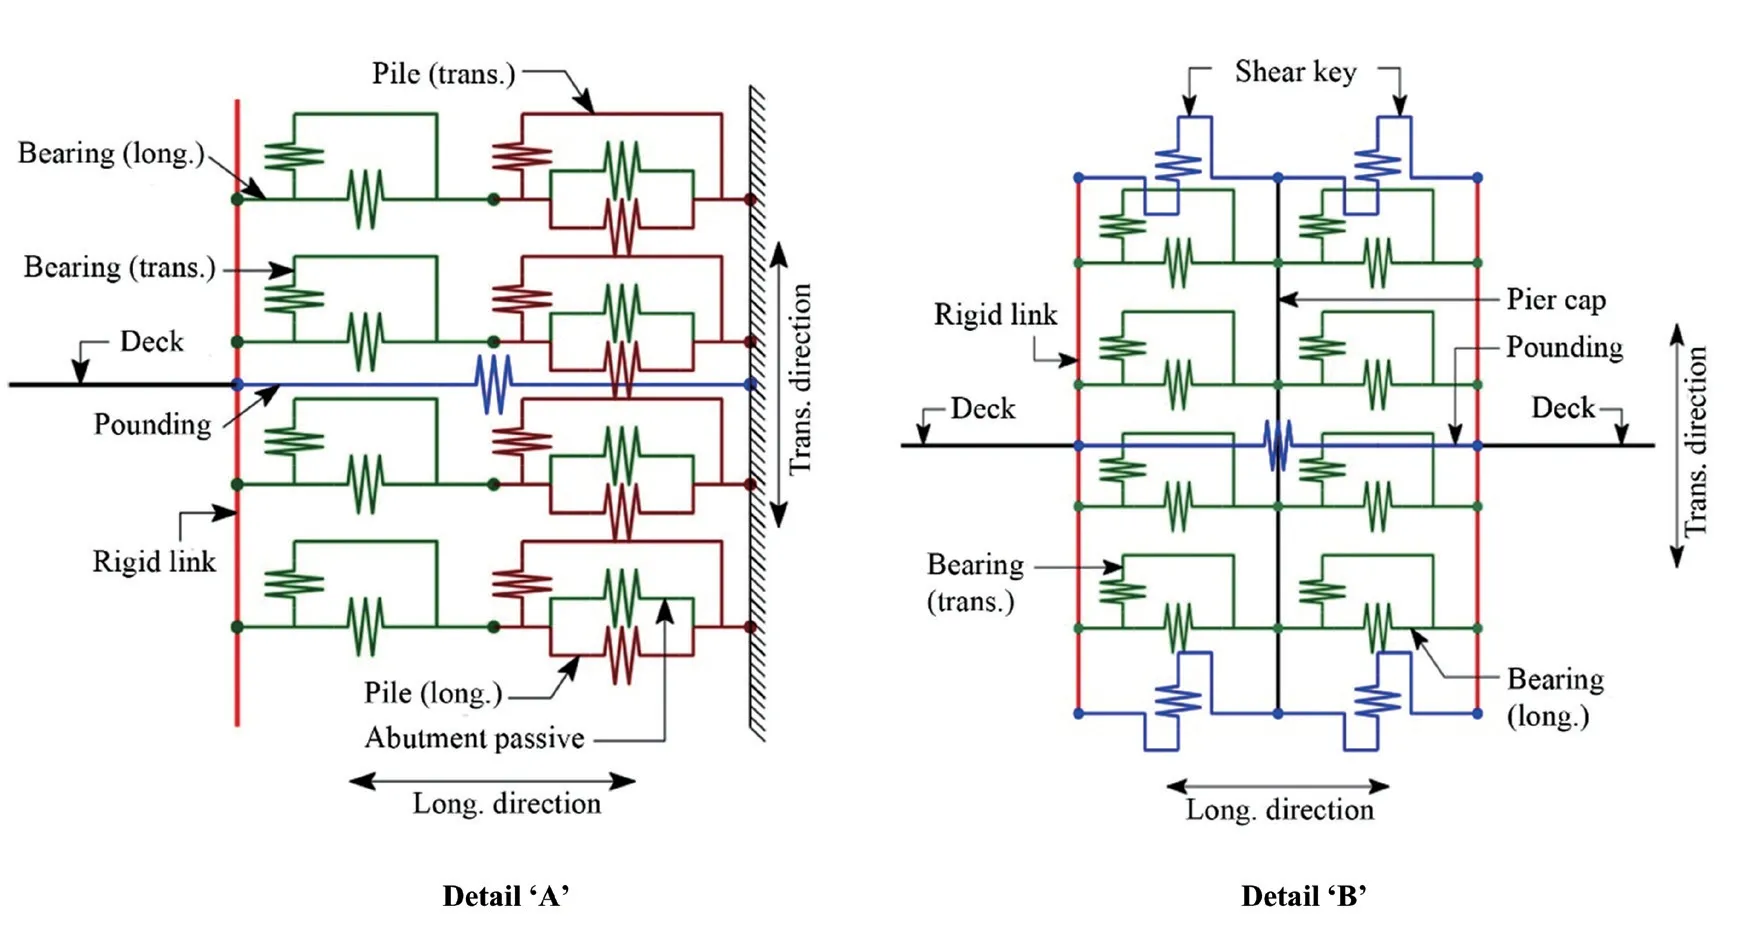
Fig. 7 Arrangement of nonlinear springs for the pier supports and the abutment supports
For SFA, five component response parameters are chosen (as shown in Table 2) to demonstrate the seismic vulnerability of the bridge system. Additionally, to estimate seismic fragilities, appropriate performance limit states need to be chosen for the considered response parameters. There are various definitions of different limit states to define the seismic performance levels of bridges for seismic vulnerability assessment (Mangalathuet al.,2018, Nielson and DesRoches, 2007; Ramanathanet al.,2015; Zhang and Huo, 2009). In the present study, the limit state threshold values of the longitudinal response quantities are adopted from Ramanathanet al.(2015).The maximum bearing displacements and the maximum column drifts are obtained as the maximum of the longitudinal and transverse responses. Other component responses make a contribution only in the longitudinal direction. The column drift and the deck unseating are considered to be the primary response quantities, which are likely to lead to the complete collapse of the bridge.Thus, only those factors are included in the extensive and complete damage states. When bearing displacement exceeds 152 mm, it is assumed that the unseating of the bridge deck from the bearing supports occurs. Abutment displacements during seismic events are considered as the secondary response quantity and hence are included only in slight and moderate damage states.
A total of 24 random samples of uncertain structural parameters, as listed in Table 1, are generated and combined using LHS. ThePGArange is considered to range from 0.1 g to 1.5 g. Ground motions are applied along the longitudinal and transverse directions.Component responses are obtained from the NLTHA of each of the structure-ground motion combinations. Based on the proposed RVM model, posterior distributions of the model parameters are obtained for each of the component responses. For this purpose, 5000 posterior samples are generated by the RVM model.
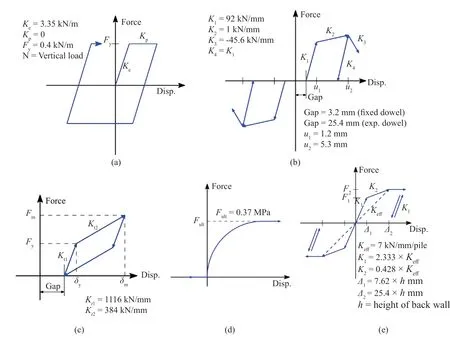
Fig. 8 Force deformation behaviours of: (a) the neoprene pad, (b) the bearing steel dowels, (c) the impact material (pounding),(d) the abutment passive actions and (e) pile contribution
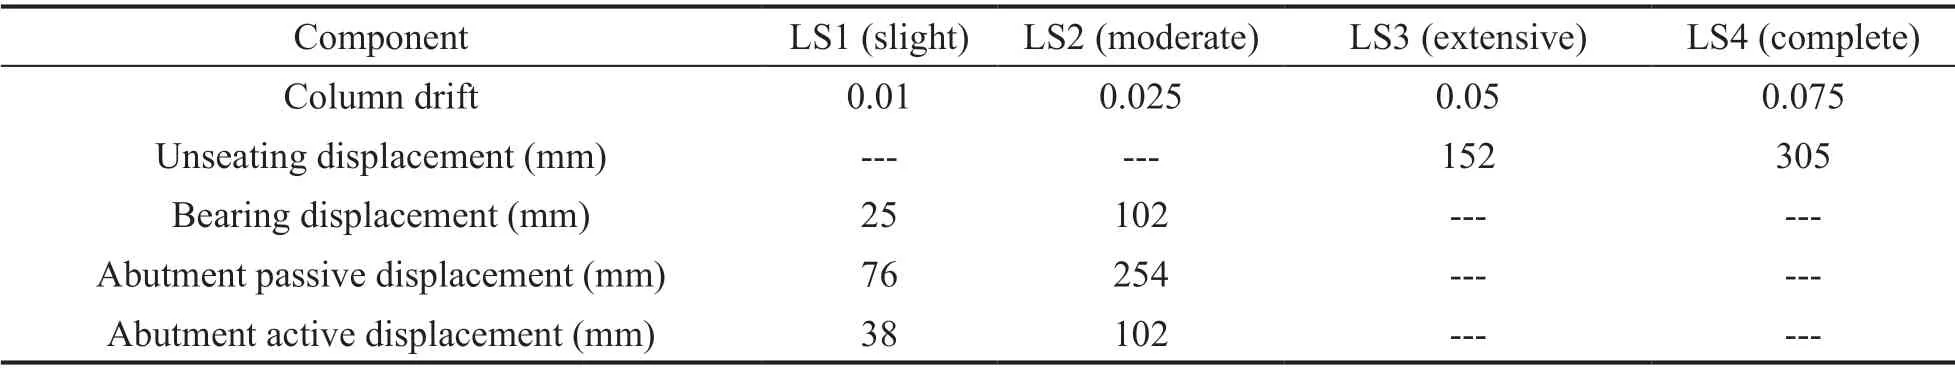
Table 2 Limit states for different damage levels of the bridge
The demand values obtained by the actual NLTHA and the model estimated mean values with its ±lnσ Yand ±2lnσ Yconfidence intervals are shown in Fig. 9 for column responses. It is observed that for the full three-dimensional model of the bridge, the RVM model requires twelve relevant vectors to predict the mean demand. This may be due to the fact that, in this case the number of considered uncertain structural parameters are more than the bridge pier with respect to the data points, for which more relevant vectors are required by the RVM model for the prediction. However, the obtained response values are almost evenly distributed around the mean line, and a significant portion of the obtained response values are contained within the ±lnσ Yconfidence interval and almost completely contained inside the ±2lnσ Yconfidence interval.

Fig. 9 The predicted mean demandline along with its±σlnY and ± 2σlnY confidenceintervals forthe transverse response of thepier columns
Finally, the mean fragility curves and their ±lnσ Yand ±2lnσ Yconfidence intervals are obtained for each of the components. System fragility is obtained by following the assumption that the bridge behaves as a series system by which the failure of one component leads to the failure of the system (Liet al., 2014; Nielson and DesRoches, 2007). IfPf,iis the failure probability of the ‘i’th component, then the system fragility for a particularPGAintensity is obtained as the probability that at least one of the components fails, i.e.,

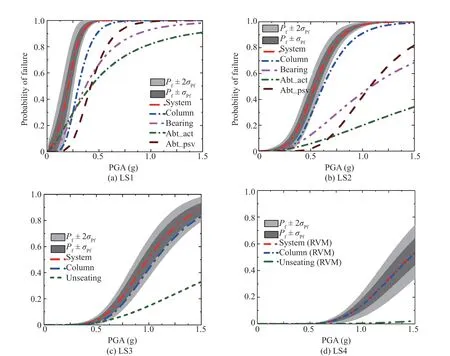
Fig. 10 Components and system fragility curves for (a) slight damage (LS1), (b) moderate damage (LS2), (c) extensive damage(LS3) and (d) complete damage (LS4) of the limit states
From the present study, it is observed that bridge fragility is mostly governed by nonlinear deformations of the columns, followed by nonlinear deformations of the bearings. At lower intensities ofPGA, for slight(LS1) and moderate (LS2) limit states, responses from all the components make moderate contributions to overall system fragility. However, at higher intensities, system fragility is mainly governed by the column responses. It is more obvious in the case of ‘extensive’ and ‘complete’damage states (LS3 and LS4 respectively) whereby the system fragility curve closely follows the column fragility curve for different intensity values. Next to the column,bearing displacement is the major vulnerable component that influences overall system vulnerability. However, at lower performance levels (LS1 and LS2) and at lower intensities, vulnerability due to the abutment active response is observed to make a higher contribution. The influences of abutment passive response and unseating displacement are negligible compared to the other vulnerable components. The confidence intervals of the system fragilities highlight the amount of uncertainty involved in the estimated values. It is noted that the confidence bounds of the fragility curves widens for higher limit states, denoting higher uncertainty in the fragility estimates, with an increase in seismic intensity.In general, it is observed that the system fragility of the considered bridge structure is primarily controlled by column fragility for the higher limit states and for high intensity earthquakes. But for lower intensity earthquakes, bearing displacement and the abutment active response also make significant contributions.Thus, for the seismic safety of highway bridges, special attention should be given to the design, detailing and construction of the pier columns, bearing supports and abutments. The observations are also evident from past experiences with the seismic failure of bridges (Moehle and Eberhard, 2000).
5 Summary and conclusions
A RVM-based demand prediction model for efficient SFA of highway bridges is investigated. The RVM model is able to successfully capture the mean trend of demand values. The comparative assessment of the estimated fragilities with the conventional cloud method and the likelihood method shows that the RVM model is capable of estimating fragility with improved accuracy while involving less computational effort. Thus, for complex nonlinear structures such as bridges, the RVMbased SFA approach can serve as a viable alternative.The proposed RVM model can also be used to update the vulnerability information for bridges, with increased confidence regarding the availability of a new set of data obtained from future earthquakes or from laboratory investigations. Regarding the seismic vulnerability of the sample bridge, it is observed that the system fragility of the considered bridge structure is primarily governed by column fragility for higher limit states and for high intensity earthquakes. But for lower intensity earthquakes, the bearing displacement and abutment active response also make significant contributions.Thus, for the seismic design of highway bridges,careful examinations of vulnerabilities of pier columns,bearing supports and abutments are required. Though the RVM-based SFA approach is illustrated in the present study for a typical highway bridge, the proposed approach is generic enough to be readily applicable to a seismic vulnerability assessment of any type of bridge structure for any location. The study is restricted by its consideration ofPGAas the intensity measure with a performance function adopted from a particular study in the existing literature. However, this particular proposal can readily be applied to otherIMs and any other types of appropriately defined performance functions. These aspects require additional study.
杂志排行

Earthquake Engineering and Engineering Vibration的其它文章
- Serviceability evaluation of water supply networks under seismic loads utilizing their operational physical mechanism
- Improving the seismic performance of base-isolated liquid storage tanks with supplemental linear viscous dampers
- Over-height truck collisions with railway bridges: attenuation of damage using crash beams
- Seismic performance of a rectangular subway station with earth retaining system
- Optimization for friction damped post-tensioned steel frame based on simplified FE model and GA
- Development of a double-layer shaking table for large-displacement high-frequency excitation