Optimization for friction damped post-tensioned steel frame based on simplified FE model and GA
2022-01-21ZhaoZhongweiJianXiangyangYuanYeandLiuHaiqing
Zhao Zhongwei, Jian Xiangyang, Yuan Ye and Liu Haiqing
School of Civil Engineering, Liaoning Technical University, Fuxin 123000, China
Abstract: The post-tensioned (PT) energy-dissipating connection for steel frames has drawn the attention of many researchers for its good seismic performance. Friction mechanisms, such as friction damped PT steel connections, are the approaches typically used to improve energy-dissipating capacity. The mechanical behavior of PT connections has been extensively investigated. The seismic performance of PT frames should be optimized by employing a suitable design of a friction device. In this study, the influence of fmax on the seismic behavior of a PT frame is investigated. The max static frictional force fmax is optimized based on a genetic algorithm (GA). Results indicate that the reasonable distribution of fmax can evidently improve seismic performance. Consequently, the GA method can be effectively utilized for seeking the optimal combination of fmax if the simplified finite element model is adopted. Results derived will provide a foundation for analysis and design of PT frame structures.
Keywords: 3D-FDPT connection; friction element; simplified numerical model; optimization; GA
1 Introduction
Many researchers have paid attention to the mechanical behavior of post-tensioned (PT) selfcentering structural systems due to their excellent seismic performance (Zhanget al., 2016; Saber and Shahria, 2016; Rojaset al., 2005; Herninget al., 2011;Kim and Christopoulos, 2009; Luet al., 2018; Panet al.,2018). The excellent seismic performance of PT frame structures has been proved by existing research.
PT connections have been investigated in many studies (Sancheset al., 2018; Takewaki, 2017). The behavior of self-centering connections based on the number of post-tensioning strands and initial posttensioning force was investigated by Jin and Kee(2017). Cesareet al. (2019) used yielding steel angles to create a dissipative rocking mechanism at beamcolumn and column-foundation connections. Ricleet al. (2002) investigated the seismic performance of PT connections by using a numerical method. Garlocket al.(2008) systematically studied the mechanical behavior of PT connections, including the influence of initial posttensioning force, the number of post-tensioning strands,and the length of reinforcing plates. Guoet al. (2011)investigated the seismic behavior of self-centering connections that used a friction device. The additional energy-dissipating device has always been added to PT connections due to the deficiency of PT structures in energy-dissipating capacity (Kim and Christopoulos,2008; Tsaiet al., 2008; Wolskiet al., 2009; Tzimaset al.,2015; Wanget al., 2019; Fanget al., 2018, 2019).
The mechanical behavior of PT structures has been widely investigated, and the next step is the mechanical behavior of entire structures. Transit dynamic analysis is necessary for investigating the seismic behavior of entire structures. However, analyzing PT structures on a large scale, as well as conducting transient dynamic analysis for PT frame structures, is nearly impossible due to the limits of computational power. Hence, a simplified finite element (FE) model, which can reduce the need for computational power, is needed. The authors have done some work on the simplified FE model of PT connections (Zhaoet al., 2020, 2018; Chenet al., 2017).The simplified FE model of PT connections can provide the foundation for the investigations on structural behavior.
The friction damped PT (FDPT) connection is one of the most typical self-centering connections. A friction device can evidently improve energy dissipation capacity. However, the max static frictional forcefmaxshould be suitably set to maintain the self-centering behavior of the FDPT connection. The connection will transform into rigid connections iffmaxis set at large,and the energy dissipation capacity will decrease iffmaxis set extremely small. In addition, thefmaxof a friction device located at different floors should be different,because seismic action is different. Thus, thefmaxof a friction device located on different floors should be reasonably set to optimize the seismic behavior of PT frame structures.
In the present work, a genetic algorithm (GA) is utilized to seek the optimal combination offmaxlocated on different floors. A simplified FE model is adopted to reduce the time needed for FE analysis. The influence offmaxon the seismic behavior of the PT frame is investigated. Then,fmaxis optimized based on GA, and an objective function is proposed. The results indicate that the reasonable distribution offmaxcan evidently improve seismic performance. The GA method can be effectively utilized for seeking the optimal combination offmaxif the simplified FE model is adopted.
2 Simplified numerical model of a PT frame
Existing research has indicated that columns and beams in PT connections are mainly kept elastic during seismic actions. A friction device can be used to improve the energy-dissipating capacity. Thus, the beam element(Beam188) in ANSYS is used to model the steel beam and column in the PT connection. The simplified mechanical model of a PT connection is shown in Fig. 1. A nonlinear spring element Combin39 in ANSYS can be adopted to prohibit invasion between the steel column and the beam (contact element) and model the friction device (friction element) (ANSYS, 1998). The PT strand is modeled by tensioning only the element Link180. Pretension force is introduced by applying a negative temperature. Detailed information about the FE model of the PT connection and the friction element,which is not presented here (given that the focus of this study is optimization), can be found in Zhaoet al. (2018,2020) and Lianget al. (2017).
The mechanical models of 2D-FDPT and 3D-FDPT connections are shown in Figs. 2 and 3, respectively. The distance between the friction device (or friction force)and the beam edge is indicated byH. The rigid beam element MPC184 is adopted to connect the end of the PT strand and the beam. Nodes 3′ and 7 and 3″ and 6 indicate the node to establish the beam element. Node 3 is attached to the steel column and shares the same location with 3′ and 3″. The nodes located at the end of a high-strength strand (Nodes 8-11) are also connected to the side end of the beam (i.e., 7) by the rigid beam element. Given that the main objective of this study is to investigate the seismic performance of an FDPT connection, the detailed transfer path of shear force is not considered and the vertical displacement of Nodes 3,3′, and 3″ are directly coupled. That is to say, the vertical displacement at the end of the beam and the column were coupled. The dotted lines in Figs. 2 and 3 represent the outline of the actual section of the beam.
3 Validation of the numerical model

Fig. 1 Simplified mechanical model of 2D-PT connection
The FE model of an FDPT beam-column connection seems to be the combination of the friction spring element and PT connections. One FDPT beam-column connection among the specimens tested by Kim and Christopoulos (2008) is modeled to assess the accuracy of the results derived by the FDPT connection model proposed in this study. The column and beams are W360×509 and W610×113 sections, respectively. The diameter of each PT strand is reported to be 32 mm. The initial post-tensioning force in an individual PT strandTiis 200 kN. TheFmaxof the friction spring element is set to 280 kN. Detailed information can be found in Kim and Christopoulos (2008). The FE model established by the proposed method is shown in Fig. 4, and the loading history is presented in Fig. 5. The comparison of the results is shown in Fig. 6. The results derived by different methods are in good agreement. The time needed for conducting the analysis once is approximately 2 min, which indicates that the computational cost can be significantly reduced. The deformation of the FE model is also compared to that derived by Kim and Christopoulos (2008). The FE model can accurately simulate the deformation mechanism of PT connections.
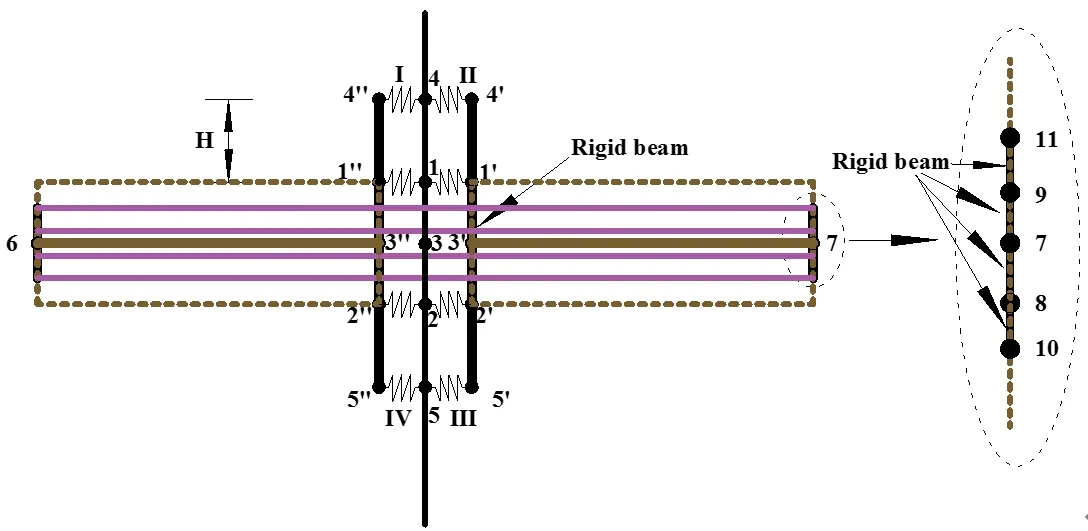
Fig. 2 Constraint relation among internal nodes (2D)

Fig. 3 Mechanical model of a 3D-FDPT connection

Fig. 4 Numerical model of the connection adopted by Kim and Christopoulos
4 Influence of fmax
4.1 Influence of fmax on hysteresis behavior
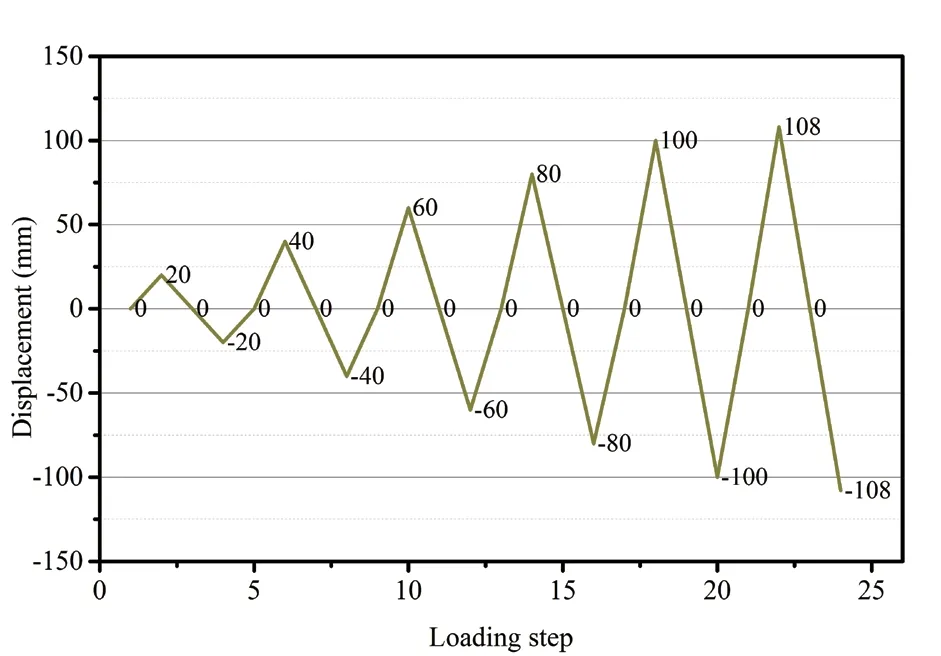
Fig. 5 Cyclic loading history

Fig. 6 Lateral load-displacement response: FE results compared with results derived by Kim and Christopoulos (2008)
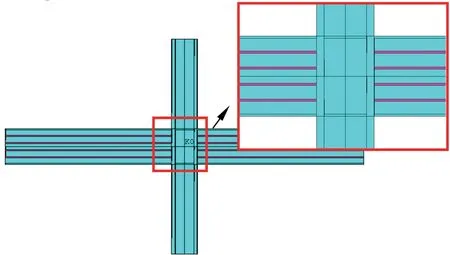
Fig. 7 FE model of an FDPT connection
The effect of the magnitude of friction force on seismic performance was investigated. The FE model of FDPT connection specimens was initially established according to a PC4 analyzed by Moradi and Alam(2016), as shown in Fig. 8. The angles were replaced by a friction spring element. The beam and column sections were W24 × 62 and W14 × 311, respectively.The peak value of friction was set as 0, 100, 200, and 500 kN. The yield force of the PT strand was 370 kN,and the initial PT force was set to 150 kN. The results are shown in Fig. 8. The results indicate that the ultimate load nearly increased linearly with the increase in the peak value of friction. The energy-dissipating capacity also increased with the friction. This connection had no energy-dissipating capacity when the friction was set as zero. Initial stiffness was also unaffected by friction force. The residual deformation increased whenfmaxwas extremely large. This connection seemed to be a rigid connection at this time.
4.2 Influence of fmax on structural behavior
The FE model of 3D-FDPT connection specimens was established based on a general FE code according to the mechanical model presented above, and ANSYS was adopted for this study. A five-story PT frame structure was established, and the columns in the top story within the inflection point were considered in the FE model,as shown in Fig. 9. The beam and column sections measured H603 mm × 378 mm × 25 mm × 25 mm and□434 mm × 434 mm × 57 mm × 57 mm, respectively.

Fig. 8 Effect of friction force
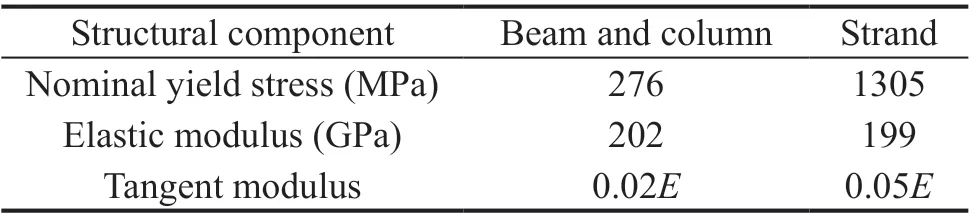
Table 1 Material properties of PT steel frame
Transient dynamic analysis was conducted based on the established FE model. The Imperial Valley seismic wave was adopted to conduct the seismic response analysis, and only the seismic wave in thex-direction was considered. The time history of the seismic wave is shown in Fig. 10. Peak acceleration in thex-direction was adjusted to 0.3 g. The duration of the seismic wave was 14.7 s. The analysis was conducted in a time step of 0.01 s. Load in the vertical direction (excluding gravity)was not considered. The live loads were not directly considered in the analysis. However, the density of the steel of the beam was scaled by 500 times to consider the dead and live loads. The P-delta effect could be fully considered when the large deformation effect was taken into account. Only the material damp of steel was adopted for this work, and the damp ratio was set to 0.002 to decrease the influence of the material damp.The material damp was applied through an “MPDATA,DAMP, , ,0.002” command. The structural damp was decreased to highlight the influence of the friction device. A bilinear model was adopted for the constitutive model, and the specific parameters for all components are shown in Table 1. The fracture of PT strands should be avoided because the PT strands are the guarantee for structural integrity, especially for PT self-centering structures. A progressive collapse may occur after the fracture of PT strands. Hence, the fracture of PT strands was not considered in the proposed FE model, and the bilinear model was adopted for the strands. The density of the steel adopted by columns was expanded five times to consider other dead and live loads.
4.2.1 Influence offmaxmagnitude
The value offmaxwas set to 2.23, 22.3, 223, and 2230 kN to thoroughly investigate the influence offmaxvalue on the seismic performance of the PT frame. The results shown in Fig. 8 imply that the moment corresponding to the gap opening was 160.3 kN.m. The contribution from the friction device was 1.34, 13.4, 134, and 13400 kN.m whenfmaxwas 2.23, 22.3, 223, and 2230 kN, respectively.The value of the post-tensioning force of PT strands was 200 kN, and this force remained unchanged whenfmaxwas adjusted. The lateral displacement at Node 1(Fig. 9) was extracted. The results derived in different conditions are shown in Fig. 11. The results show that the displacement decreased to zero whenfmaxwas 2.23,22.3, and 223 kN. The decay rate corresponding tofmax=2.23 kN was lower than that derived whenfmaxwas 22.3 kN or 223 kN. That is to say,fmaxcould affect postseismic performance. Notably, the seismic performance of the PT frame deteriorated whenfmaxincreased from 223 kN to 2230 kN. The peak value of displacement increased, and residual deformation occurred.
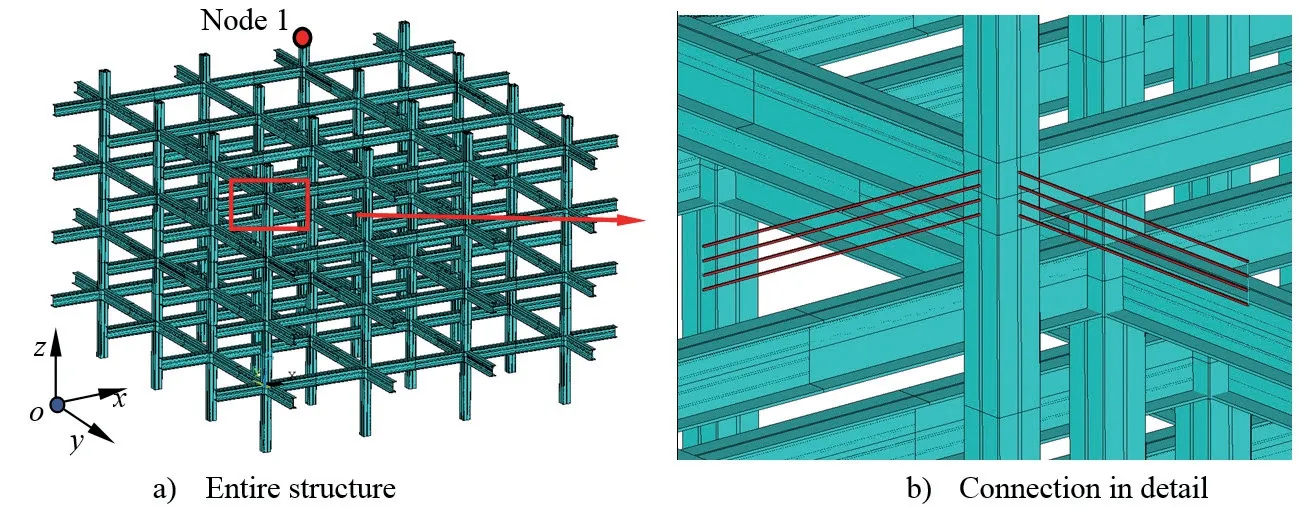
Fig. 9 FE model of an FDPT frame
4.2.2 Influence offmaxdistribution pattern
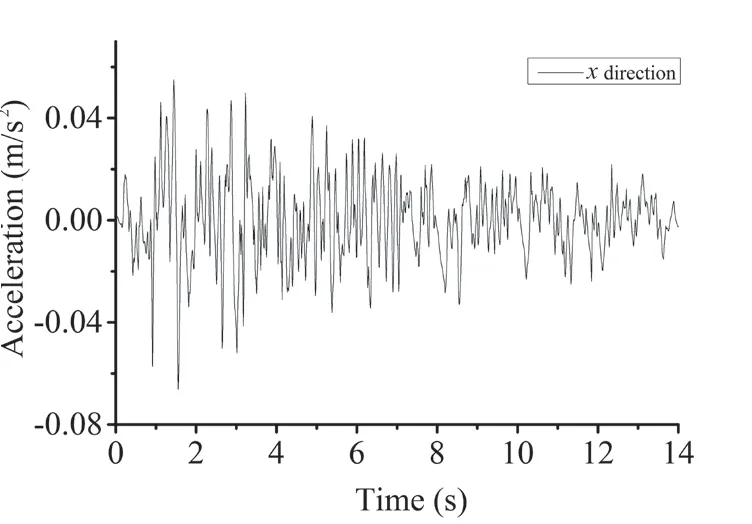
Fig. 10 Time history of the Imperial Valley seismic wave
Thefmaxvalue within a PT frame was the same in the analysis mentioned in the above section. In fact,the lateral seismic load magnitudes on different floors were different. The seismic lateral load increased with a decrease in floor story. The action of friction device would not occur iffmaxwas larger than the corresponding friction caused by seismic load. Previous results revealed that the influence of a friction device on the seismic performance of the entire structure would be weakened iffmaxdecreased. Thus,fmaxshould be changed by considering the differences among respective floors.This conclusion could be validated through means of the results shown in Fig. 12. The linearfmaxin Fig. 12 indicates thatfmaxdecreased linearly with the increase of floor story. For a five-layer frame structure, the maximum static friction for the friction device located on the first floor isfmax, and 3fmax/4, 2fmax/4,fmax/4 for the second, third, and top floors, respectively. The value offmaxwas set to 2.23 kN and 2230 kN.
The results derived based onfmax=2.23 kN are shown in Fig. 12(a). The results indicate that the lateral displacement corresponding to linearfmaxdecreased more quickly than that corresponding to constantfmax.Thus, the linear distribution pattern was superior to the constant distribution pattern. The results corresponding tofmax=2230 kN indicated that thefmaxdistribution pattern nearly had no influence on seismic performance due to the fact thatfmaxwas extremely large, and the action of the friction device could not occur.
4.2.3 Influence of linearfmaxmagnitude
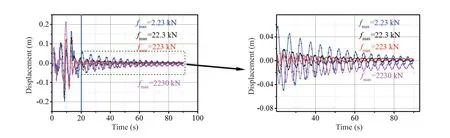
Fig. 11 Influence of fmax magnitude
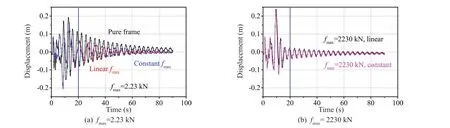
Fig. 12 Influence of fmax distribution pattern
The displacement-time curves derived on the basis of traditional and PT frame structures were compared,as shown in Fig. 13. As seen in this figure, the seismic displacement of the pure frame was larger than that of the PT frame, whosefmaxwas 2.23 kN. Post-seismic displacement decreased to zero quickly due to the existence of a friction-damped device. Moreover,no residual deformation occurred for the PT frame structures. Next, the value offmaxwas increased to 22300 kN to investigate the influence offmaxon the seismic performance of the PT frame structures. The results indicate that the displacement-time curves for the PT frame structure withfmax=22300 kN increased, and the decay rate of displacement decreased. The seismic performance of the PT frame structure with a largefmaxwas similar to that of the pure frame structure. This result was caused by the fact that the PT connection would transform into a rigid connection whenfmaxwas sufficiently large. The results shown in Fig. 13 indicate that the residual inter-story drift increased iffmaxwas set extremely large. Hence, the value offmaxshould not be excessively large. An optimal value forfmaxshould be observed for a specific PT frame.
5 GA-based optimization
5.1 Optimization problem
The objective of this work is to determine the optimized combination offmaxof different floors. The aim is to reduce the dynamic response of the PT frame after the application of seismic load. The issue is a single-objective optimization problem, and its objective functions are implicit functions of the design variables that are not continuously differentiable. Hence, GA is used as the optimization algorithm. GA, performed on MATLAB, is adopted as the solver of the problem, where the number of generations is 100, and each generation has 40 individuals. The value of crossover, mutation,and selection rates are 80%, 1%, and 90%, respectively(Zhaoet al., 2015).

Fig. 13 Influence of fmax on peak displacement
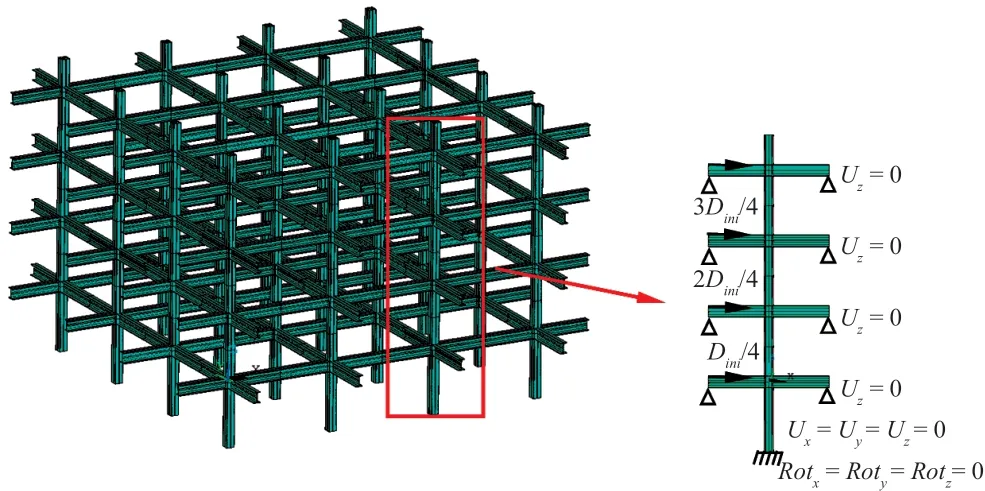
Fig. 14 FE model adopted in the optimization analysis
Transit dynamic analysis, which is time-consuming,is needed for the optimization analysis. The time needed to complete the analysis one time increases dramatically with the element number in the FE model. In addition, the analysis must be performed thousands of times in GA.Thus, one optimization takes a long time to complete.To reduce the time needed for optimization analysis, the aforementioned FE model is reduced to 2D, and only one column is included in the model. The FE model of a fivestory PT frame and the selected part of the optimization analysis are shown in Fig. 14. The translational degrees in the vertical direction at the beam ends are constrained,whereas the bottom of the column is fully constrained.For the presented five-story PT frame, this study aims to seek an optimal combination offmaxlocated on different floors. That is to say, the number of variables is 4 for the five-story PT frame. For simplicity, thefmaxof the friction device located on theith floor is indicated byfmax,i.
5.2 Objective function
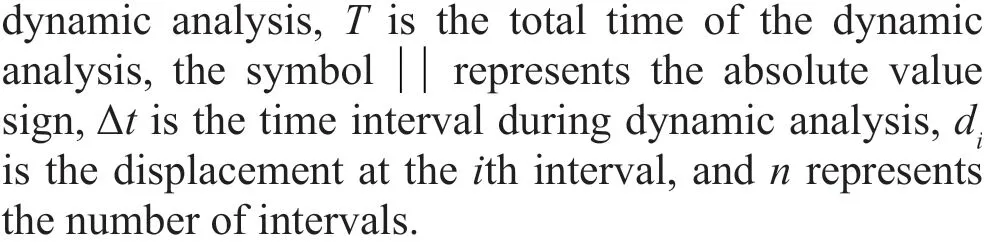
Determining a reasonable objective function is the most important issue for GA-based optimization. The dynamic response can always be represented by the nodal displacement history of a structure. The idealfmaxcombination should own the function that makes the displacement decay to zero as soon as possible.The intensity of dynamic response is indicated by the area between the displacement history curves and the horizontal axis, as shown in Fig. 15. The area can be computed according to Eq. (1). The time interval for the dynamic analysis is the same; thus, 0.02 s is used for the analysis presented in this study. The objective function can be set asDsum, which can be obtained according to Eq. (2).


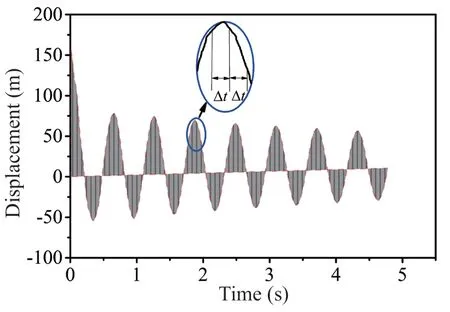
Fig. 15 Determining the objective function
5.3 Loading method
The transit dynamic analysis should be performed for the optimization. The seismic wave can be used to conduct the dynamic analysis. However, the dynamic response varied along with the difference in seismic waves. The optimal results derived based on one specific seismic wave may no longer be optimal for another seismic wave due to the change in the frequency component.
The initial displacement is initially applied to the PT frame to conduct the dynamic analysis. The disadvantage of seismic analysis can be avoided. Given the fact that the vibration of frame structures generally follows the first vibration mode, the lateral displacement is applied for each floor. The magnitude of the lateral displacement at the first, second, third, and fourth floors are set toDini,3Dini/4, 2Dini/4, andDini/4, respectively, to follow the first vibration mode, as shown in Fig. 14.Diniindicates the max displacement applied to the fifth floor.
The tension force of the high-strength PT strand and the lateral displacement are applied at the first loading step. The time integral effect is turned off by “timint,off;” in the first step, and this process can be regarded as a static analysis. In the second load step, the load and the boundary condition are not changed. That is to say, nothing is performed in the second load step. The target of the second load step is to remove the inertia effect. The time integral effect is turned on, and the lateral displacement is removed in the third load step.Then, dynamic analysis is conducted with a time step of 0.02 s. The model stiffness is updated in ANSYS by Newton-Raphson equilibrium iterations, with a default of 30 equilibrium equations. Geometric nonlinearity is considered by “nlgeom, 1.”. The damping ratio of the steel is set to 0.002 to weaken the influence of material damp. Then, energy can be consumed by friction in the largest degree.
5.4 Validation of initial displacement method
To validate the initial displacement method utilized in this work, an example simulation is presented in this section. A cantilever beam with an H-shaped cross section is analyzed. The detailed information about the geometrical size of the cantilever beam is shown in Fig. 16.All degrees, including the translational and rotational degrees of the left side of the beam, are constraint. An initial vertical displacement, which equals 10 mm, is applied to the right side. The time integral effect should be turned off by “timint, off;”. Then, the first load step can be implemented. Subsequently, the analysis can be performed again without changing anything. The time integral effect is turned on by “timint, on;”, and the initial displacement applied to the right side is removed.The material damp ratio is set to 0 and 0.01 to reveal the influence of material damp on the time history of nodal displacement. The time history of the nodal displacement is shown in Fig. 17. Regarding the figure,the dynamic displacement does not decay when the damp ratio is 0. The fundamental frequency of the beam is 7.6 Hz. As shown in Fig. 17, the period of vibration is 0.133 s. When the damp ratio is set to 0.01, the dynamic displacement starts to decay with an increase in time.Thus, the free vibration of the structure can be motivated by the aforementioned initial displacement method.
6 Results derived based on GA
6.1 Optimal analysis
TheDiniis set to 0.15 m to investigate the influence of dynamic response on the optimal combination offmax. The bottom and upper limits offmaxare set to 10 kN and 5000 kN, respectively; that is,fmaxis randomly generated between 10 kN and 5000 kN. Then,the GA is utilized to select the optimal combination on the basis of the objective function value. The optimal analysis is performed based onDini=0.15 m. The optimal combination corresponding toDini=0.15 m isfmax,2=1122.1 kN,fmax,3=1014.8 kN,fmax,4=14.9 kN, andfmax,5=14.9 kN, as shown in Fig. 18(c). The history of objective function during the iteration process is shown in Fig. 18(b). As shown in the figure,Dsumdecreases from 8.3 m to 5.5 m after optimization.
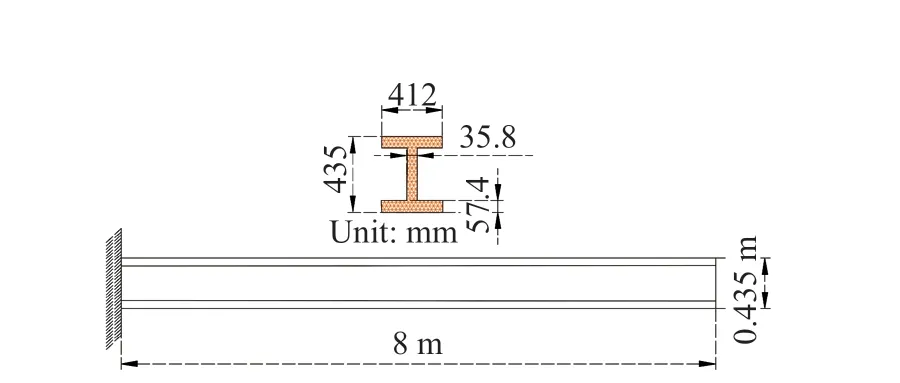
Fig. 16 Schematic of the analyzed cantilever beam

Fig. 17 Time history of vertical displacement
Thefmaxis assumed to be constant and equal to 1122.1 kN (i.e.,fmax,2=1122.1 kN,fmax,3=1122.1 kN,fmax,4=1122.1 kN, andfmax,5=1122.1 kN). The dynamic response of lateral displacement at the top node of the analyzed FE model is compared with that corresponding to the optimal results, as shown in Fig. 18(a). The lateral displacement after optimization decays more quickly than the constantfmax=1122.1 kN. The vibrational frequency corresponding to constantfmax=1122.1 kN is higher than that corresponding to the optimal combination. The results indicate that iffmax,3,fmax,4, andfmax,5are set to 1122.1 kN, then the vibrational frequency is extremely large. Then, theDiniis set to 0.1 m, and the optimalfmaxcombination derived based onDini=0.15 m is utilized.The displacement history is shown in Fig. 18(a). The dynamic response corresponding toDini=0.1 m is larger than that corresponding toDini=0.15 m. That is to say,the optimalfmaxcombination derived based onDini= 0.15 m may not be optimal for different values ofDini. Next, the optimization analysis is also performed forDini= 0.1 m,as shown in Fig. 19. The optimal values offmax,2,fmax,3,fmax,4, andfmax,5are shown in Fig. 19(c).
The displacement history indicated by “before optimization” shown in Fig. 19(a) is derived based onfmax=3102.5 kN. The curves indicated byDini=0.1 m are derived based on the optimalfmaxcombination shown in Fig. 18(c). The optimalfmaxcombination derived forDini= 0.1 m is more suitable than the optimal combination derived byDini= 0.15 m. That is to say, the optimal combination offmaxvaries with the change in initial dynamic load.
6.2 Effects of locations of friction devices
The optimal combination of thefmaxof the friction device located on different floors can be derived based on GA. However, the contribution of a friction device located on different floors is not revealed. A detailed parametrical analysis is conducted to investigate the influence of the friction device located on different floors with regard to the seismic performance of the PT frame.The values offmax,2,fmax,3,fmax,4, andfmax,5are set according to the optimal combination derived corresponding toDini=0.15 m in the above section. Next, one of the four values offmaxis scaled by Eq. (3), and the other three values offmaxremain unchanged. Parametermchanges from 1 to 100, with a step equal to 1. Subsequently,fmaxcan be adjusted from 0 to 2fmax, with a step equal to 0.02fmax. The value ofDiniis set to 0.1, 0.15, and 0.3 m to reveal the influence ofDini.
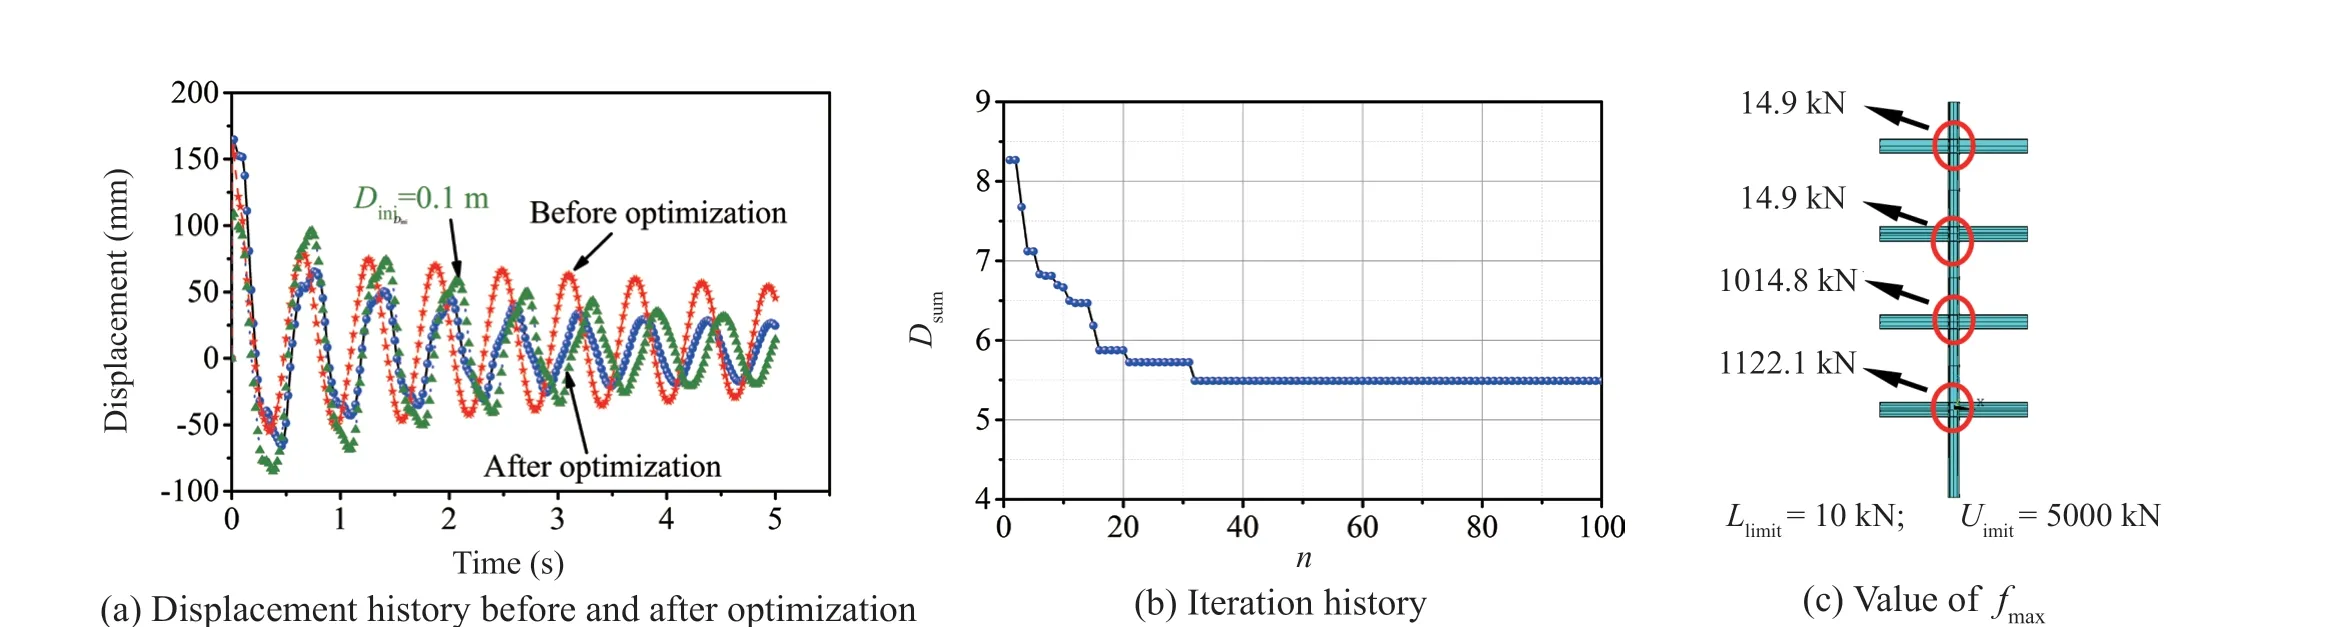
Fig. 18 Optimized results for Dini = 0.15 m
The changing curves ofDsumalong withTsare shown in Fig. 20(a) whenDini=0.15 m. The value offmax,2andfmax,3exert a significant influence on the dynamic response of the PT frame.Dsumwill increase iffmax,2andfmax,3are set extremely small or excessively large.Dsumcan exceed over 11 m iffmax,3is equal to 0 or two times of the originalfmax,3. Thefmax,1-Tscurve observes the same rule.However, the difference is that the increased speed ofDsumalong with a smallerfmax,2is faster than a largerfmax,2.In addition, the change offmax,4andfmax,5has no obvious influence onDsum. That is to say, the energy is mainly consumed by the friction device located on the bottom two floors of the frame structure whenDini=0.15 m.TheDsum-Tscurves corresponding toDini=0.1 m are shown in Fig. 20(b).fmax,2can makeDsumthe smallest whenTs=0.4. Then,Dsumwill increase withTs.Dsumdoes not change anymore whenTsexceeds 1.fmax,3has a similar influence on the seismic response; this notion indicates an optimalfmaxexisting for one specificDini.fmax,4andfmax,5have no influence on the seismic response of the analyzed PT frame.
TheDsum-Tscurves corresponding toDini=0.3 m are shown in Fig. 20(c). The influence offmax,3onDsumexceedsfmax,2.fmax,4starts to exhibit certain influence onDsum. The optimal combination corresponding toDini=0.15 m is applicable toDini=0.3 m.
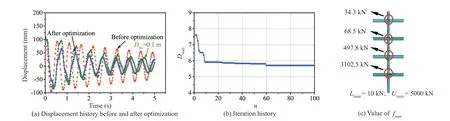
Fig. 19 Optimized results for Dini = 0.1 m
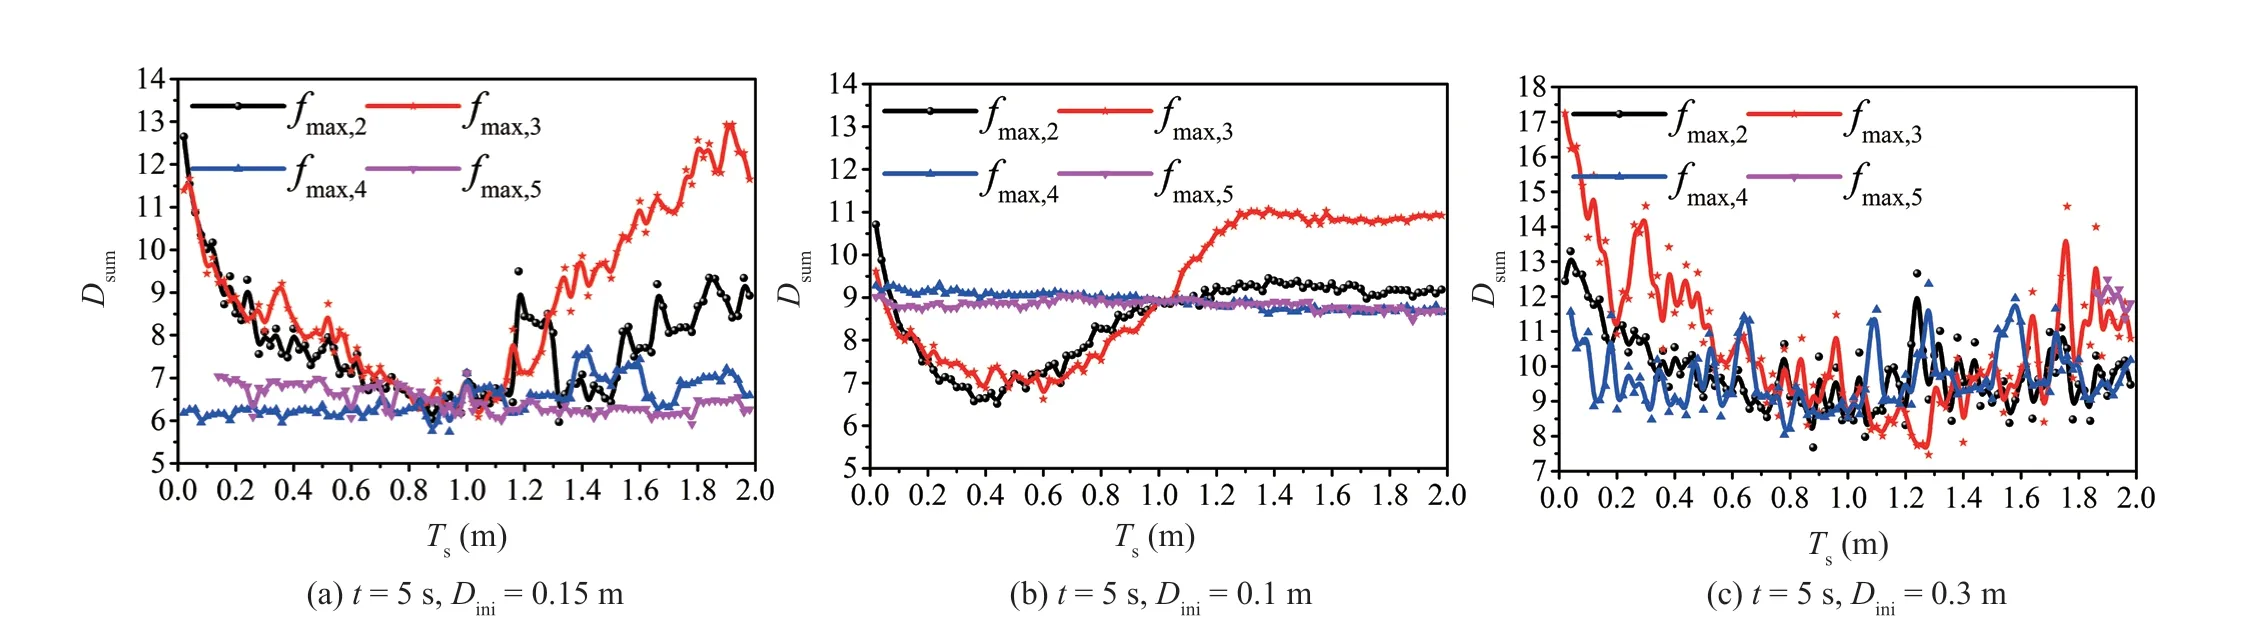
Fig. 20 Influence of different values of fmax on Dsum
TheDsum-Tscurves corresponding toDini=0.1 m are shown in Fig. 21.fmax,2has almost no influence onDsumwhenTsis larger than 0.15. This result is consistent with the results shown in Fig. 20(b). The large value offmax,2in the optimal combination is caused by the fact thatfmax,2has no obvious influence onDsumafter it is larger than a certain value. In addition,fmax,4andfmax,5have no influence on theDsum-Tscurve. Therefore, the energy is mainly consumed by the friction device located on the third floor whenDiniis 0.1 m.
A seven-story PT frame is analyzed to reveal the influence of a building′s particular story on the optimal combination offmax.Diniis set to 0.2 m. The optimal combination offmaxis shown in Fig. 22(b). The large value forfmax,6andfmax,7is caused by the fact thatfmax,6andfmax,7have nearly no influence on seismic response. This finding is similar to the five-story PT frame analyzed above.
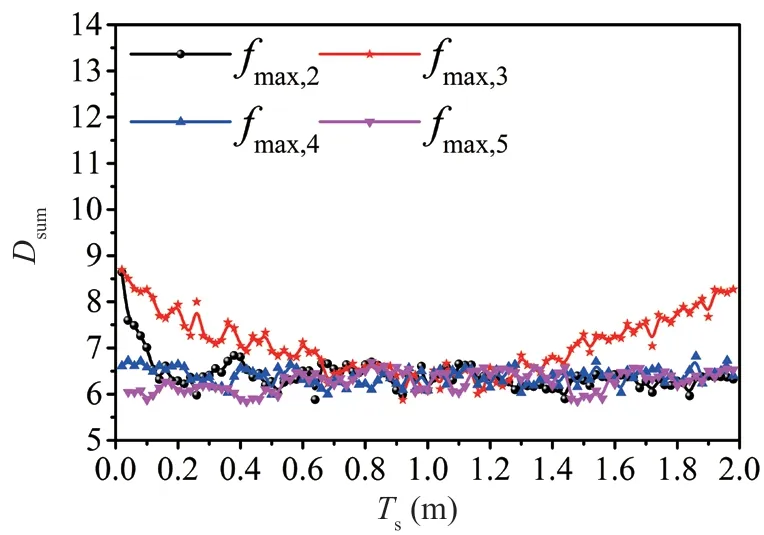
Fig. 21 Influence of different values of fmax on Dsum (Dini= 0.1 m)
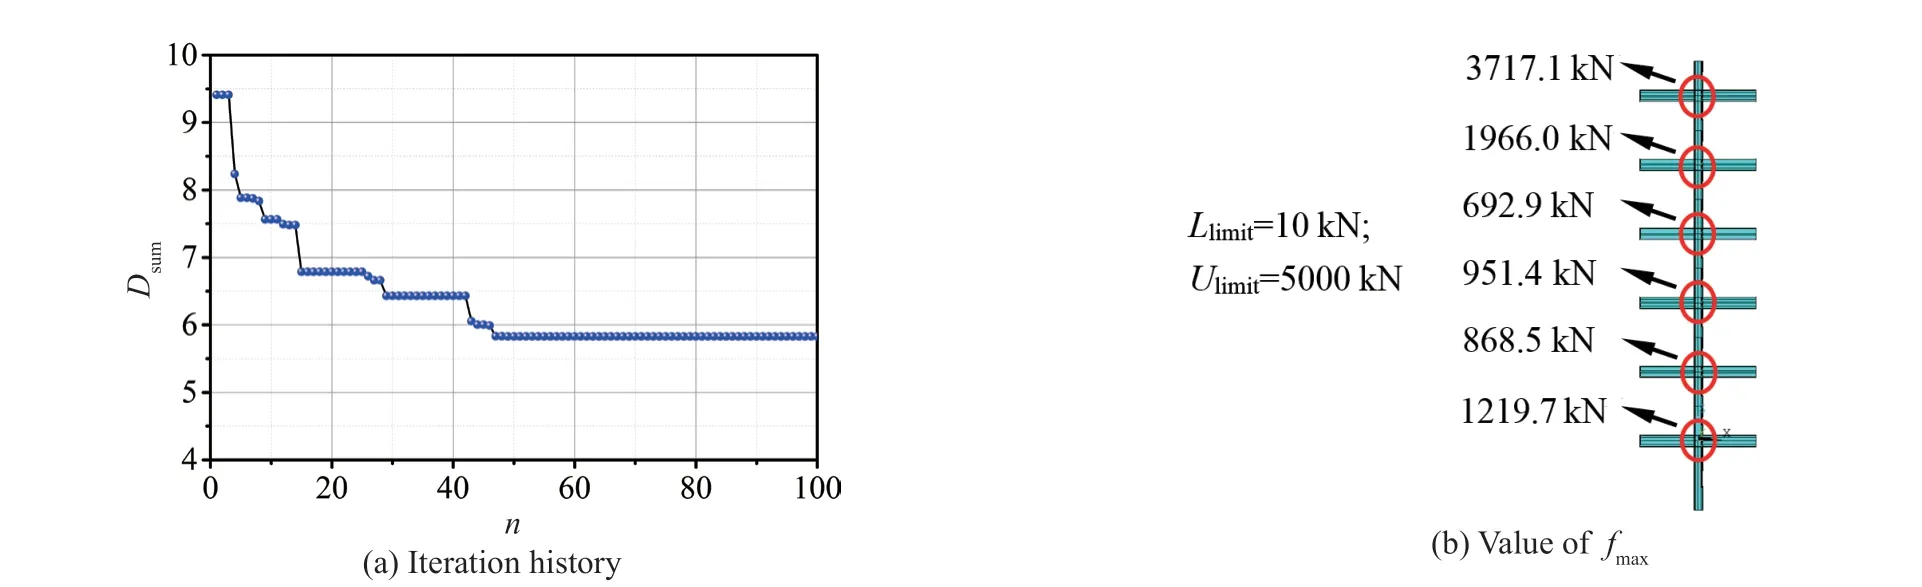
Fig. 22 Optimized results for Dini= 0.1 m
7 Conclusions
GA is utilized to conduct an optimization analysis for PT frame structures by considering the max friction force of a friction device located on different floors. The objective function is proposed based on the optimization problem. The results from this study indicate that the simplified FE model of the PT frame can be optimized by GA. The conclusions derived in this study can be summarized as follows.
(1) Thefmaxof the friction device should be reasonably set to decrease the seismic response. The value offmaxshould also be varied according to the floors where the friction device is located.
(2) GA can be efficiently utilized to optimize thefmaxcombination, and seismic performance can be markedly decreased.
(3) The optimal combination offmaxvaries with the change in initial dynamic load. Thus, the optimizedfmaxshould be set according to the seismic grade of the building.
(4) The friction device located on the top two floors has little influence on seismic response.
Acknowledgment
The work described in this study was financially supported by the Natural Science Foundation of Liaoning(20180540144) and the State Key Research Development Program of China (Grant Nos. 2016YFC0801404 and 2016YFC0600704).
杂志排行

Earthquake Engineering and Engineering Vibration的其它文章
- Serviceability evaluation of water supply networks under seismic loads utilizing their operational physical mechanism
- Improving the seismic performance of base-isolated liquid storage tanks with supplemental linear viscous dampers
- Seismic fragility analysis of bridges by relevance vector machine based demand prediction model
- Over-height truck collisions with railway bridges: attenuation of damage using crash beams
- Seismic performance of a rectangular subway station with earth retaining system
- Development of a double-layer shaking table for large-displacement high-frequency excitation