Development of seismic fragility curves for precast concrete frames with cast-in-situ concrete shear-walls
2022-01-21AliakbarYahyaabadiRoozbehTalebkhahandMahdiAdibi
Aliakbar Yahyaabadi, Roozbeh Talebkhah and Mahdi Adibi
Faculty of Engineering, University of Bojnord, Bojnord 94531-55111, Iran
Abstract: Precast reinforced concrete buildings have been well received in some seismic zones worldwide due to advantages such as the ease and the speed of implementation, and the possibility of working in inappropriate atmospheric conditions. In this research, seismic fragility curves were developed for precast concrete frames with a cast-in-situ concrete shear-wall, concerning the important issues of modeling the precast beam-column joints, construction quality, and soil type effects. For this purpose, the incremental dynamic analysis (IDA) was conducted for three-dimensional models of 3-, 5-,and 8-story buildings under two record sets corresponding to soil types C and D of the NEHRP code. Beam-column joints were modeled using nonlinear rotational springs with rigid links with respect to the finite size of the joint panel. Results demonstrate that the Weibull distribution can be fitted to the damage state capacities better than the lognormal distribution at the intensities that are more than one standard deviation away from the median damage capacity. The seismic vulnerability of precast structures increases at all damage states as the height of the building increases. It is also observed that soil type has almost no considerable effect on the fragility curve parameters for all damage states considered herein.
Keywords: fragility curve; incremental dynamic analysis; precast beam-column joints; construction quality; soil type effects
1 Introduction
Fragility curves demonstrate the probability of building damage for various levels of earthquake intensity. Each point on the fragility curve shows the probability of exceeding a specific damage state under an earthquake with a given intensity. These curves are a useful tool for seismic vulnerability assessment and prioritizing the retrofit plan strategies at an urban scale(Abo-El-Ezzet al., 2013; Su and Lee, 2013; Ahmadet al., 2015; Kadamet al., 2020, Zhuet al., 2015).
Several approaches can be used to develop fragility curves for a specific structural system. Analytical procedures are the widely used method encountered in the literature (Vamvatsikos and Cornel, 2005). They can be broadly classified into two groups: the static- and dynamic-based capacity spectrum methods (Suranaet al., 2017). The latter is also known as the incremental dynamic analysis (IDA). In IDA, a structural model is subjected to a set of ground motion records, scaled to different levels of intensity to describe structural behavior from elastic to collapse (Vamvatsikos and Cornell, 2002).
The development of fragility curves for reinforced concrete (RC) buildings has been paid attention to by many researchers. Emami and Halabian (2017)conducted an incremental dynamic analysis to establish collapse fragility relationships for high-rise RC core-wall buildings. Their study was carried out on a case study of a fully three-dimensional numerical model of a 42-story building. In another study, Ramamoorthyet al. (2008)developed fragility curves for RC frames, designed for gravity loads, with various heights ranging from one to ten stories. They proposed fragility functions in terms of 5% damped spectral acceleration for the structural fundamental period,Sa(T1). The fragility curves for RC frames designed for gravity load were also developed in research conducted by Celik and Ellingwood (2009).They used the derived fragility curves for the seismic vulnerability assessment of an RC frame inventory in Memphis, Tennessee. The results revealed the vulnerability of the most existing buildings in Memphis for the performance objectives of life safety and collapse prevention.
Bilgin (2013) studied seismic fragility of reinforced concrete public buildings designed according to the 1975 version of the Turkish seismic design code. Seismic deformation demands were computed with a set of 100 strong ground motion records with peak ground velocity as a seismic intensity measure (IM). The results revealed that concrete and steel detailing quality have a limited effect on the immediate occupancy performance level.In contrast, construction quality is more critical for life safety and collapse prevention performance levels.
The use of precast elements in concrete buildings has been taken into consideration for reasons such as lower production cost and production time, high-quality control, possible construction in different seasons of the year, and more safety at the workplace. Since the seismic behavior of the precast concrete buildings could be different from cast-in-situ concrete structures, it is necessary to develop fragility curves specific to this type of construction.
Senel and Kayhan (2010) investigated fragility curves for typical Turkish precast buildings, ignoring the effect of nonstructural components. In another research study, the fragility functions for Turkish precast buildings were determined considering the impacts of masonry infills (Korkmaz and Karahan, 2011). In similar studies, the fragility curves for different classes of Italian precast buildings were proposed by Bologniniet al.(2008) and Casottoet al. (2015). Additionally, Babič and Dolšek (2016) and Beilicet al. (2017) developed seismic fragility curves for industrial prefabricated structures for different versions of the Italian design code. The vulnerability assessment of industrial RC precast buildings, designed based on current seismic codes, was conducted by Ercolinoet al. (2018). They performed a parametric study to investigate the safety of 40 RC single-story precast structures against collapse. The results demonstrated that the buildings are safe against collapse mainly because of structural overstrength for seismic actions. Savoiaet al. (2017) documented the main damage and collapse mechanisms observed in precast RC industrial buildings following the 2012 Emilia earthquakes. They found that designing Italian prefabricated buildings with no seismic criteria is the main reason for the collapse of buildings that occurred during this earthquake.
The seismic performance of precast concrete buildings is often influenced by beam-column joints(Gülkan, 1998; Park, 2002; Arslanet al., 2006; Ketiyot and Hansapinyo, 2018). The results of previous research show that the ultimate load-carrying capacity of the precast connections obtained from the hysteretic loaddisplacement is weaker than that of the monotonic load-displacement (Adibiet al., 2019). Shear and bond deterioration are the failure modes that mostly are observed in experimental investigations of precast beam-column joints. These failures occur by developing deep cracks at the intersection of beam and column or diagonal cracks in the panel zone, which is followed by a reduction in strength and stiffness, and an increase in the story drift ratio (Adibiet al., 2019).
Consistent with previous studies (Breccolottiet al.,2016; Ketiyot and Hansapinyo, 2018), the experience of the Bojnord earthquake in Iran on 13th May 2017 (Adibiet al., 2019), reveals considerable effects of beam-tocolumn joints in seismic performance of precast concrete buildings. In this study, the numerical model for the precast beam-to-column connections was used in a three-dimensional modeling of existing precast concrete buildings (PCBs). The PCBs, considered in this study have a lateral load system of precast concrete frames with cast-in-situ concrete shear-walls. Incremental dynamic analysis (IDA) of the 3-, 5-, and 8-story PCBs was conducted to develop fragility curve parameters at four states: slight, moderate, extensive, and complete damage. Next, the potential effects of soil type and construction quality on fragility curve parameters were investigated. Finally, the seismic vulnerability of the PCBs was considered under the seismic design spectrum of the Iranian code, with a return period of 475 years.
2 Selection and design of representative buildings
The models that have been considered are a type of existing precast concrete building that were damaged during the Bojnord earthquake in Iran on 13th May 2017. In this structural system, frames consist of precast columns with corbel and semi-precast beams manufactured in a factory. After placing beams on the top of the corbel, the connectivity between the beam and corbel creates by two shear nuts. Two threaded bars at the top of the beam are passed through the stirrups and two holes in the column. Then the space of the joint and holes in the column is filled with expandable grout.Detailing for the semi-precast beam-column joint is shown in Fig. 1. In these PCBs, Cast-in-place concrete shear walls are used in both directions of the buildings to resist earthquake forces.
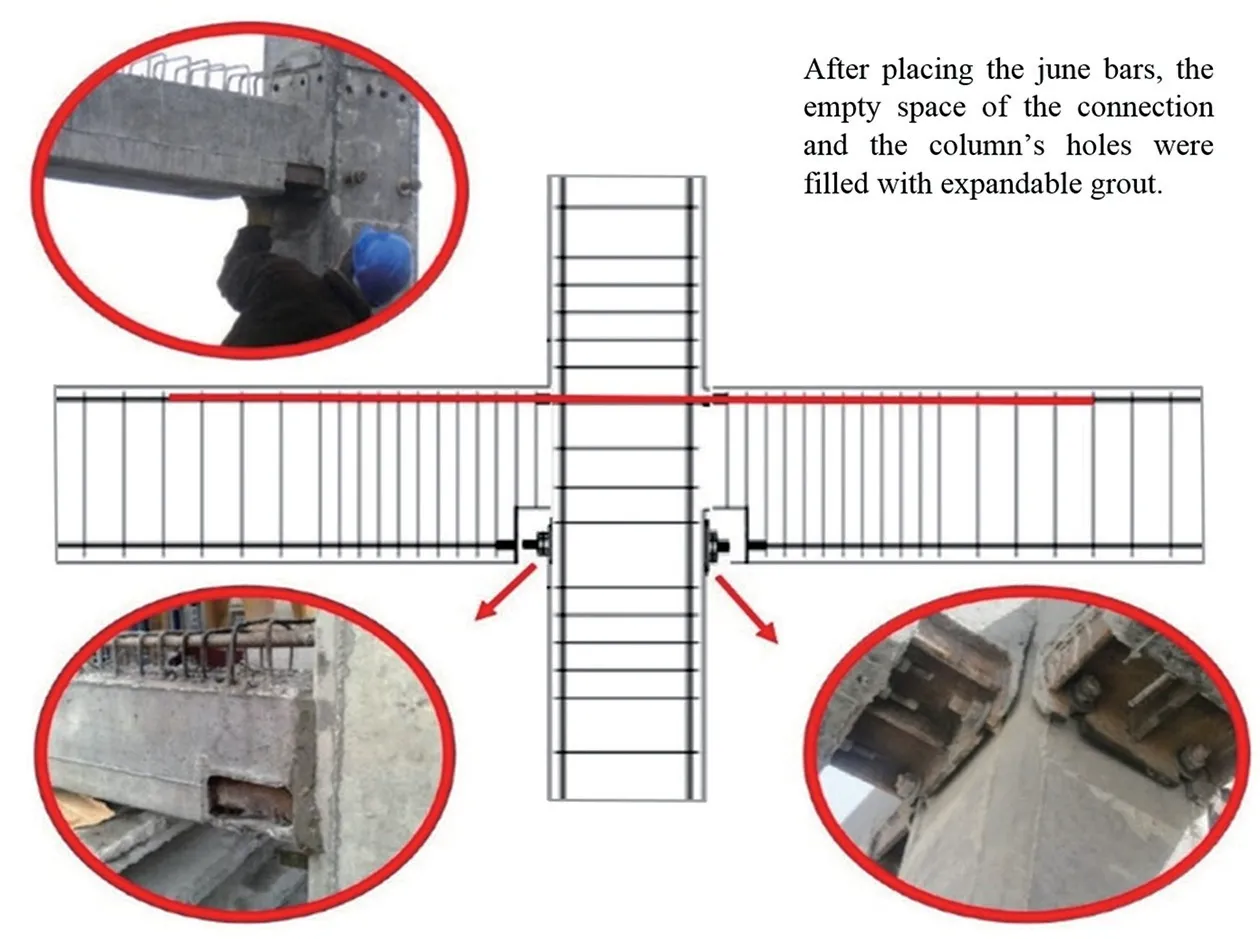
Fig. 1 Detailing for the semi precast beam-column connection(Adibi et al., 2019)
The studied buildings are the existing precast concrete buildings that have 3, 5, and 8 stories, with a story height of 3 m. These buildings were designed and detailed following the requirements of bearing reinforced concrete shear wall systems (Standard No. 2800, 2009). Seismic design forces were calculated using the equivalent lateral force procedure with a peak ground acceleration of 0.35 g, seismic importance factorIe=1.0, and response modification factorR= 5, following the Iranian seismic code (Standard No. 2800, 2009). The average shear wave velocity in the upper 30m of the site is considered to be in the range of 175-375 m/s, corresponding to soil type D in NEHRP provision (FEMA 450-1, 2004).The gravity dead and live loads are 5.8 kN/m2and 2.0 kN/m2for all stories, respectively. The sum of the dead load and 20% of the live load was used as the effective seismic weight of the structures. The design of structural members conforms to the requirements of the ACI-318-05 building code (ACI-318-05, 2005). The plan and 3D views of the buildings are shown in Fig. 2.
Details of the beams, columns, and shear walls sections are provided in Tables 1 to 4, and section geometry and steel reinforcement position are shown in Fig. 3.

Fig. 2 Plan and 3D view of precast concrete buildings (unit: m)
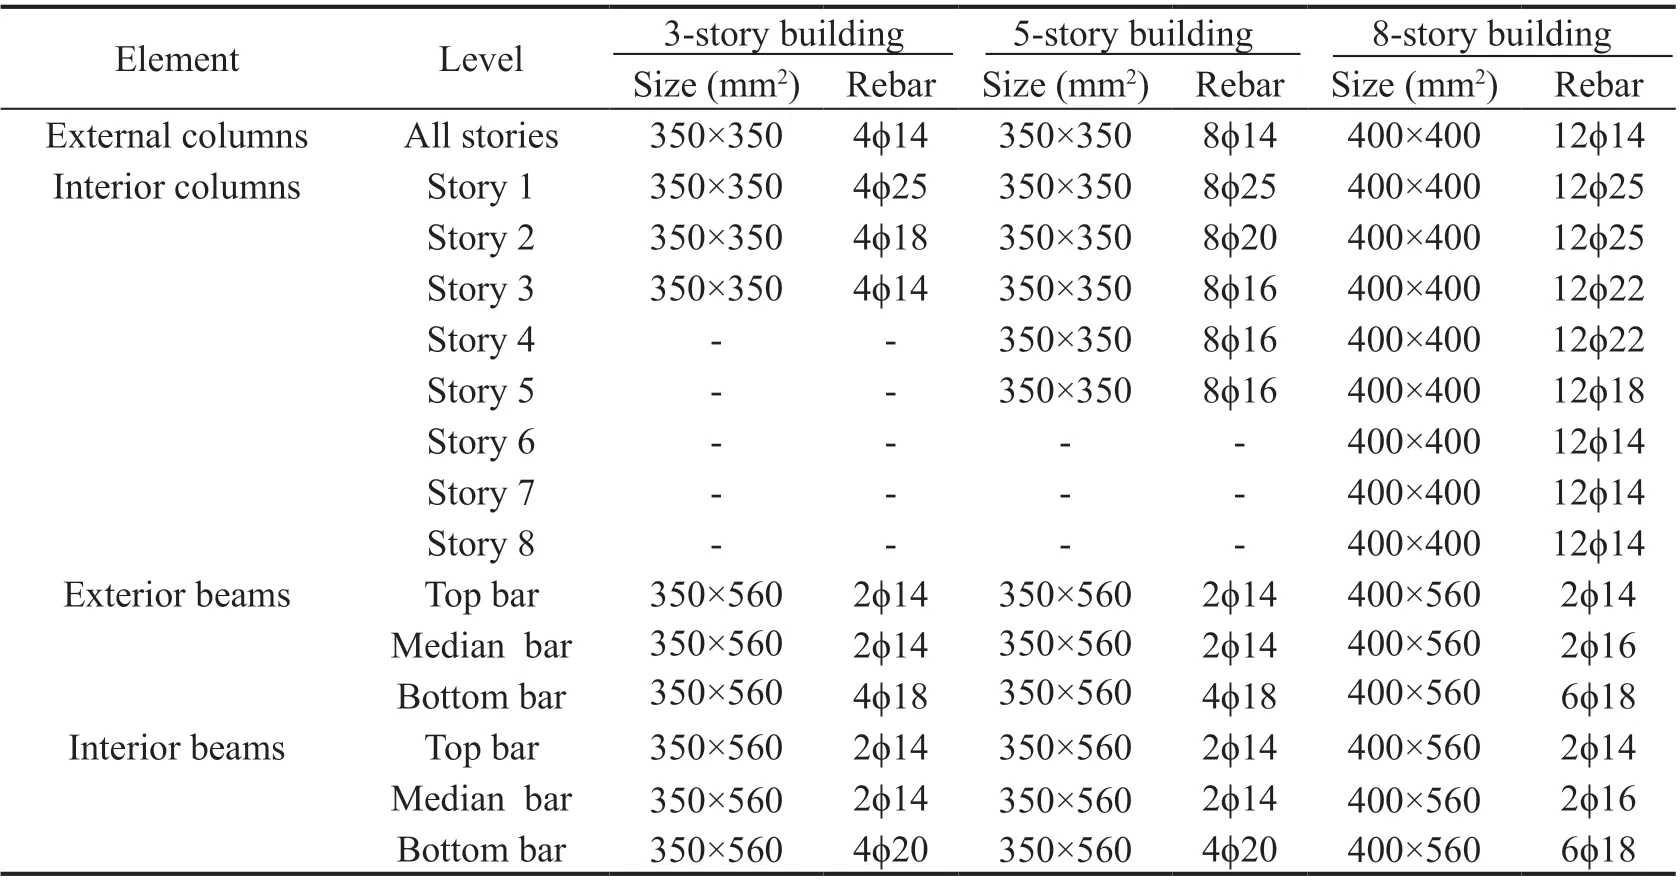
Table 1 Details of precast beams and columns sections of the models used in this study
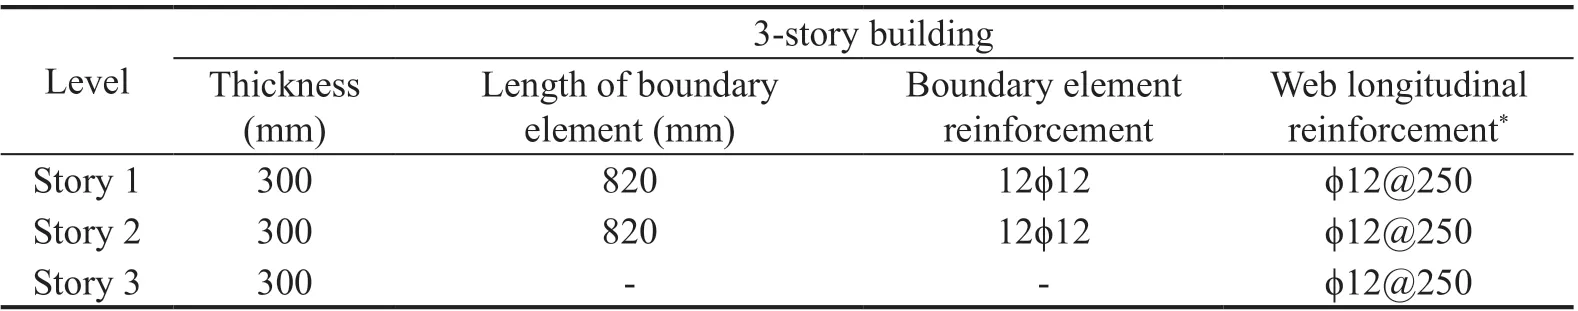
Table 2 Details of the cast-in-situ shear walls of a 3-story building
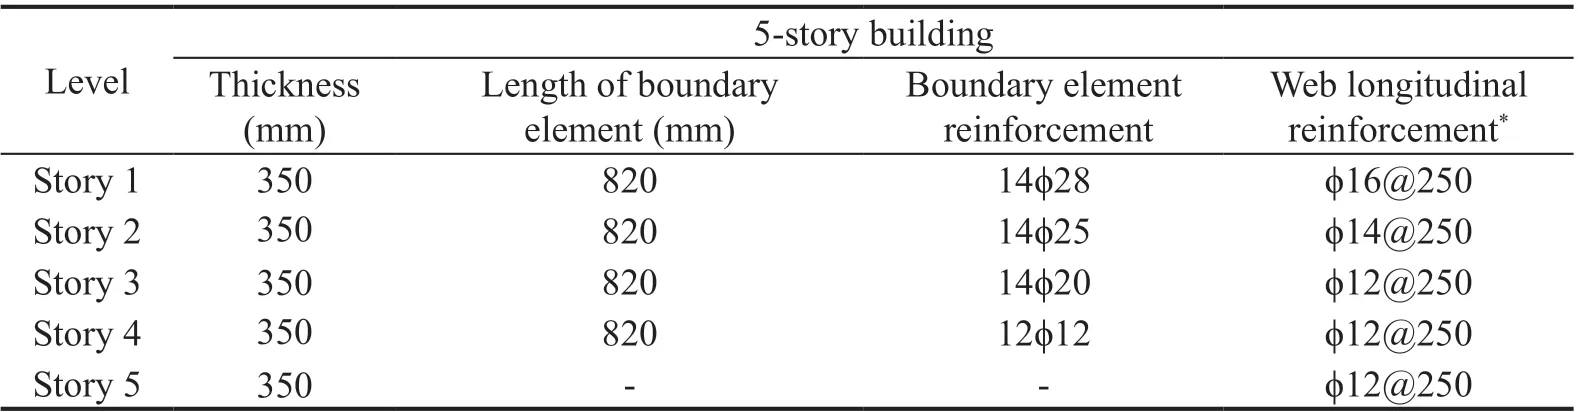
Table 3 Details of the cast-in-situ shear walls of a 5-story building
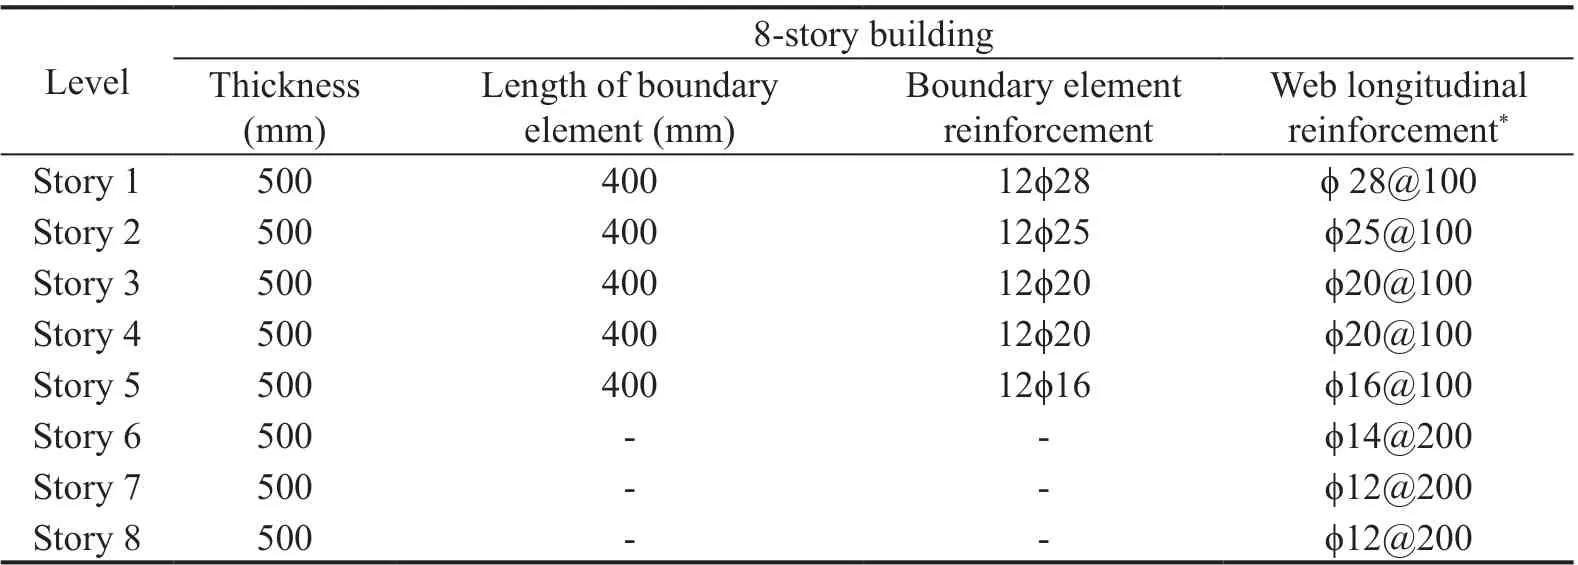
Table 4 Details of the cast-in-situ shear walls of a 8-story building
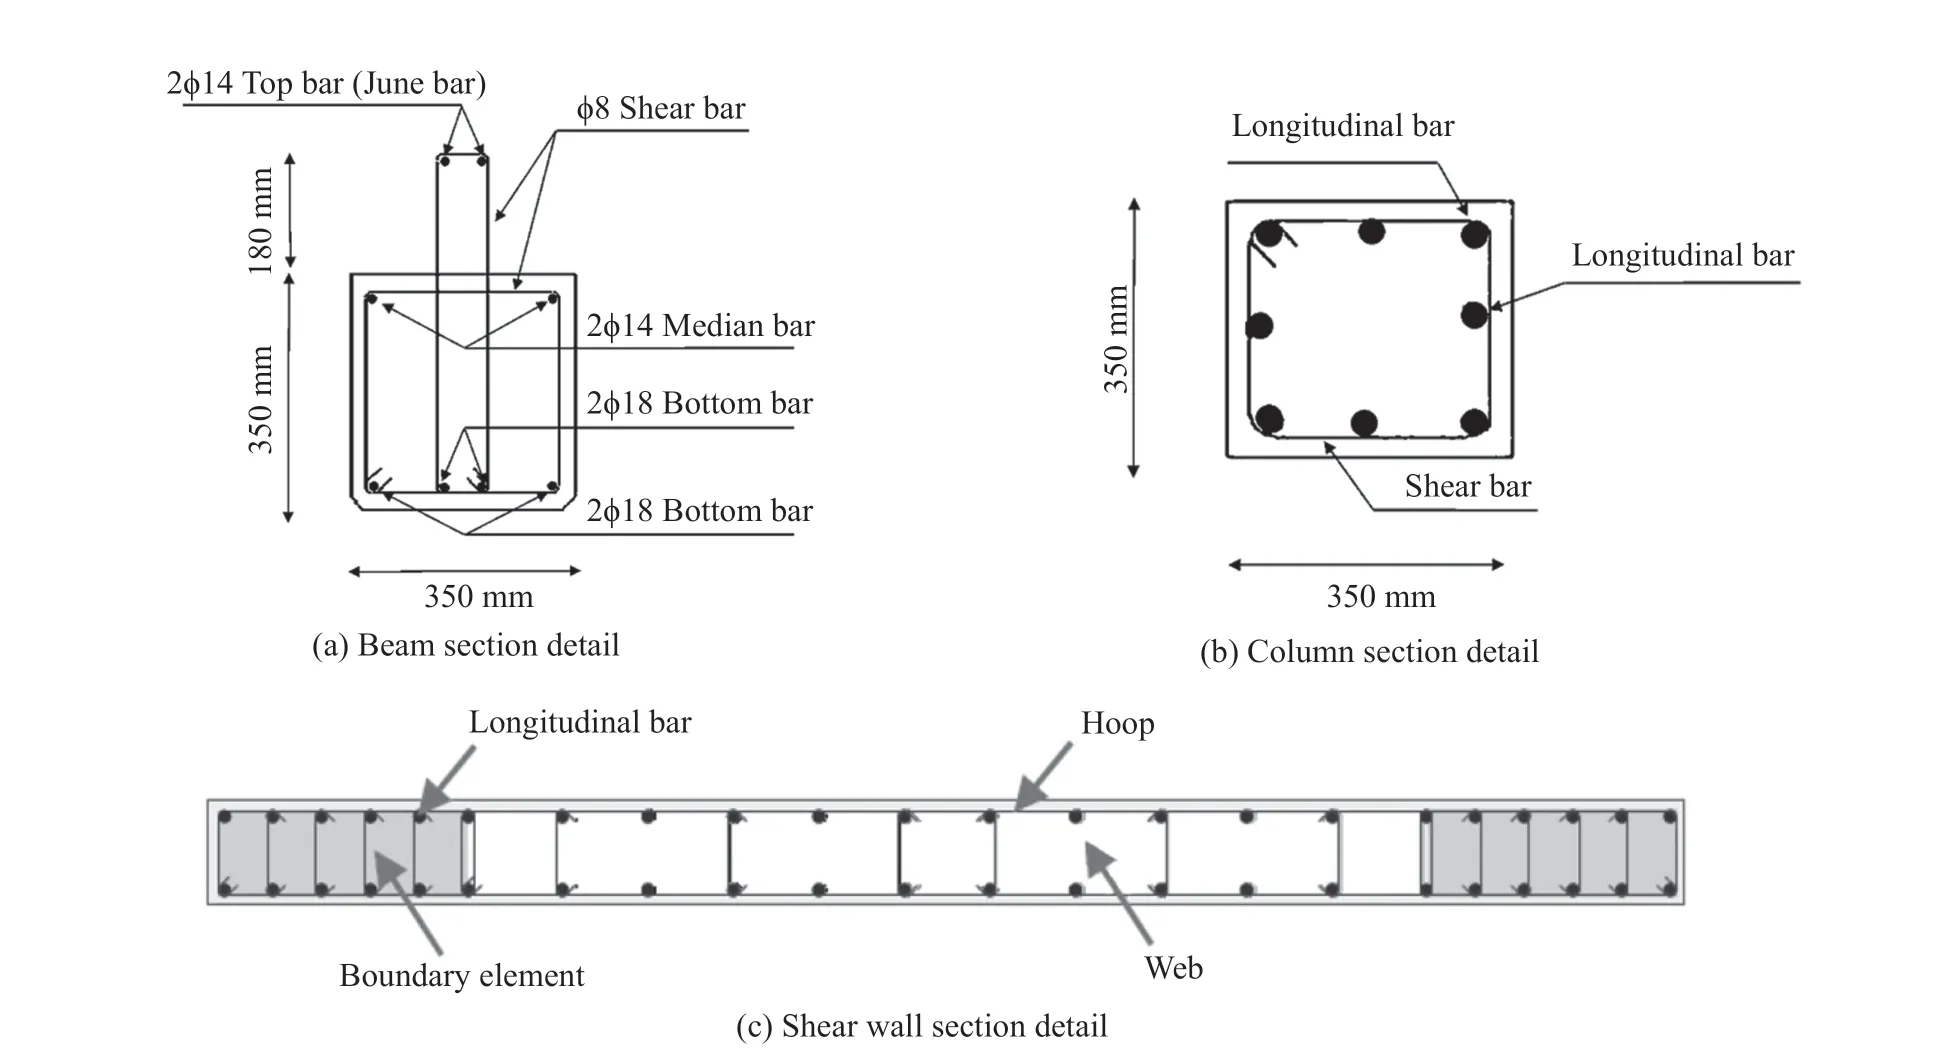
Fig. 3 Details of the beams, columns and shear walls
The buildings were further modified to investigate the effects of construction quality (CQ) on fragility curves. Reconnaissance reports from recent earthquakes,for example, 2009 L′Aquila (Liel and Lynch, 2012),1999 Athens (Dimitriuet al., 2000), Kocaeli (Arslanet al., 2006), and 1992 Erzincan (Saatcioglu and Bruneau,1993), have shown that CQ has considerable effects on building vulnerability. These reports and other studies on this subject reveal that concrete compressive strength and the steel yield strength are two critical parameters in the construction quality affecting the vulnerability of existing RC buildings (Bekir Özer and Altuğ Erberik, 2008; Rajeev and Tesfamariam, 2012).Since concrete shear walls and some parts of the semiprecast connections were constructed in-situ in the PCBs considered in the present study, the quality of construction, as seen in the Bojnord earthquake, is one of the factors influencing the seismic performance of this type of building.
Therefore, the models were built for different material strengths to consider two levels of poor and good construction quality. The lower and upper limits for material strength were determined by considering the properties of steel bars and concrete materials used in related studies (Bekir Özer and Altuğ Erberik, 2008;Rajeev and Tesfamariam, 2012), and in the existing PCBs in Iran. As shown in Table 5, concrete compressive strength values of 25 MPa and 15 MPa, and steel yield strength values of 400 MPa and 240 MPa were used for good and poor CQ, respectively. In fact, the lower and upper limits of the probable strength for concrete and steel bars were used for these two levels of construction quality. The first three mode periods of the structures for each CQ can be found in Table 6.
3 Nonlinear simulation methodology
Three-dimensional models for 3-, 5-, and 8-story PCBs were created by using OpenSees software(OpenSees, 2016). The precast beam and column elements and cast-in-situ shear-wall elements were modeled using the displacement-based beam-column element represented by the fiber-type section model.The relationships provided by Manderet al. (1988) were used to define the confined and unconfined concrete materials. Fixed based shear-walls and a rigid floor diaphragm were used in the models. P-Delta effects and 5% Rayleigh damping were considered in the numerical model (Hall, 2006; Petriniet al., 2008).
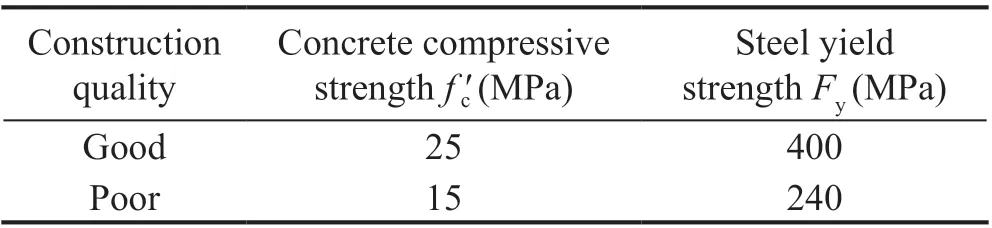
Table 5 Concrete compressive strength and steel yield strength for different levels of construction quality
As can be seen in Fig. 4, the nonlinear behavior of the precast beam-column joints was simulated by a model developed in our previous research (Adibiet al.,2019). This numerical model was calibrated using the results of two experimental specimens (Rezaeiet al.,2015; Bahrami and Madhkhan, 2017). The cracking pattern in the experimental specimens, shown in Fig. 5,reveals that the dominant damage modes in both of the exterior and interior precast joints are concentrated at the end of beams near the column face and on the corbel. Additionally, cracking throughout the beams and columns is negligible and diagonal cracking in the panel zone is not crucial. Therefore, it can be assumed that the nonlinear behavior of the connection is controlled by the beam end sections (Adibiet al., 2019). Nonlinear rotational springs at the end of the beams were used to introduce the nonlinear response of the substructure. The panel zone was modeled by rigid elements. For the beamcolumn interface springs, moment-rotation behavior can be calculated through a quasi-fiber section or macro modeling (Adibiet al., 2019; Fenget al., 2019).
In the unit-length fiber section element, details of slipping of the bars throughout the concrete and the joint are required; this study does not concentrate on this particular issue. The macro-modeling of the substructure was developed based on the dominant damage-mode and on the hysteresis responses of the experimental specimens to simulate the behavior of beam-column joints. For this model, the rotational spring parameters are provided in Fig. 6, in which yield rotation can be calculated as follows:
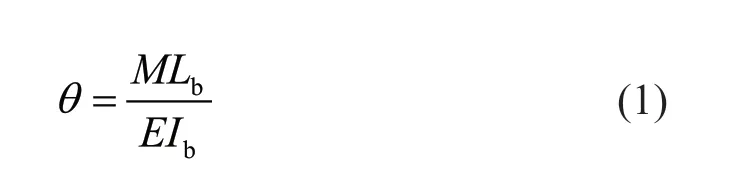
whereM,Lb,E, andIbare the flexural moment, length,modulus of elasticity, and moment inertia of the adjacent beam, respectively. Also, presented in Table 7 are the nonlinear parameters of the rotational spring, calculated by calibration of the model with the experimental behavior of the two previously mentioned specimens.
The numerically predicted response is compared with the corresponding experimental outcomes in Fig. 7.As can be observed, the proposed model can predict the experimental responses of the subassembly reasonably well.
Considering that the panel zone is molded by rigid elements and that the nonlinear rotational springs at the end of the beams control the seismic behavior ofthe connection, this beam-column joint model can be used for three-dimensional modeling of structures. For example, for an internal beam to column connection,the panel zone was modeled rigidly, and four nonlinear springs placed at the end of each beam near the column face were used to model the four-way beam-to-column connection.
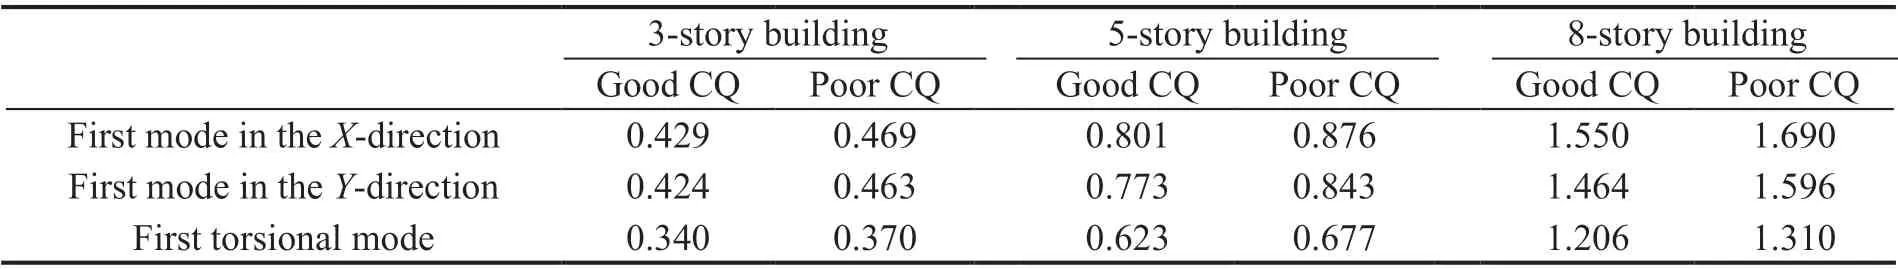
Table 6 The first three mode periods of the structures for good and poor construction quality
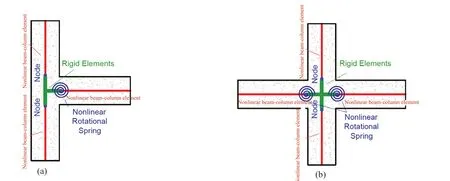
Fig. 4 Details of modeling the precast beam-column connection for (a) exterior joints (b) interior joints

Fig. 5 The crack pattern of the exterior and interior beam-column joints (Bahrami and Madkhan, 2017; Rezaei et al., 2015)
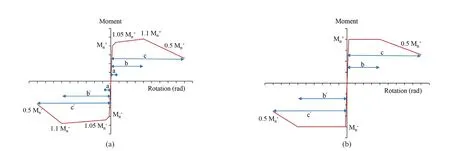
Fig. 6 The nonlinear model for (a) exterior joints (b) interior joints (Adibi et al., 2019)
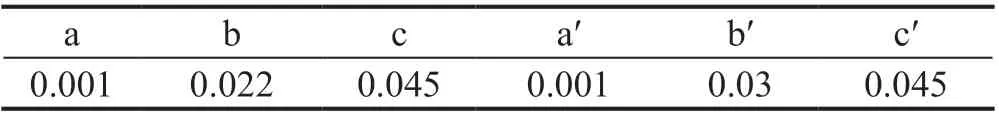
Table 7 Plastic deformations of the spring for modeling of exterior and interior beam-to-column joints (in radian) (Adibi et al., 2019)
Shear walls were modeled using the fiber beamcolumn element. Many researchers have shown that this element can successfully capture the nonlinear static and dynamic responses of concrete shear walls(Luet al., 2015; Wanget al., 2020). The axial-flexure behavior of the concrete shear wall is modeled through the fiber section. The fiber section, consistent with the assumption of the plane section, is composed of confined and unconfined concrete fibers, plus bar fibers (Fig. 8).
The shear behavior of the concrete walls was defined using the uncoupled shear section property with the equivalent linear response. The equivalent shear stiffness,ksh, was calculated with the reduced shear modulus of cracked concrete to consider the flexureshear interaction indirectly (Wanget al., 2020);
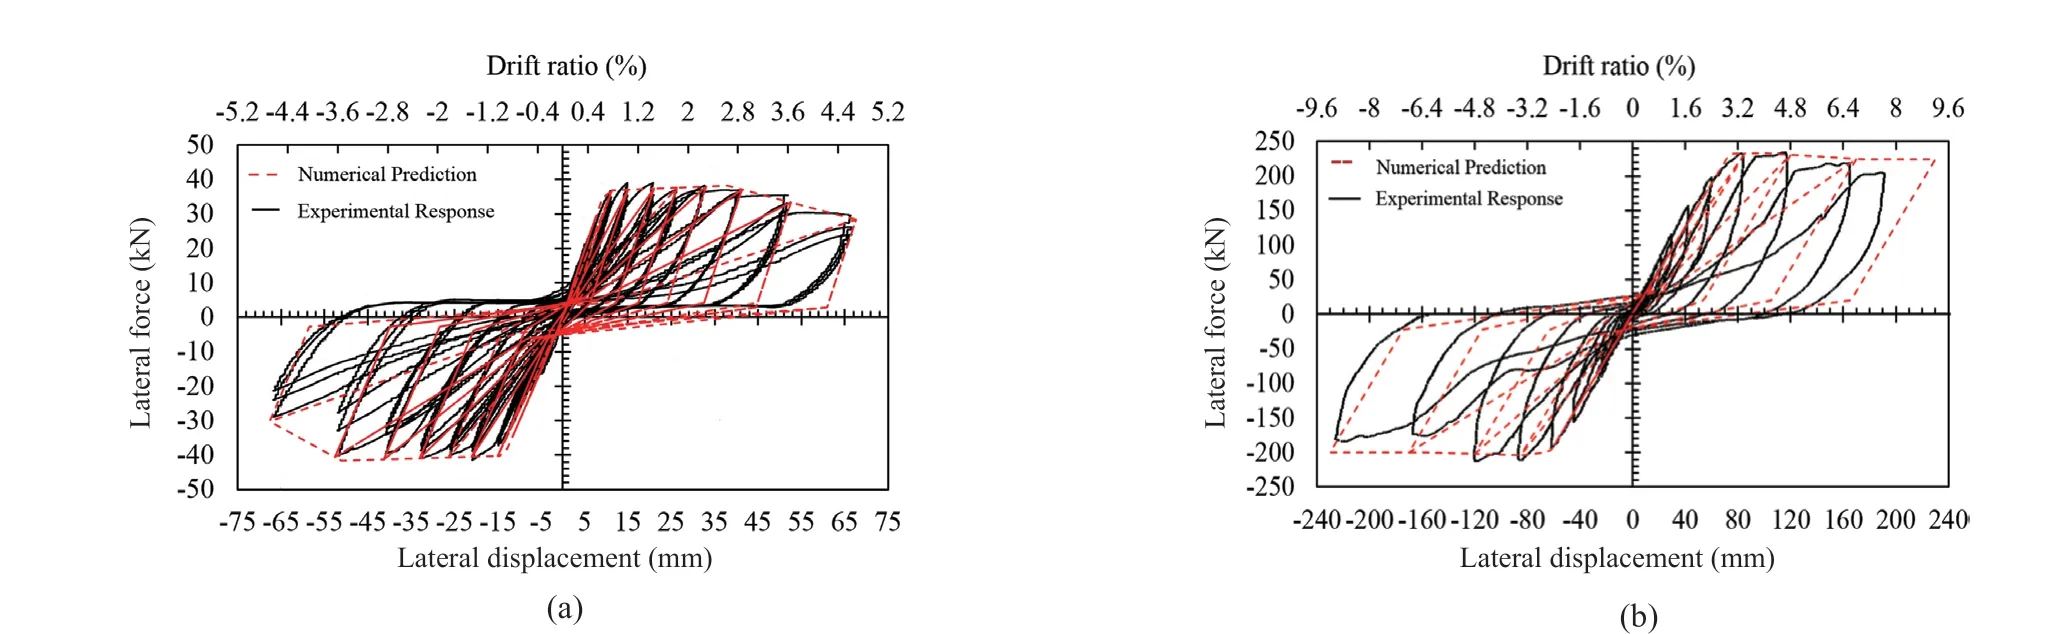
Fig. 7 Comparison between the simulated load-displacement responses with the observed experimental results of (a) exterior joints(b) interior joints (Adibi et al., 2019)
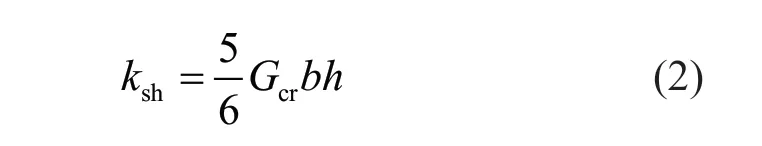
wherebandhare the section width and height,respectively,Gcris the reduced shear modulus of cracked concrete, calculated according to Rahal (2010).
Modeling of the shear walls was calibrated by the experimental study done by Tayloret al. (1996).Adaptation of the hysteresis lateral load-displacement responses between the experimental specimen and analytical model is displayed in Fig. 9.
4 Incremental dynamic analysis
Results of the incremental dynamic analysis are sensitive to ground motion records selected for analyzing the models. Magnitude, source-to-site distance, and soil type are the most important parameters influencing the ground motion record characteristic. To avoid bias in the results, records in this study were compiled so that their magnitudes and source-to-site distances follow a normal distribution. Two earthquake record sets were used for IDA, corresponding to soil types C and D of the NEHRP provisions, to consider the soil type effects. Each record set includes 20 pairs of horizontal ground motion records, 40 individual components, selected from record sets proposed by the FEMA P695 (2009). Slight changes were made to the FEMA record sets to correspond with the condition of soil types C and D.
It is worth noting that the existing PCBs considered in this study were designed using the earthquake loads obtained from the design response spectrum of soil type D. Since some PCBs are located on soil type C,in addition to soil type D, two record sets were used to determine how different soil types (soil types C and D)affect the fragility curve parameters. Separate far and near-field record sets were not used. It is not the purpose of this study to examine the potential effects of near-fault directivity, pulse-like ground motions on the fragility curve parameters. However, to develop fragility curves that are general and not specific to a particular type of earthquake record, each record set includes an equal number of far and near-fault records. In addition, nearfault records equally include both pulse-like and nonpulse-like types. Details of each earthquake record set can be found in Appendix A.
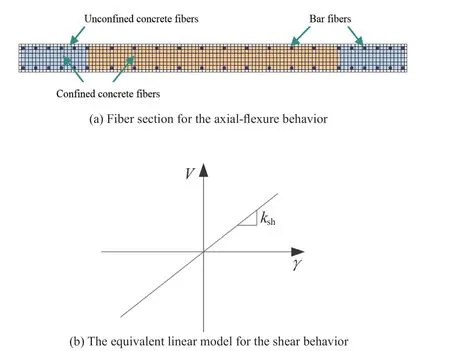
Fig. 8 Fiber section model used for concrete shear walls

Fig. 9 Calibration of the analytical model assigned to the shear walls by the experimental work by Taylor et al. (1996)
Incremental dynamic analysis of the PCBs, subjected simultaneously to seismic excitations in two orthogonal directions, was conducted for the two above-mentioned record sets. The stronger component of each ground motion pair was applied along the direction in which the building periodT1was determined. The 5% damped pseudo-spectral acceleration at the first mode period of the building,Sa(T1), was used as the intensity measure to scale the stronger component of each record pair to various intensities. The same scaling factor was used for the weaker component of the time histories to preserve the as-recorded relationship between the components.The parameter ofSa(T1) was used for scaling the records because it has two essential characteristics: sufficiency and efficiency, particularly for short and moderateperiod buildings (Shomeet al., 1998; Yeet al., 2013;Onvani and Yahyaabadi, 2021). Additionally, seismic hazard curves in terms ofSa(T1) are available in most regions of the world.
For each pair of the records, the intensity was increased until numerical non-convergence is observed,indicating global dynamic instability. Results of IDA under each ground motion record pair can be used to plot an IDA curve. IDA curves describe the IM value versus the structural response referred to as engineering demand parameter (EDP). The selected EDP should be able to estimate the damage to structural and nonstructural components and systems. The structural response parameter used as the EDP in this study is the peak maximum of the story′s drift (θmax, peak response over time, and maximum over the height of the structure)in two orthogonal directions of the building.
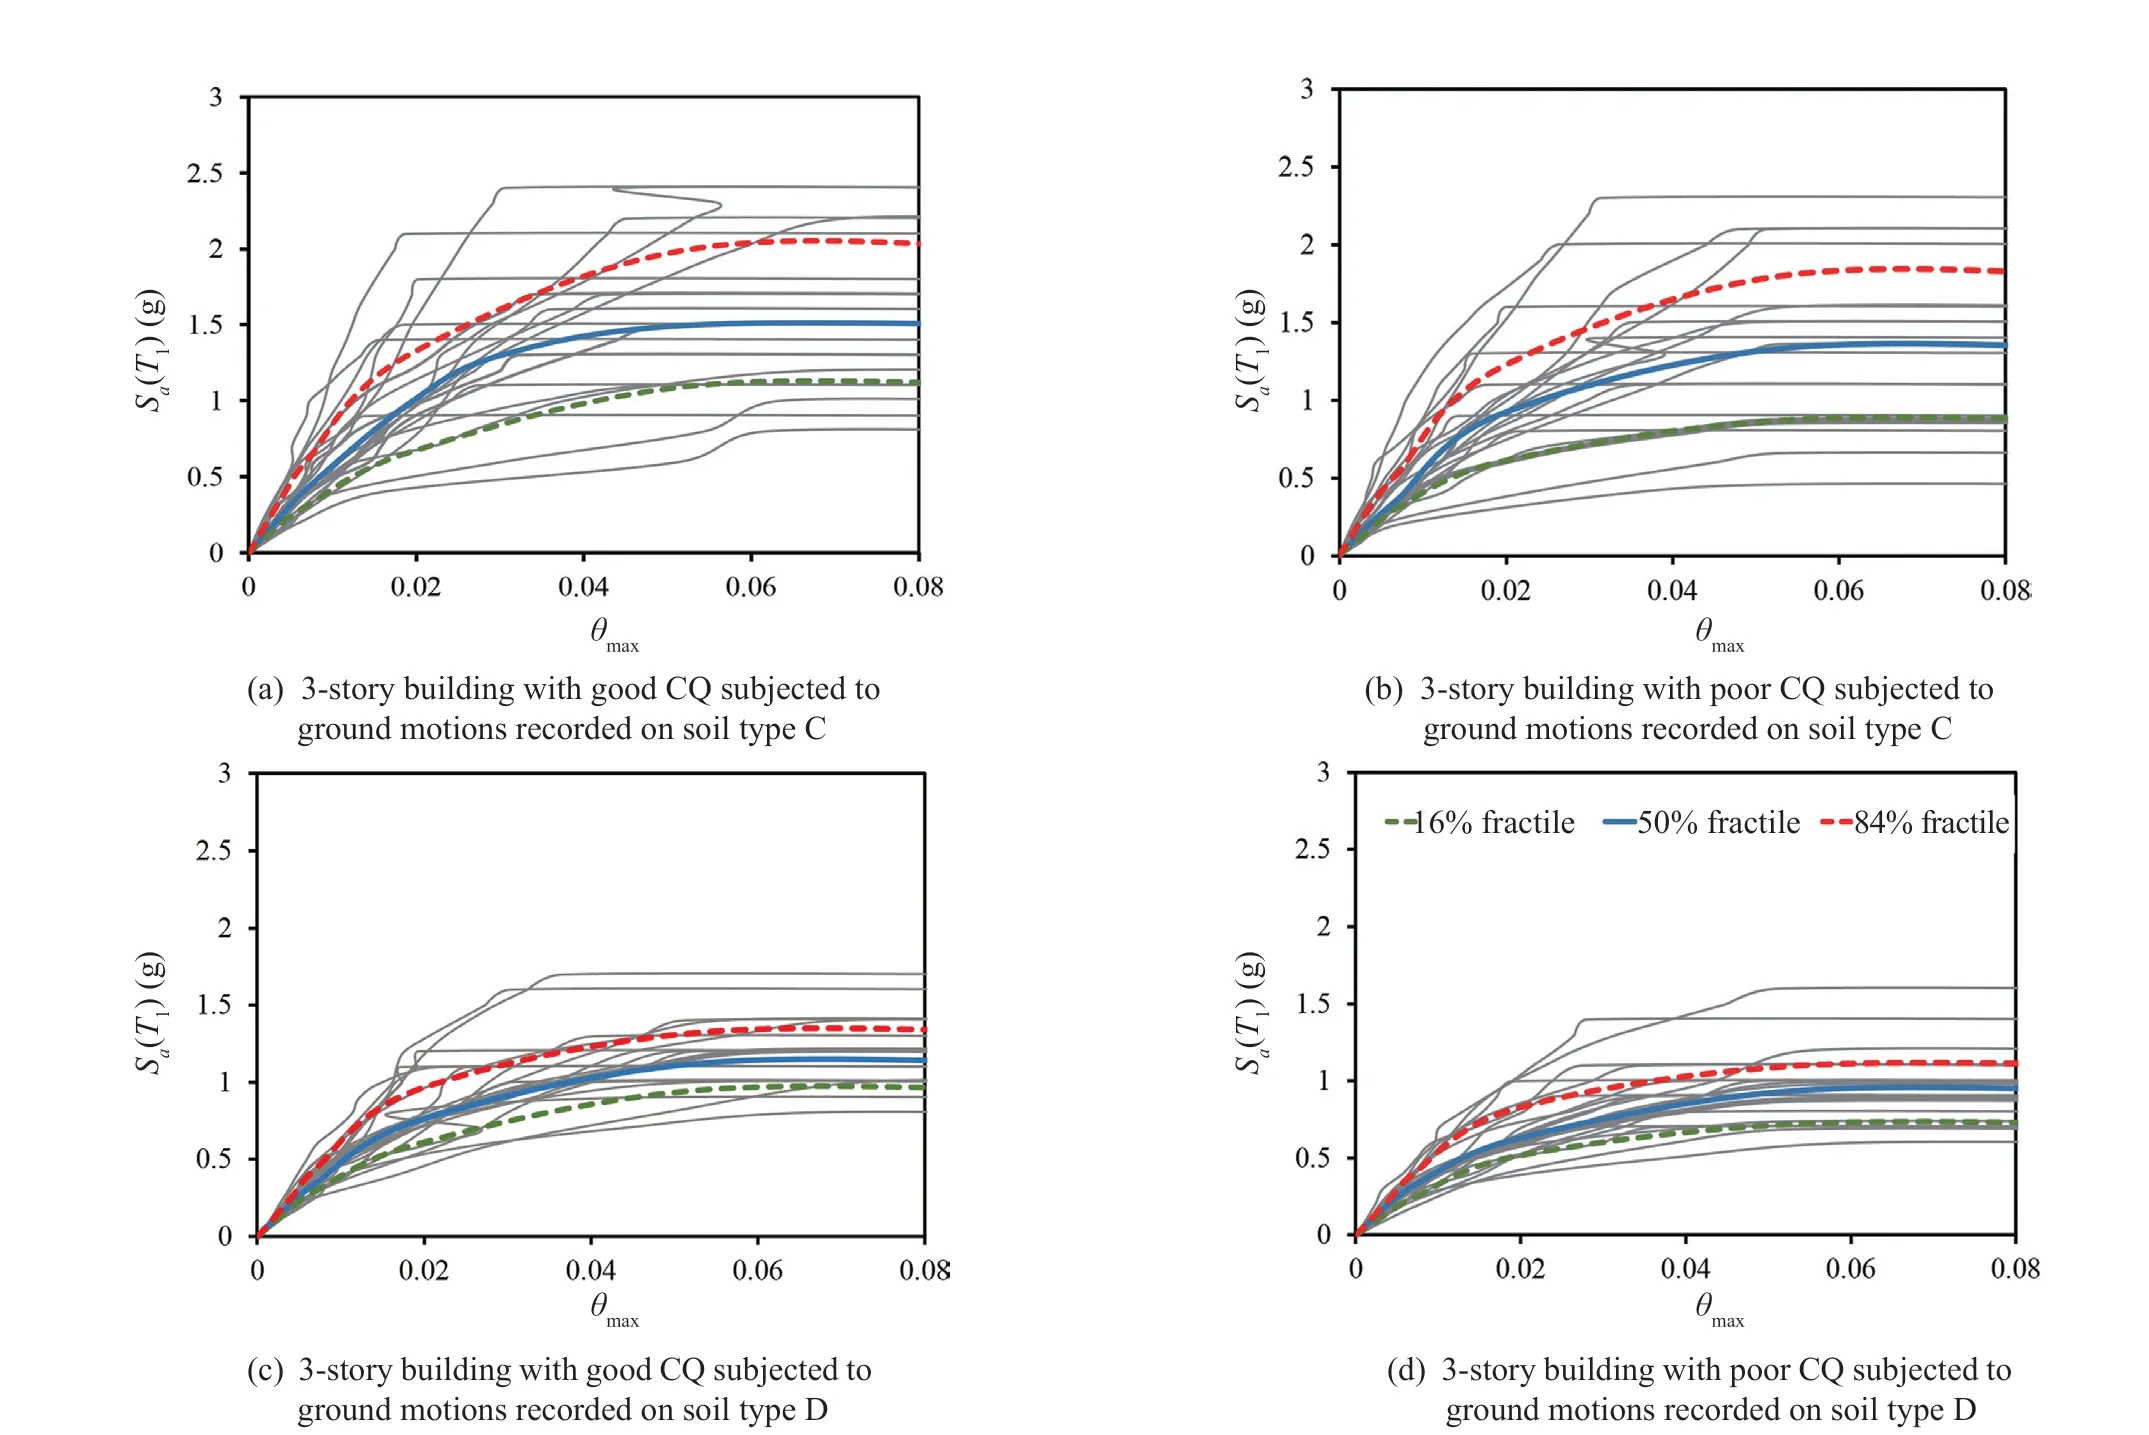
Fig. 10 Result of IDA for the 3-story building with good and poor construction quality for two earthquake record sets
Figures 10 to 12 show the IDA curves for each of the 3-, 5-, and 8-story PCBs, respectively. These figures are provided for two sets of earthquake ground motions,recorded for soil types C and D, and two levels of good and poor construction quality. To summarize the IDA curves into 16%, 50%, and 84% fractile curves, stripes of IM-values were calculated at several levels of the EDP,and the 16%, 50%, and 84% fractile IM values given the EDP-level were estimated. Fifty percent fractile curves were used to determine the ultimate capacity of the 3-,5-, and 8-story buildings. Ultimate capacity refers to the capacity at which the local slope of the IDA curve reaches zero.
The ultimate capacities of the PCBs are provided in Table 8 for good and poor quality of construction, as well as soil types C and D. The following conclusion can be drawn from the data included in this table:
• Soil type does not affect the ultimate capacity of the 5- and 8-story buildings, while the ultimate capacity of the 3-story building with good CQ decreased from 1.5 g to 1.12 g due to changing the soil type from C to D. For poor CQ, the corresponding value decreased from 1.33 g to 0.94 g.

Fig. 11 Result of IDA for the 5-story building with good and poor construction quality for two earthquake record sets
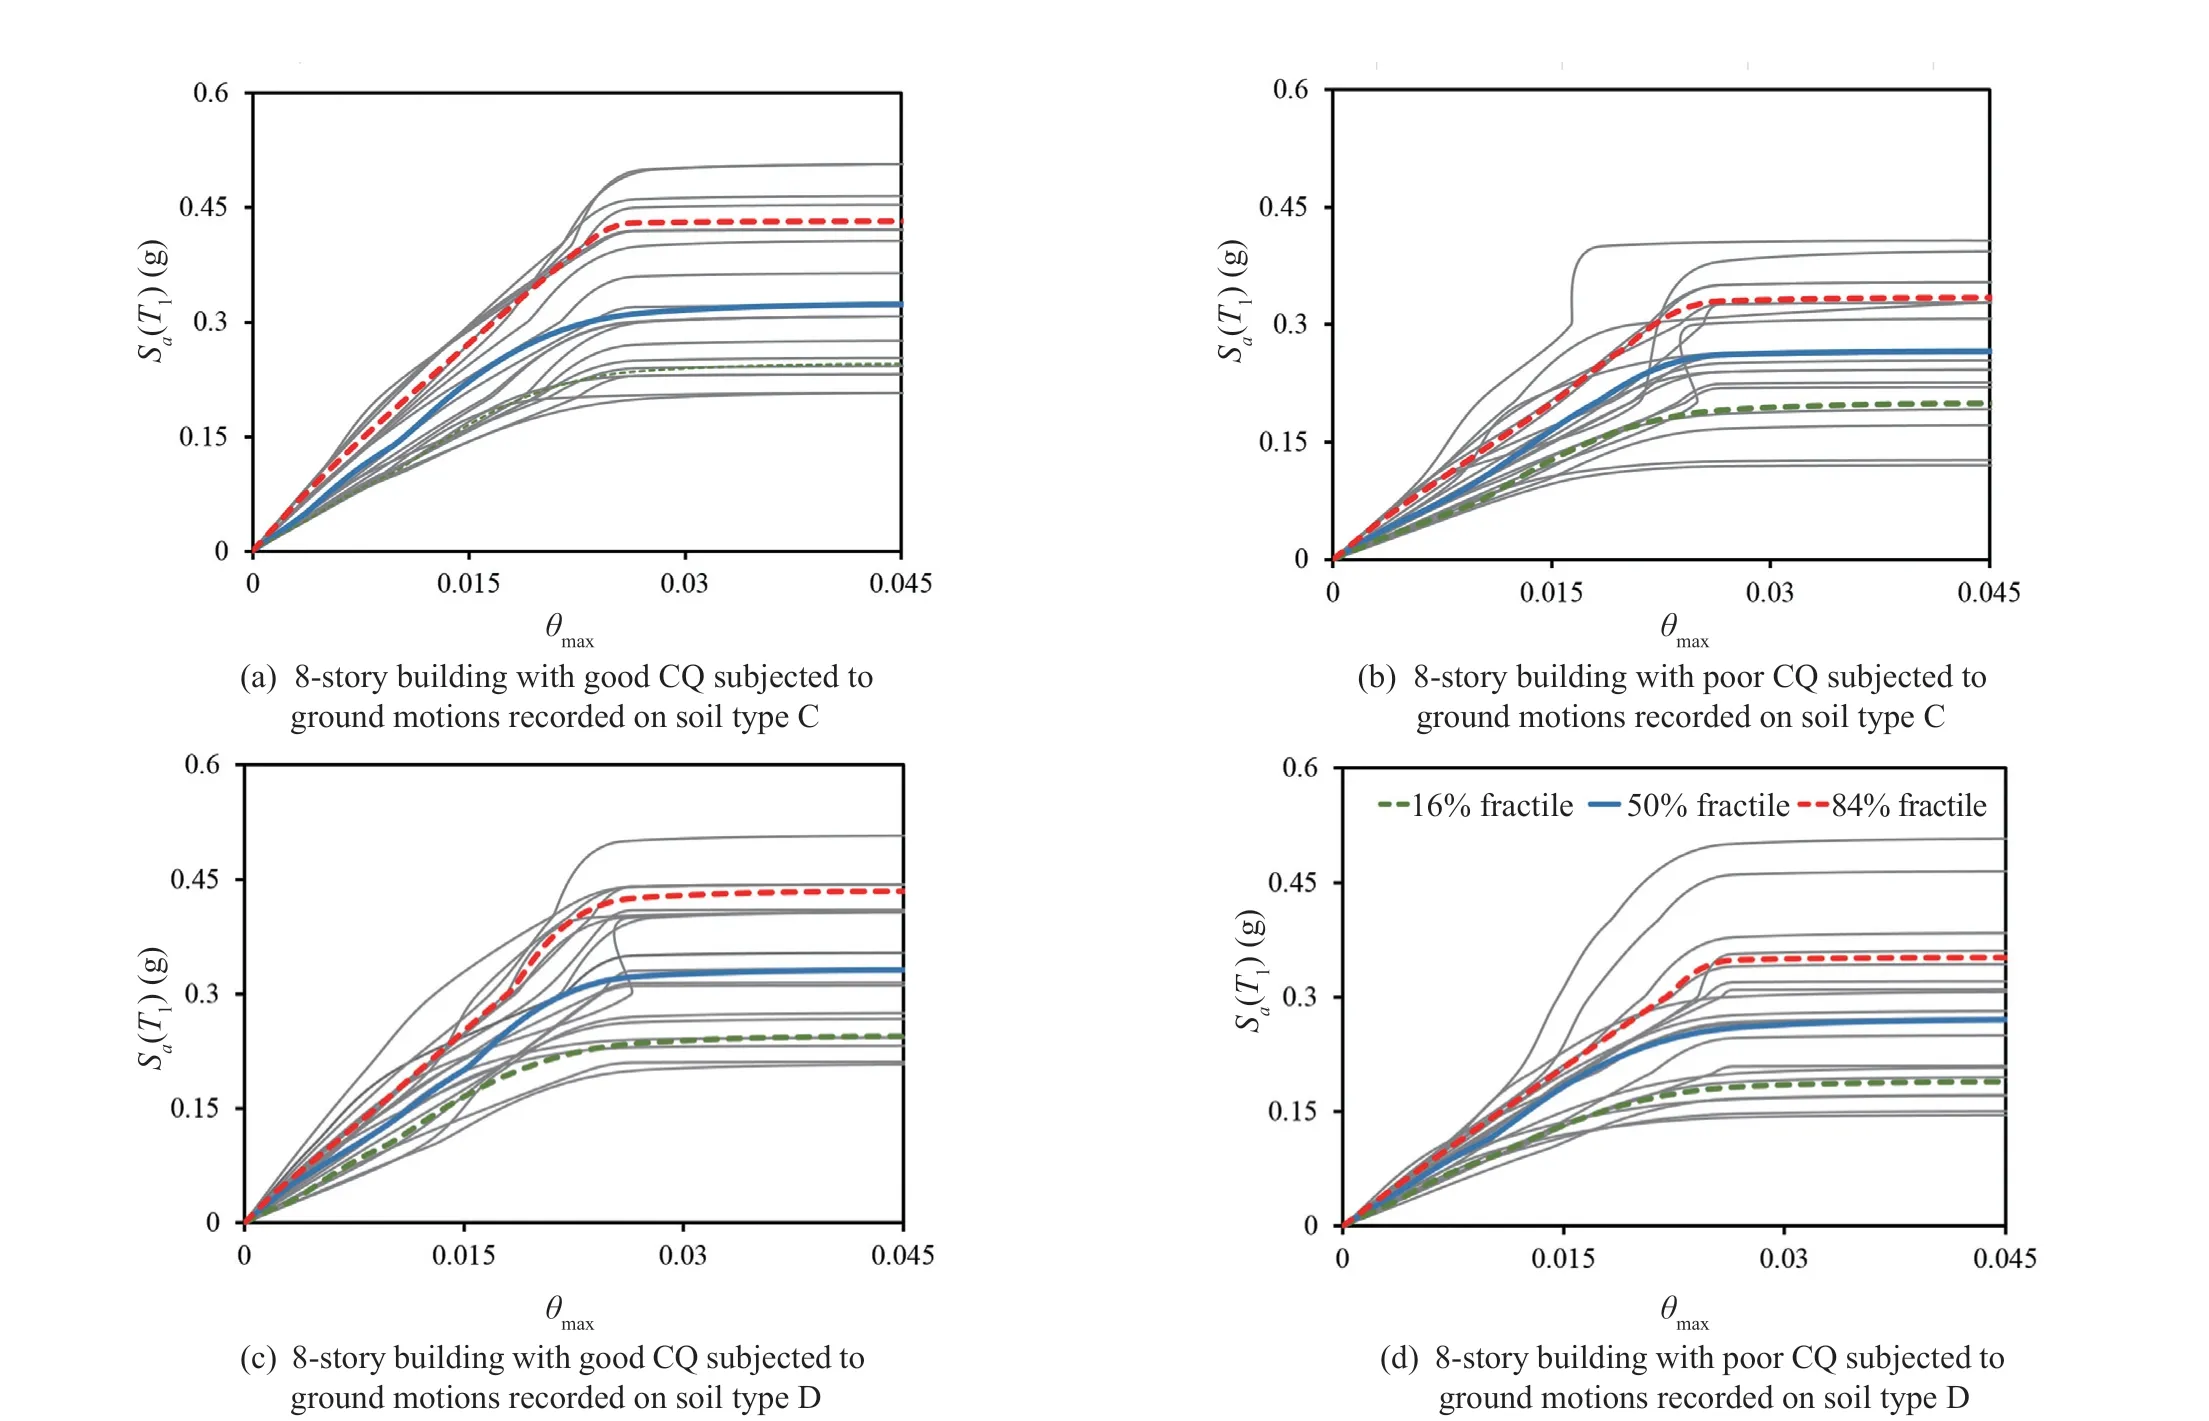
Fig. 12 Result of IDA for the 8-story building with good and poor construction quality for two earthquake record set
• Construction quality has an unavoidable effect on the ultimate collapse capacity of the buildings in question. The average value of the ultimate capacities obtained for soil types C and D can be calculated for each building to consider the construction quality effect.The average ultimate capacities of the 3-, 5-, and 8-story buildings are equal to 1.31 g, 0.95 g, and 0.32 g for good quality construction, which are reduced to the values of 1.13 g, 0.8 g, and 0.26 g for poor quality construction,respectively. By changing construction quality from good to poor, the ultimate capacity of the buildings decreases, on average, by 16%.
5 Damage limit states
A damage state is defined as a threshold condition of buildings corresponding to a certain level of damage under the influence of an earthquake. Although the building damage continuously varies with seismic demand, it is described by ranges of damage for a practical reason.HAZUS classifies structural damage into four discrete damage states: slight, moderate, extensive, and complete collapse (HAZUS-MH MR4, 2004). The definition of these four damage states is provided for various buildings categorized based on the structural system type and material. In HAZUS, buildings having a lateral load resisting system of precast concrete frames with concrete shear walls are defined by a short description of PC2. For better classification concerning structural height, it is subdivided to PC2L, PC2M, and PC2H, as presented in Table 9. Descriptions of these buildings in HAZAUS are similar to the details of PCBs in this study.As defined in HAZUS, these buildings are composed of precast concrete beams and columns with precast or cast-in-place concrete shear walls and slabs. The girder frequently sits on a column corbel. Prefabricated elements and corbels are often connected by steel plates.
The structural damage states for the building type PC2 are described as follows (HAZUS-MH MR4,2004). In slight damage, most shear walls experience diagonal hairline cracks on their surfaces, and a few connections experience minor concrete spalling. In a moderate damage state, diagonal cracks appear on most shear walls, and larger cracks with concrete spalling at wall ends can be observed at some shear walls. In this damage state, distress or movement can be found at the beam to column connections. In an extensive damage state, shear walls exhibit buckled reinforcement and large diagonal cracks surrounded by extensive concrete spalling. Additionally, failure can be observed on some frame connections. In complete structural damage, shear walls or beam to column connections fail, leading to collapse or imminent danger of collapse.
Since no direct observation of physical damage was available in the numerical simulation, inter-story drift ratios are suggested by HAZUS to quantify the abovementioned physical descriptions of structural damage.Based on the pushover analysis of the generic building types, HAZUS suggests the appropriate value of the interstory drift ratio for each damage state of the structural system, following the deformation limits provided by NEHRP guidelines for structural components and elements (FEMA 450-1, 2004). In this regard, the following four issues have been considered in HAZUS:inherent conservatism in NEHRP limit states defined for design, quantifying the physical damage states by component deformation limits, the difference between local and global damage, the difference between collapse at component levels and collapse at the structural level(HAZUS-MH MR4, 2004).
The precast concrete buildings considered in this study have no irregularities in plan and elevation or any other factors that significantly affect their seismic performance. Therefore, the HAZUS provisions were used to determine the threshold values corresponding to various damage states (HAZUS-MH MR4, 2004).It should be mentioned that the threshold values of drift ratios for each model building type are provided for high-code, moderate-code, low-code, and pre-code seismic design levels in HAZAUS (HAZUS-MH MR4,2004). In this study, the seismic design level was chosen by considering which version of the Iranian code was used for designing the existing PCBs. Considering that the PCBs have been designed to conform to the third edition of the Iranian seismic design code, published in 2009, the moderate-code level was selected to determine the inter-story-drift-ratio corresponding to various damage states.
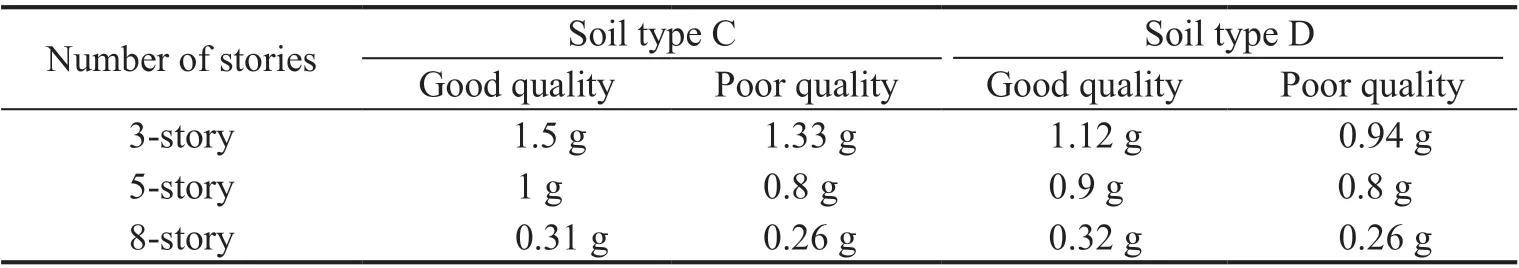
Table 8 The ultimate capacity of the PCBs based on IDA results in terms of Sa(T1)
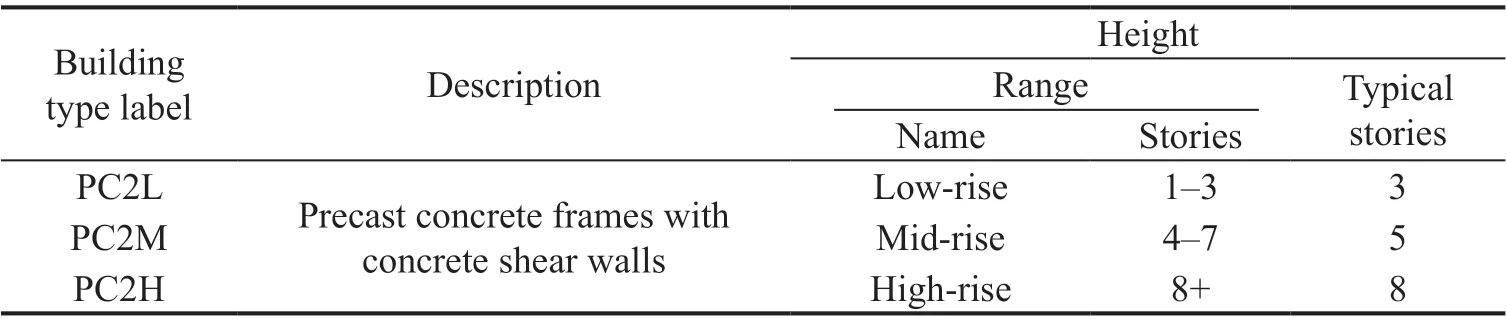
Table 9 Definition of the PCB in HAZUS-MH MR4 (2004)
Table 10 provides the inter-story-drift-ratio for the damage states of slight, moderate, extensive, and complete for the PCBs. It should be mentioned that the complete damage state is identified via either detecting non-convergence in dynamic response or exceeding the drift values of 0.0530, 0.0350, and 0.0263 for the 3-, 5-,and 8-story concrete precast buildings, as listed in Table 10.
6 Choosing the best-fitted model for limit state capacities
Fragility curves are used in seismic vulnerability assessment to estimate the probability of exceeding the pre-defined damage states, i.e., slight, moderate,extensive, and complete collapse (Izanlu and Yahyaabadi,2019). The IM-based solution strategy can be used to drive the annual frequency of exceeding a limit state.According to the total probability theorem, limit state frequency can be decomposed into the conditional frequency of exceeding a limit state for a givenIMand the frequency of exceeding theIM. Finally, the results can be composed by integration over allIMvalues as follows (Jalayer and Cornell, 2003):

whereIMcrepresents the limit state capacity expressed in terms ofIM, andλIMis the mean annual frequency of the ground motion intensity measure. The termP(im≥IMc),referred to as the fragility function, is the probability that an intensity measure exceeds the limit state capacity.
To develop fragility functions, the specific values of the inter-story drift ratio that represent the threshold of discrete damage states were determined based on the HAZAUS suggestion for PC2-type buildings,as described in section 5. Next, the inter-story drift threshold value was converted to spectral response coordinates (i.e., the same coordinate as those for the seismic hazard curves). For this purpose, IDA curveswere used to determine theSa,cvalues corresponding to the designated inter-story drift value.

Table 10 Inter-story drift ratio for various structural damage states (HAZUS-MH MR4, 2004)
TheSa,cvalues were fitted to various probability distribution functions to find the best fit model for defining the fragility functions. The Kolmogorov-Smirnov test was conducted as the most used goodness-of-fit test to rank the fitted distributions according to the quality of fit over theSa,cvalues (EasyFit-software, 2010). Tables 11 provides the results of the Kolmogorov-Smirnov test for the distributions of Lognormal, Weibull and Rayleigh,fitted to the data samples of limit state capacities for soil type C. In this table, the distance between the data and fitted distribution is presented in terms of goodnessof-fit statistics. Considering that the distribution with minimum statistical value has been best fitted with data,a ranking number is assigned to each distribution. The average rank value for each distribution was computed for all data samples of limit sate capacities, as presented in the last row of Table 11.
It can be concluded that the distributions of Weibull,Lognormal, and Rayleigh with average rank values of 1.83, 2, and 2.17 have the best fit with the limit state data, respectively. Similarly, the ranking was done for distributions fitted to different data samples of limit state capacities for soil type D. For this soil type, the average rank values of 1.87, 1.71, and 2.42 are obtained for the Weibull, Lognormal, and Rayleigh distributions,respectively. Generally, the Weibull and Lognormal distributions can be used as the best fit models to describe the probabilistic framework for all limit states and all cases considered here. Figure 13 provides, for instance,the collapse fragility curves of the 8-story building with good and poor construction quality for the records of soil types C and D. It can be observed that there is no significant difference between the accuracy of Lognormal and Weibull distributions in collapse capacity prediction.However, the accuracy of the Weibull distribution is better than the lognormal distribution, especially for the intensities that are more than one standard deviation away from the median collapse capacity. This is consistent with the study done by Mandalet al. (2016).In that study, they showed that other non-logarithmic probability distribution functions are not significantly superior to the lognormal fragility model used in practice.As discussed in the following section, the lognormal distribution was selected to develop the fragility curves because of its widespread use in other studies.
7 Development of fragility curves for various damage states
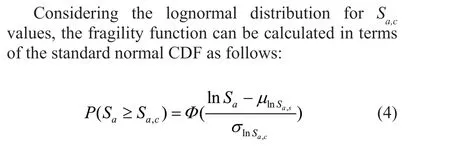
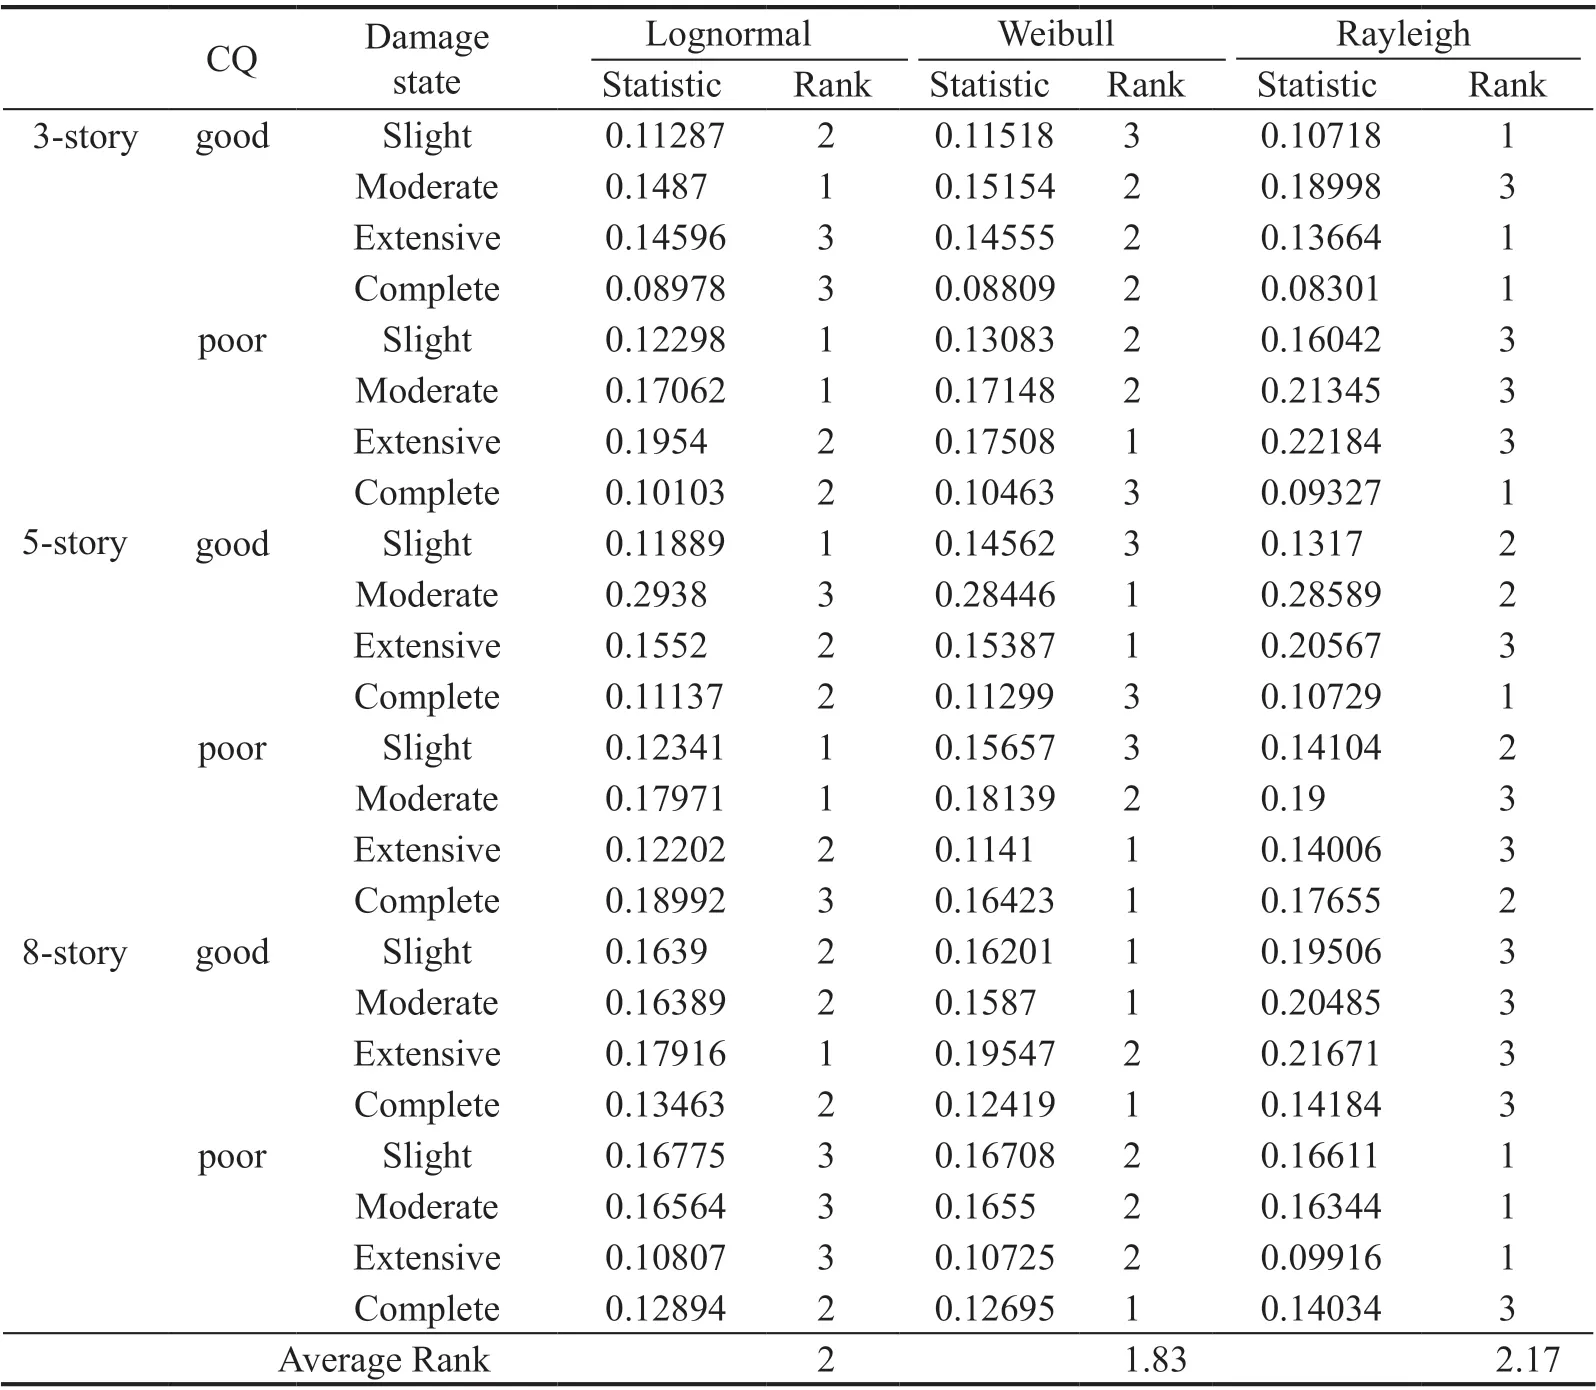
Table 11 Results of the Kolmogorov-Smirnov goodness-of-fit test for various distributions fitted over different limit state capacities for soil type C

Fig. 13 Collapse fragility curves for the 8-story building with good and poor construction quality (GCQ & PCQ) for (a) soil type C, (b) soil type D
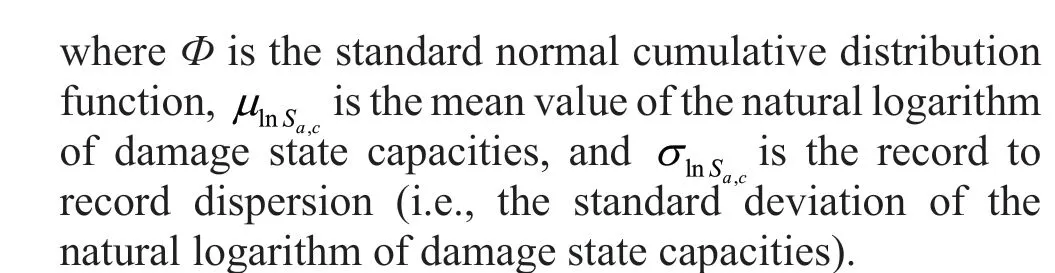
Figure 14 shows the lognormal distributions fitted to the damage state capacities obtained from the IDA curves. These curves are fragility functions for the 3-,5-, and 8-story PCBs. They are provided for construction qualities of good and poor, and soil types of C and D.It should be noted that since the limit state capacities are equal for some records, the number of data points appear in some figures to be less than the number of 20 records. The following observations are worth noting, as presented in Fig. 14:
• There is no considerable difference between the fragility curves developed under earthquake ground motions recorded on soil types C and D for all considered cases, except for the complete damage to the 3-story building.
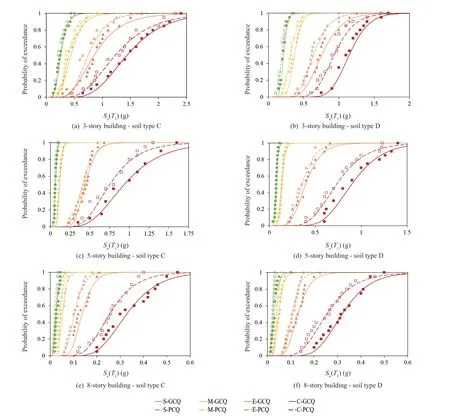
Fig. 14 Fragility curves for slight, moderate, extensive and complete damage of the 3-, 5- and 8-story buildings with good and poor construction quality (GCQ & PCQ) for soil types C and D
• The absolute changes in the fragility curves due to decreasing construction quality become more evident as the structural damage state increases from slight to complete. However, the relative percentage of the difference between the fragility curves corresponding to good and poor construction quality is almost the same for all damage states. On average, by decreasing the quality of construction from good to poor, the median capacity of the buildings at the slight, moderate, extensive, and complete damage states is reduced by amounts of 12%,15%, 14%, and 15%, respectively.
• A comparison of lognormal and empirical probability distributions reveals that the lognormal distribution estimates the probability of exceedance for intensities away from the median that are less than the empirical distribution. The empirical distribution probability at a givenSais equal to the proportion of observations from the sample that are less than or equal to that ofSa. The sample data for each damage state consists ofSa,cvalues obtained from the incremental dynamic analysis of the PCB under the influence of earthquake ground motions.
Table 12 provides the median and standard deviation of the fitted lognormal distribution for various damage states of the 3-, 5-, and 8-story buildings. Since soil type does not significantly affect the fragility curve, all IDA curves, disregarding soil type, were used to calculate the fragility curve parameters for each building. In other words, a total of 40 curves was used for each building,of which 20 are for soil type C and 20 for soil type D.As explained thus far, fragility curve parameters were calculated by conducting incremental dynamic analysis to convert the damage state drift ratio to spectral displacements. Since incremental dynamic analysis requires considerable computational effort, HAZUS methodology is mostly based on the pushover analysis for a practical reason. For developing the fragility curve,HAZUS proposes the median value of spectral displacements obtained from multiplying the threshold value of damage state drift ratio by factors ofhandα2. The parameter ofhis the typical roof height of the building, which is used to convert the damage state drift ratio to the roof displacement of the building. The parameter ofα2is used to convert roof displacement to the spectral displacement of the single degree of freedom system. The values ofα2andhfor the low-, mid-, and high-rise PC2 buildings can be found in HAZUS.
HAZAUS fragility curves proposed for various seismic design levels were calculated for the PCBs considered in this study. The fragility curves developed for the PCBs in this study are most consistent with the pre-code seismic design level in HAZUS. Pre-code damage functions are suggested for buildings that were not designed for seismic provisions. Figure 15 provides a comparison between the collapse fragility curves proposed here for the 3-, 5-, and 8-story buildings with a good quality of construction and that of HAZUS for lowrise buildings (PC2L) with a pre-code seismic design level. It can be observed that the fragility curves of the 5- and 8-story buildings are closer to the PC2L fragility curve than the fragility curve of the 3-story building.As can be seen, it is not considered conservative to use the PC2L fragility curve for the 3-story building.Also, considering that fragility curves are shifted to the right with the increasing height of buildings, using the HAZUS fragility curves proposed for mid- and high-rise buildings for the 5- and 8-story buildings leads to a nonconservative prediction of the probability of exceedance.
The difference between the fragility curves of this study and those of HAZUS can be explained as follows:

Fig. 15 Comparing the complete damage state fragility curves of buildings with good quality construction, with the HAZUS fragility curve proposed for low-rise buildings and pre-code seismic design level (a) the 3-story building, (b) the 5-story building, and (c) the 8-story building
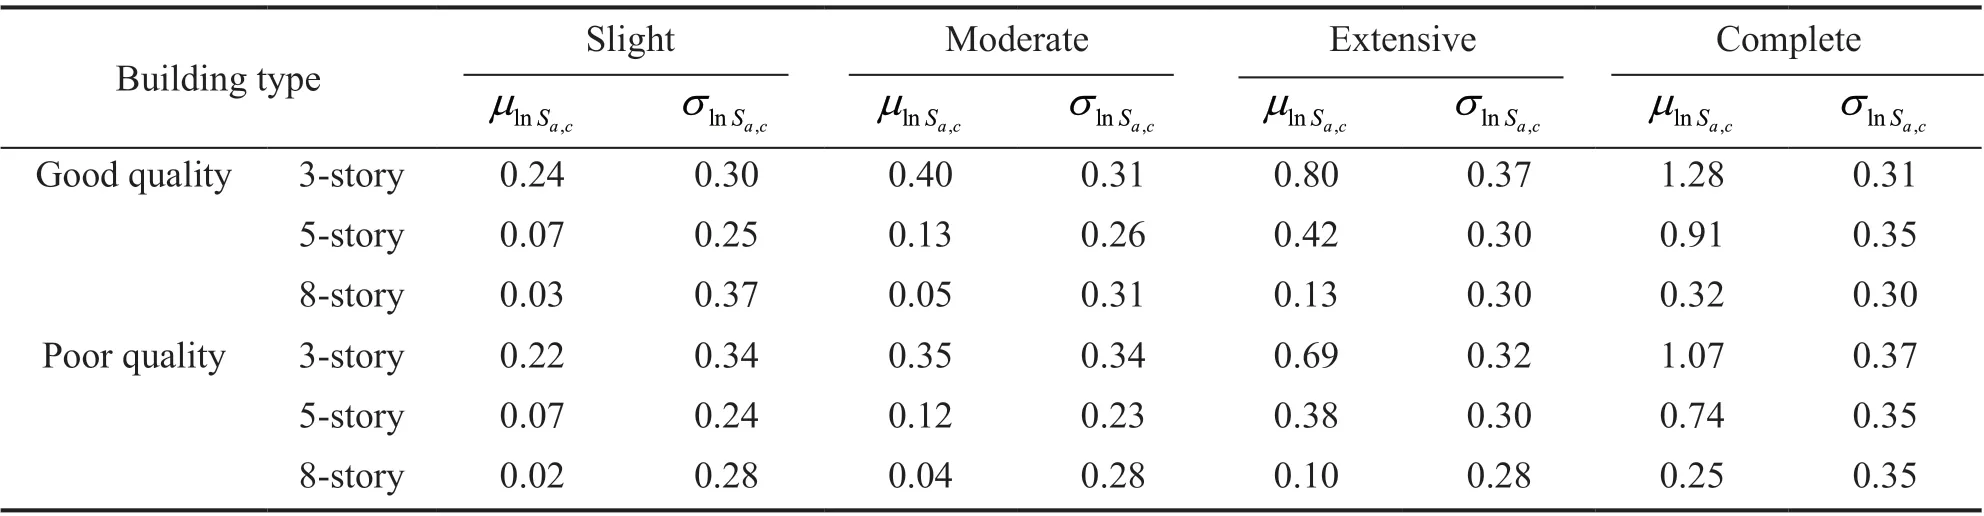
Table 12 Structural fragility curve parameters for good and poor quality of construction in terms of Sa(T1) (g)
• Proposed fragility curve parameters in HAZUS are obtained from a simple equation that converts the damage state drift ratio to the median spectral displacement, based on the pushover analysis concept.At the same time, incremental dynamic analysis results of PCBs, which describe the structural behavior from elastic to collapse more precisely, were used to develop the fragility curves for various damage states in this study.
• When using HAZUS fragility curves for an individual building, it is necessary to keep in mind that these curves are proposed as an average for a group of similar buildings. Since nominally similar buildings have vastly different responses under the influence of an earthquake, it is not uncommon for there to be a difference between the fragility curves of HAZUS and this study. There are various factors such as mass,stiffness, strength, and ductility distribution that affect the nonlinear dynamic responses of a building. Therefore,there are different results from the approximations and simplifications that are necessary for comprehensive analysis in HAZUS.
• When conducting incremental dynamic analysis to estimate the spectral displacements corresponding to the complete damage state drift ratio, non-convergence in the IDA for some records occurs as a criterion for collapse before the building experiences the drift ratio corresponding to the complete damage state.Non-convergence in IDA leads to smaller spectral displacements at the complete damage state for some records and shifts the fragility curves in this study to the left as compared to HAZUS.
In the following section, the fragility curves were used to determine the probability of a specific damage state given anIM, here asSa(T1), equal to its design value.The design spectra of Bojnord, with a return period of 475 years, were used to determine the design values of spectral acceleration for each of the PCBs (Standard No.2800, 2014). Table 13 provides the design values ofSafor the natural period of the PCBs for soil types C and D.
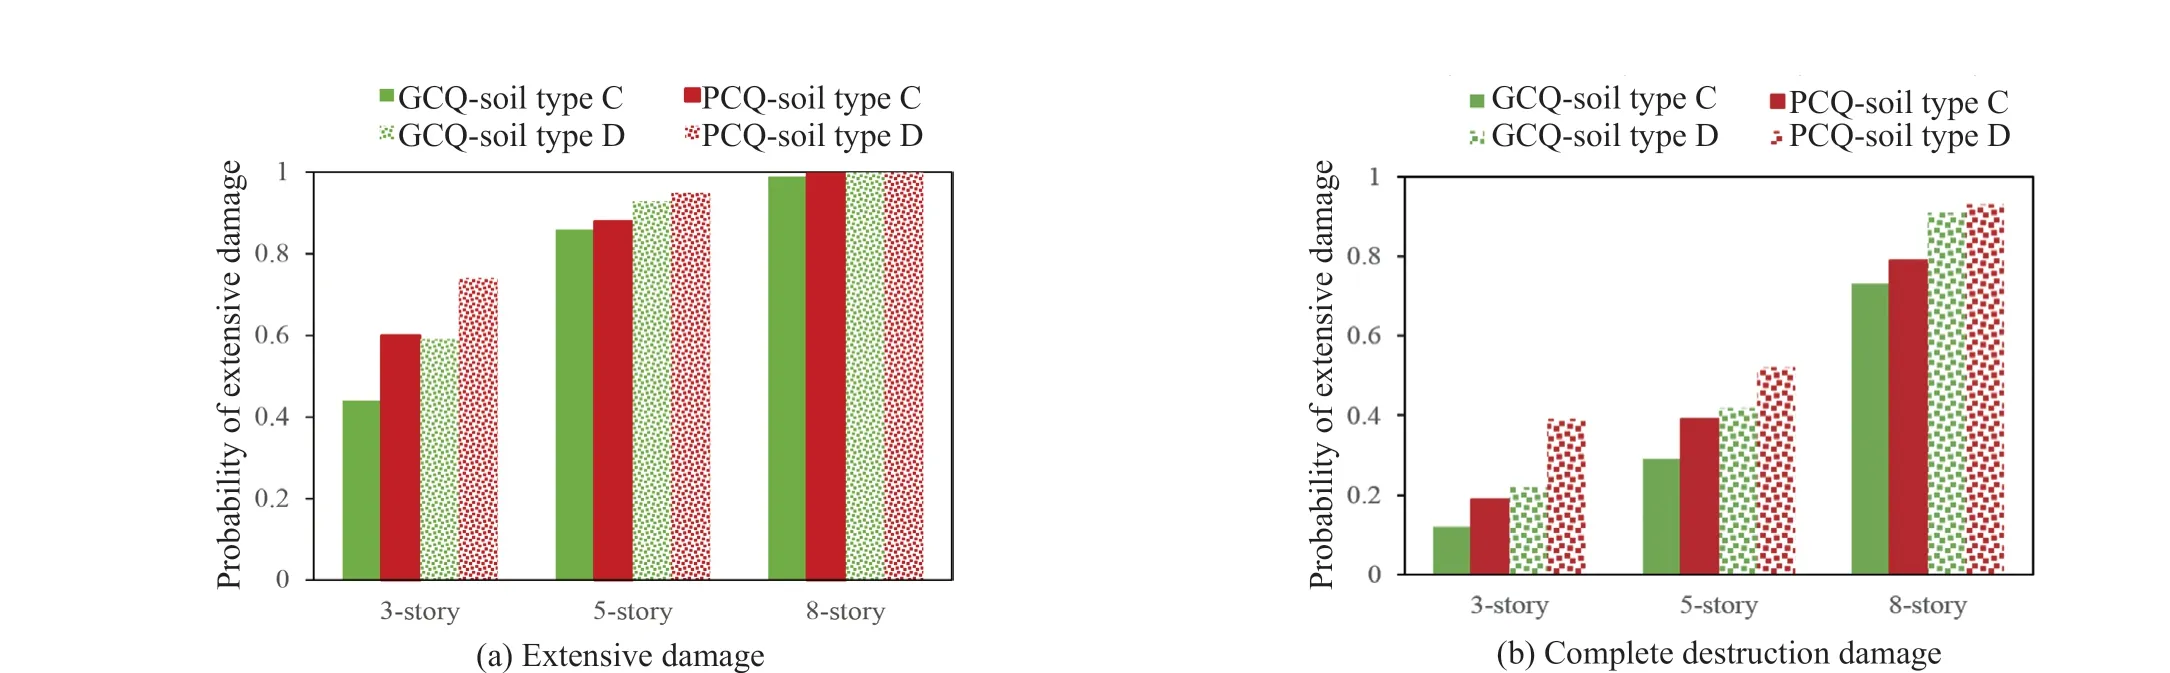
Fig. 16 Damage probability of various buildings from an earthquake with a return period of 475 years
Figure 16 provides the probability of the extensive and complete damage of the 3-, 5-, and 8-story buildings, given the design spectral accelerations. This figure demonstrates that the probability of extensive and complete damage increases as the height of buildings increases. The rise in damage probability is to the extent that the probability of the extensive and complete damage to the 8-story building on soil type D becomes 100% and more than 90% , respectively. This figure also shows that changing the soil type from C to D increases the risk of damage by an average of 32%. It should be mentioned that the risk of damage increased due to an increase in the design spectral accelerations on soil type D. Another observation, as seen in Fig. 16, is that changing the construction quality from good to poor increases the risk of damage by an average of 22%.
8 Conclusions
According to research done with regard to the seismic vulnerability of 3-, 5-, and 8-story buildings that have a lateral load system of precast concrete frames with castin-situ concrete shear walls, the following results were obtained:
• The best-fit model to damage state capacities was selected by considering various distributions. It was found that the Weibull and Lognormal distributions can well describe the fragility curves for all damage states for the 3-, 5-, and 8-story buildings. However,the accuracy of the Weibull distribution is better than the lognormal distribution for the intensities that are more than one standard deviation away from median damage capacity. At these intensities, the probability of exceedance estimated from the lognormal distribution is less than those of the empirical distribution.
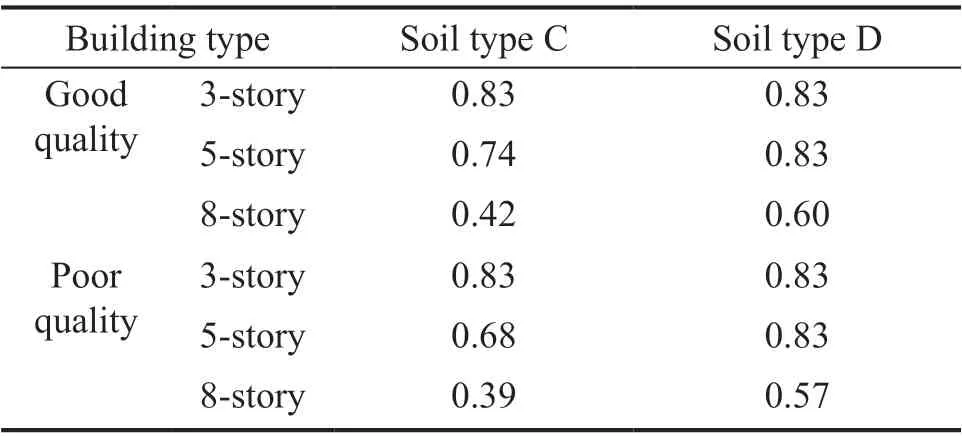
Table 13 Design values of Sa(T1) (g) corresponding to the return period of 475 years
• Changing the soil type from C to D has no considerable effect on the fragility curves for the precast concrete buildings considered herein, except for the complete damage fragility curve for the 3-story building.
• On average, by changing the quality of construction from good to poor, the median capacity of the buildings at the slight, moderate, extensive, and complete damage states is reduced by the amounts of 12%, 15%, 14%, and 15%, respectively.
• Using the fragility curve parameters of HAZUS leads to a non-conservative prediction of the probability of damage states for the precast concrete buildings considered in this study.
• With the increasing height of these buildings,the seismic vulnerability increases at four damage states:slight, moderate, extensive, and complete.
• The probability of extensive and complete damage to the buildings increased by an average amount of 32% on soil type D, as compared to soil type C.Damage probabilities were calculated given the design spectra of the site with a return period of 475 years.Since the soil type has little effect on fragility curve parameters, the probability of damage increased due to the rise in the design spectral accelerations on soil type D.
• The risk of damage to the PCBs increased by an average amount of 22% when reducing the construction quality from good to poor.
Appendix A
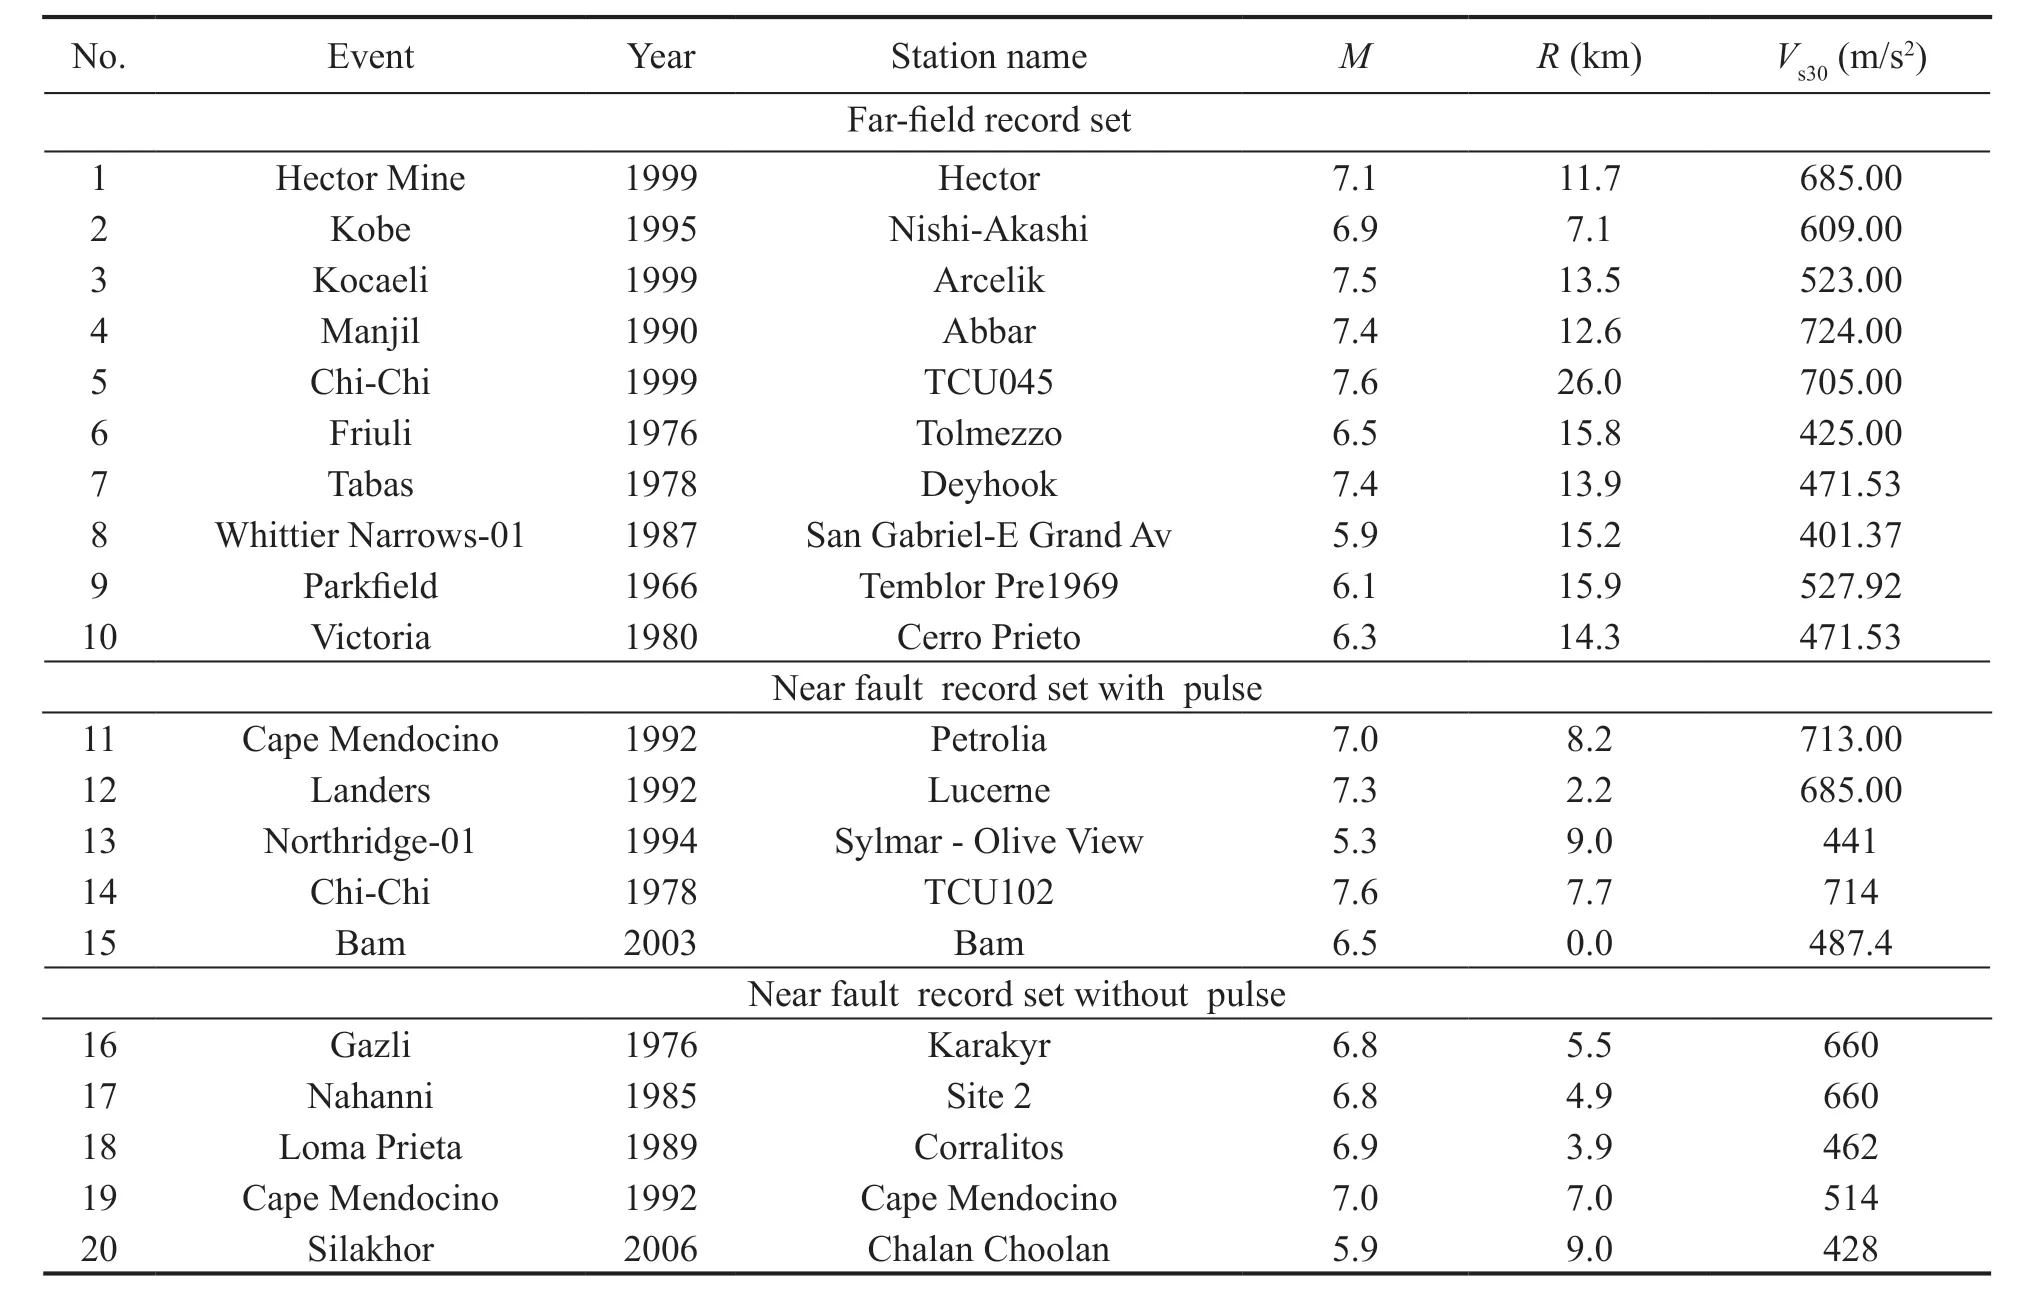
Table A1 Details of 20 earthquake ground motions considered in this study for soil type C of the NEHRP code
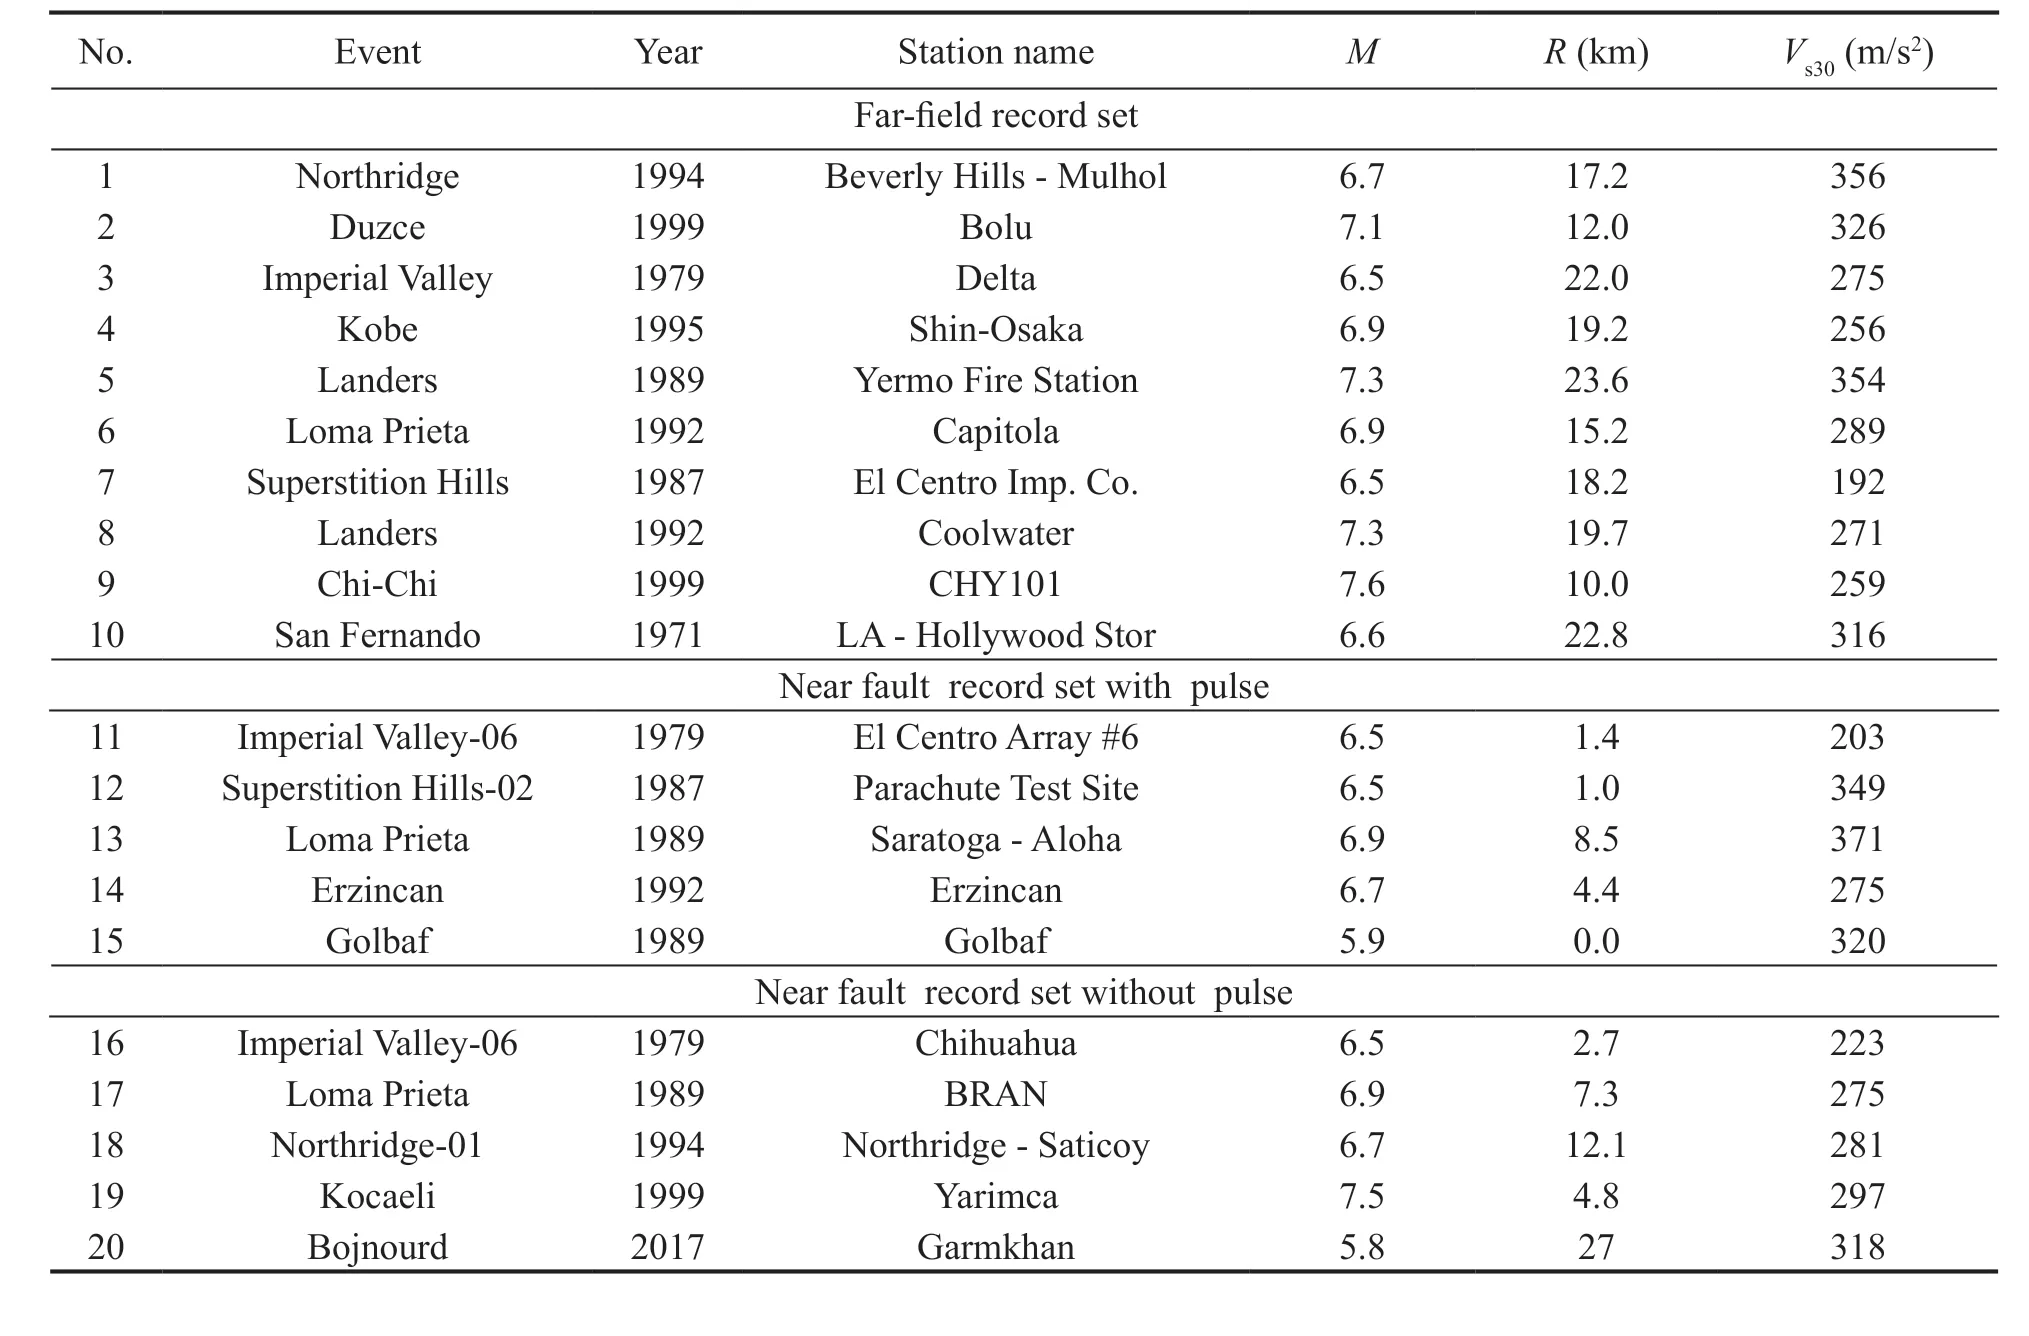
Table A2 Details of 20 earthquake ground motions considered in this study for soil type D of the NEHRP code
杂志排行

Earthquake Engineering and Engineering Vibration的其它文章
- A review of the research and application of deep learning-based computer vision in structural damage detection
- Experimental study of vertical and batter pile groups in saturated sand using a centrifuge shaking table
- Analytical evaluation and experimental validation on dynamic rocking behavior for shallow foundation considering structural response
- Effect of geofoam as cover material in cut and cover tunnels on the seismic response of ground surface
- Dynamic response of concrete face rockfill dam affected by polarity reversal of near-fault earthquake
- Analyzing uncertainties involved in estimating collapse risk with and without considering uncertainty probability distribution parameters