Dynamic response of concrete face rockfill dam affected by polarity reversal of near-fault earthquake
2022-01-21JiangQiutingZouDegaoHanHuichaoandLiuJingmao
Jiang Qiuting, Zou Degao, Han Huichao and Liu Jingmao
1. State Key Laboratory of Coastal and Offshore Engineering, Dalian University of Technology, Dalian 116023, China
2. School of Hydraulic Engineering, Dalian University of Technology, Dalian 116023, China
Abstract: In China, an increasing number of high concrete face rockfill dams (CFRDs) are located in high intensity earthquake zones, some of which are close to the seismic fault line. Recordings suggest that near-fault ground motions are characterized by large one-sided velocity pulses. The conventional dynamic analysis of dams, however, neglects the features of strong ground movements. In this study, under different ground motion levels some numerical dynamic studies considering the one-sided broadband pulses of near-fault earthquakes are presented for CFRDs based on a generalized plasticity model for rockfill materials. The results indicate that the displacements of dam crest corresponding to positive and reverse input of near-fault ground motion make a significant difference, while the displacements of the dam crest under artificial seismic waves are similar. Furthermore, using the horizontal and vertical components as simultaneous excitations near the faults,the displacements of the dam crest before and after reversing the motion produce a larger difference than that using a single component. More importantly, the difference of horizontal displacements of the dam crest caused by polarity reversal of near-fault ground motions increases with the increase of earthquake intensity. Due to the randomness and uncertainties of earthquakes, using a stochastic near-field motion input as excitation without considering the polarity (i.e., positive vs reversed waveform), does not necessarily obtain a conservative result.
Keywords: near-fault ground motion; polarity; high concrete face rockfill dam; dynamic response
1 Introduction
Near-fault ground motion is among the most complex types of ground motion, which can cause much of the damage to structures in the near-fault region. There are several different definitions of near-fault ground motion including the definition dependent on the magnitude of earthquakes (Ambraseys and Douglas, 2000), the hypocentral distance, and the “closest distance”(r) from the site to the fault rupture plane (Abrahamson and Silva,1997). In this study, a near-field earthquake is considered as the motion of the site within about 20 km from the rupture fault (Somerville, 2003; Bray and Rodriguez-Marek, 2004; Yanget al., 2010; Yang and Wang, 2012;Zouet al., 2017; Zouet al., 2019). It manifests itself with large one-sided low-frequency velocity pulses occurring at the beginning of shaking (Mavroeidiset al., 2004; Mazza and Vulcano, 2009; Yanget al., 2010;Yang and Wang, 2012; Zouet al., 2017), which differs significantly from typical far-field motions (Mavroeidiset al., 2004). Berteroet al. (1976) first elaborated the destructive capacity of near-source motions containing long duration pulses and introduced a new concept called“incremental ground velocity” to measure the impulsive character of such motions (Berteroet al., 1976; Gazetaset al., 2009; Zamora and Riddell, 2011). Tong and Lee(Tong and Lee, 1999; Tonget al., 2002) have identified a few critical aspects of near-fault ground motion pulses by analyzing 3D ground motion characteristics; for instance, the dominant velocity pulses are asymmetric(Daiet al., 2004). Near-fault ground motions have been a focus of exhaustive discussions over the years.
In western China, the number of concrete face rockfill dams (CFRDs) has increased over time, in response to the growing demand for water resources and hydropower (Panget al., 2018; Zouet al., 2019; Xuet al., 2020). These dams have also reached new heights as the technology has developed to allow for a maximum size of 300m (Zhouet al., 2011; Mahinroosta, 2015;Panget al., 2018; Xuet al., 2020). The occurrence of near-fault ground motions close to these dams has the potential to cause severe structural damage and heavy losses (Panget al., 2018; Xuet al., 2020). Recently, a few studies (Ishiharaet al., 1984; Ishihara and Nagase,1988; Bonelli, 1998; Yuanet al., 2003; Donget al., 2007;Menget al., 2008) have concentrated on the dynamic behavior of soil and housing settlement subjected to asymmetric ground motions, which triggered the current study. Ishiharaet al.(Ishiharaet al., 1984; Ishihara and Nagase, 1988) conducted several series of dynamic triaxial tests that have been divided into two groups and defined as CM-test and EM-test (+ and -) on a saturated sandy clay under irregular loading conditions. Yuanet al.(2003) conducted a few studies to investigate the impact of the asymmetrical and irregular character of ground motions on the settlement of buildings on the natural subsoil. Menget al.(2008) investigated the effect of asymmetrical characteristics of seismic loads on the soil deformation by using triaxial dynamic tests. Gazetaset al.(Gazetaset al., 2009; Gariniet al., 2011) studied the sensitivity of slippage of a rigid sliding-block system on the reversal of shaking polarity (+ or -) and the rigid sliding block model represents ideally rigid-plastic constant-friction systems. This research indicates that the asymmetry of earthquakes can play a significant role in the dynamic behavior of earth structures. The dynamic response of structures is dictated by the nature of ground movements and also by the properties and geometry of the structures themselves (Ambraseys and Sarma, 1967),but the eccentricity in the geometry, stiffness and load distribution of the upstream and downstream of CFRDs is often neglected. Thus, the effect of the asymmetry of near-fault ground motions with large one-sided pulses on dynamic responses of CFRDs is a topic of great interest.
Based on 690 finite element calculations, the present study extends the above work by examining the deformations of Gushui CFRD considering the polarity reversal of earthquakes under 0.3 g, 0.4 g and 0.5 g nearfault ground motions. A FEM program, Geotechnical Dynamic Nonlinear Analysis GEODYNA (Zouet al.,2005; Konget al., 2011; Zouet al., 2013), is used in the dynamic calculations. A generalized plasticity model(Xuet al., 2012; Zouet al., 2012) for rockfill materials is employed to simulate the deformation of the dam.The interface between the concrete slab and cushions gravel is simulated with an ideal elastic-plastic model which can depict the relative slipping between the slab and the rockfill. The earthquake input is carried out employing the wave input method for a viscoelastic boundary to model the interaction between the CFRD and the foundation (Lublineret al., 1989; Somervilleet al., 1997; Liuet al., 2014).
2 Ground motion parameters
The Chi-Chi and Northridge earthquakes provided large amounts of near fault ground motion records(Hallet al., 1995; Tonget al., 2002; Zouet al., 2017,2019). A total of 101 near-fault ground motion records are selected, of which 72 are obtained from the Chi-Chi earthquake and 29 are obtained from the Northridge earthquake. All ground motions are within 20 kilometers from the ruptured fault, as shown in Table 1. These records are chosen from the Pacific Earthquake Engineering Research Center (http:/peer.berkeley.edu). To put the severity of near-fault ground motions in perspective with the severity of ground motions represented by current codes (Alavi and Krawinkler, 2004), three artificial seismic waves are also used for comparison.
In general, the high PGV/PGA ratios indicate that these motions may comprise velocity pulses (Lohet al.,2002; Yanget al., 2010; Zouet al., 2017; Zouet al.,2019). As illustrated in Figs. 1-2, the near-fault ground motion records collected from TCU074N stations and the artificial seismic waves are normalized to 0.3 g ground motion levels. Note that the near-source seismic wave possesses large one-sided long-period pulses of acceleration and velocity, and hence generates large ground displacement pulses (Mavroeidiset al., 2004;Daiet al., 2004; Zouet al., 2017). The peak velocity and displacement of near-field strong ground motion are 3.29 and 6.75 times that of artificial seismic wave,respectively. The input energy of ground motion (Liaoet al., 2001; Yanget al., 2007) is defined as:whereEiis the input energy of the ground motion,v(t) is the velocity time history of the ground motion,andtdis the duration of the ground motion. Due to the low-frequency pulses of the velocity time histories of near-fault ground motion, structures can be exposed to high ground input energy at the onset of the record(Somervilleet al., 1997; Liaoet al., 2001).

3 Generalized plasticity model for the rockfills(Ling and Liu, 2003; Ling and Yang, 2006;Liu and Zou, 2012; Liu, 2013)
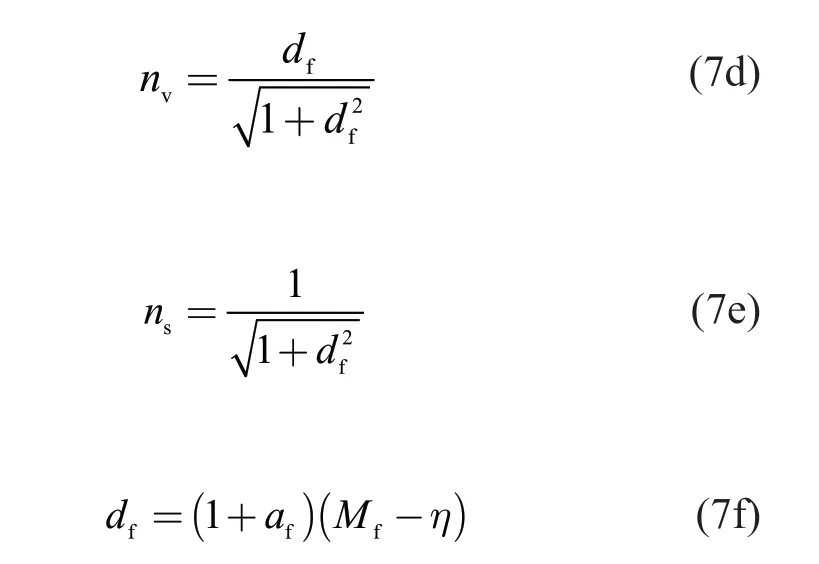
In generalized plasticity theory, the elastic-plastic stiffness tensor is expressed as:
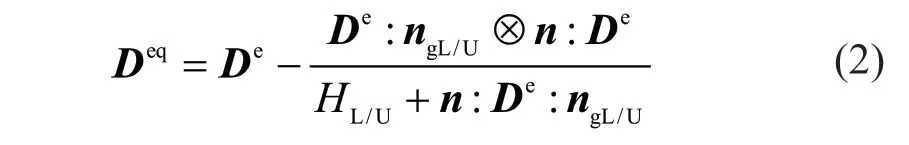
whereDeis the elastic stiffness tensor,ngis the flow direction vector,nis the loading direction vector,His the plastic modulus, andDepis the elastic-plastic stiffness tensor. Loading and unloading are denoted by the subscripts L and U, respectively.
The shear and bulk moduli are expressed as
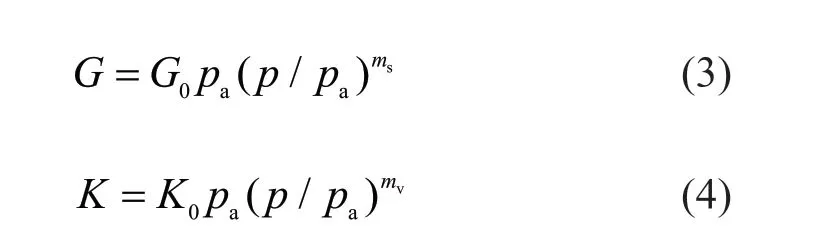
whereG0,K0are the shear moduli and elastic volumetric,respectively, andpais the atmospheric pressure.
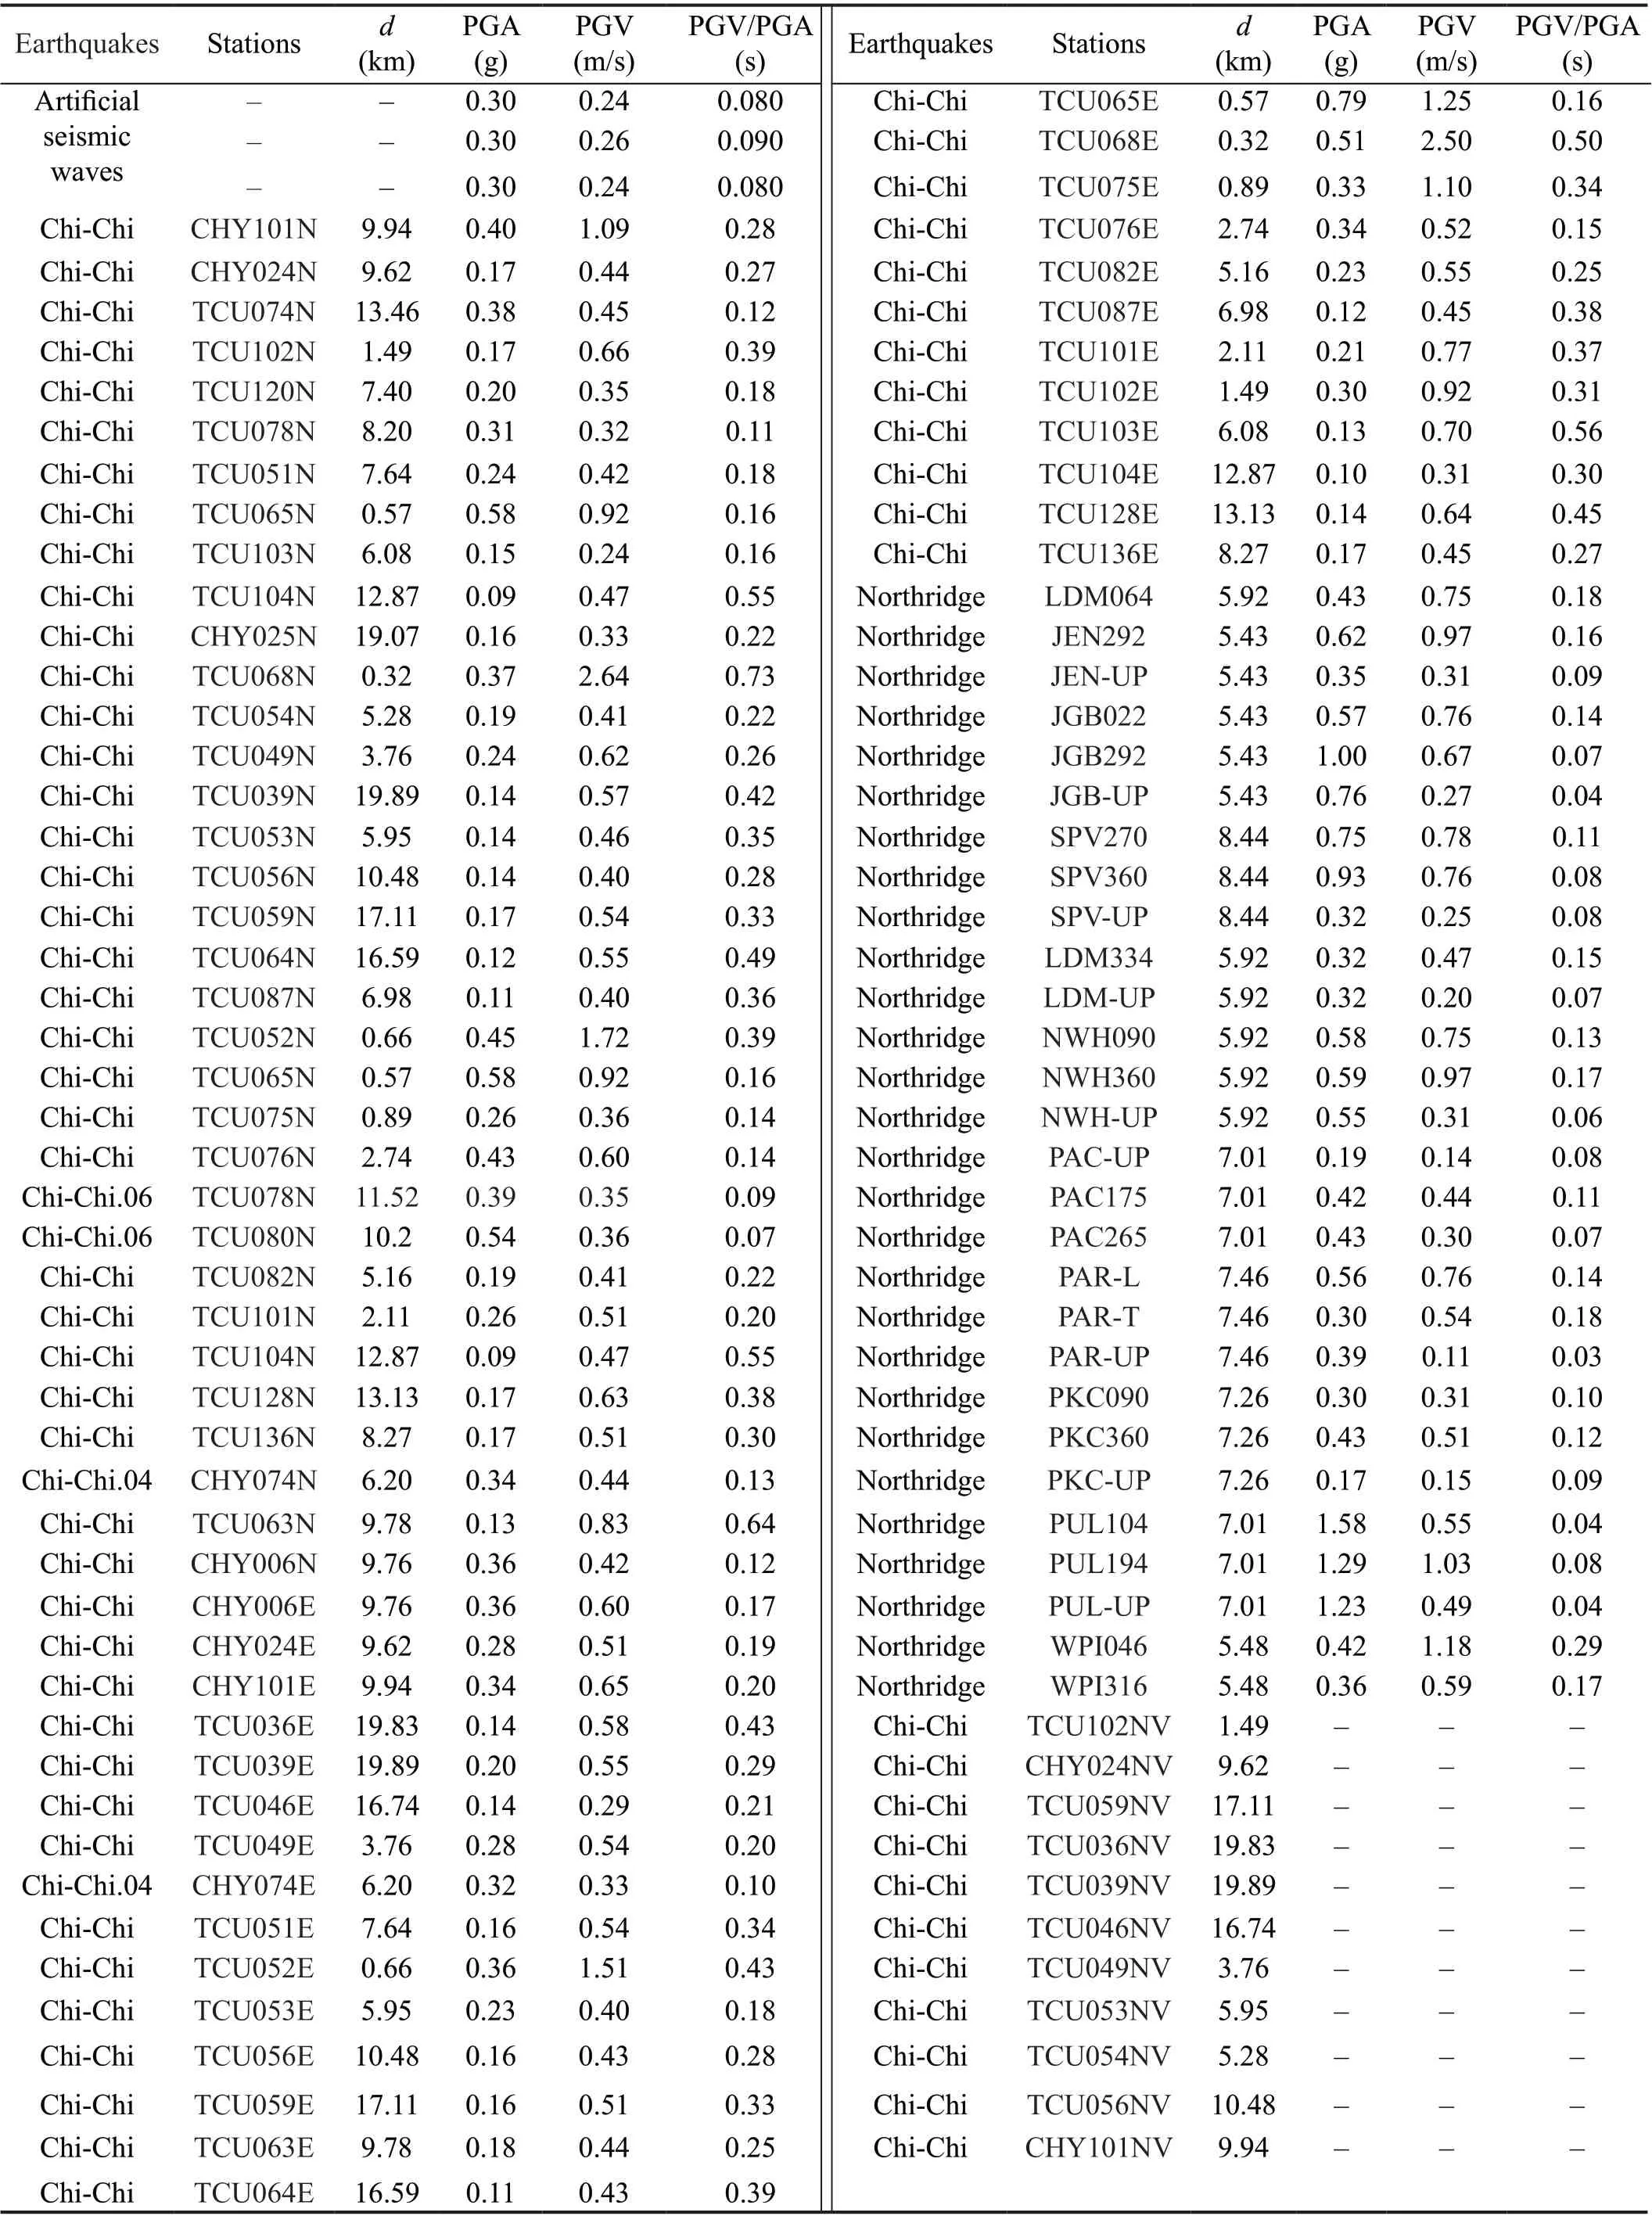
Table 1 Parameters of selected near-fault ground motions and artificial seismic waves

Fig. 1 Time histories of near-fault ground motion (TCU074)
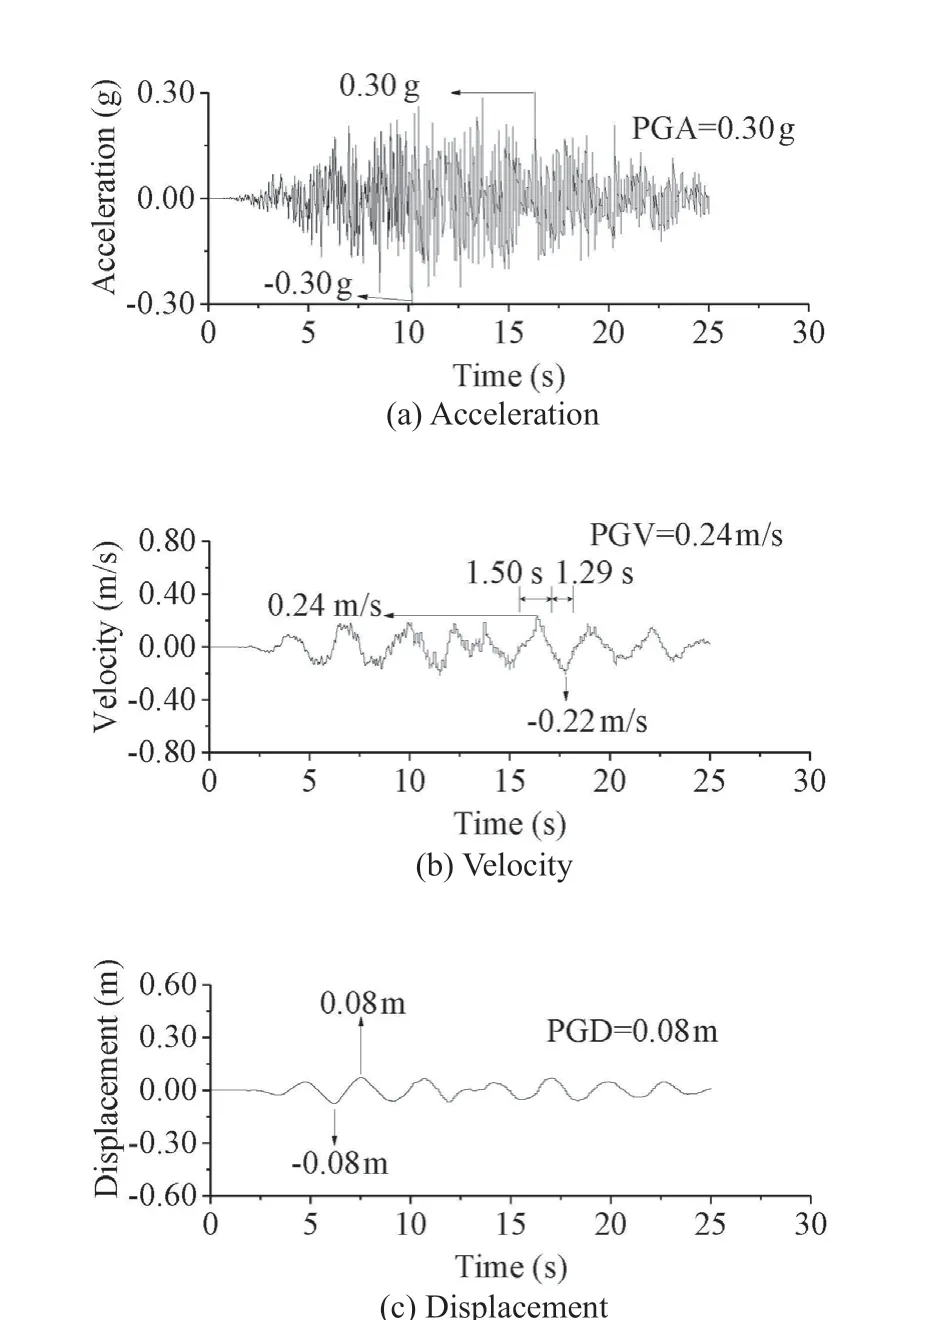
Fig. 2 Time histories of artificial seismic wave

Table 2 Parameters of generalized plastic model for rockfill materials
The non-associated flow rule is presumed in the model, and the flow direction vector in the triaxial space and the loading direction vector are, respectively,expressed as:

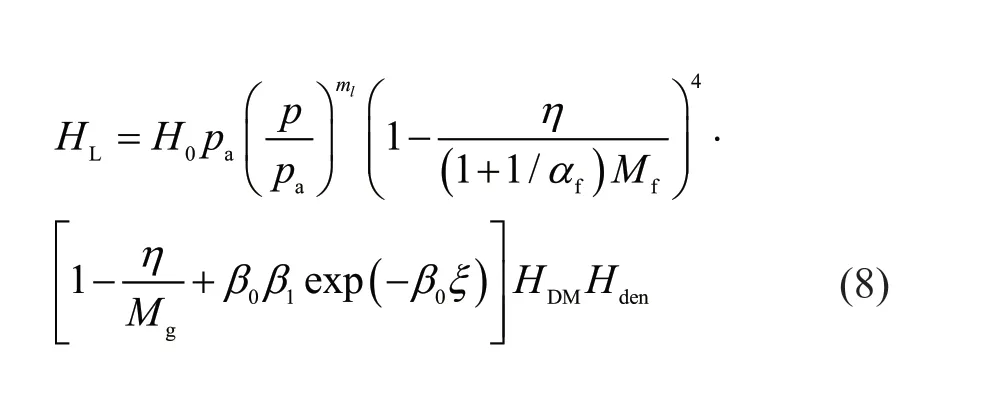
The plastic modules corresponding to loading and reloading are, respectively, expressed as

4 FE analysis
The Gushui CFRD which lies in Deqin County,Yunnan Province in China, is employed for dynamic analysis of the dam in this study. The two-dimensional FE model of the CFRD is 242 m high and 25 m wide at the top. The upstream slope of the dam is 1:1.5, and the impounded water is 225 m high. The berm is 188 m high. The downstream dam slope above and under the berm are 1:1.7 and 1:1.4, respectively. The thickness of the concrete face slabs is 0.3 m at the crest of the dam, and the thicknesses of the other slabs at different heights of dam are governed byt=0.3+0.0035H, wheretandHare the thickness of the concrete face slab and the distance between the cross section and the top of the dam, respectively. In the dynamic calculations, the added mass method (Westergaard, 1933) is employed to simulate the hydrodynamic pressure acting on the concrete face slabs. The viscoelastic boundary can model the radiation of waves from the finite element mesh into the far field in the dynamic analysis of foundation(Deeks and Randolp, 1994). The boundary has excellent stability and removes the problem of low-frequency drift. Thus, the wave input method for the viscoelastic boundary is used for dynamic computation. The input modes of the ground motion are defined as positive input and reverse input, as shown in Fig. 3.
5 Material parameters
The parameters proposed by Zouet al.(2013) are selected to characterize the deformation of rockfill materials, as shown in Table 2. Both the dynamic behaviors of the concrete face slabs and the bedrock are simulated by linear elastic models, and the detailed parameters are shown in Table 3 and Table 4,respectively. The interface between the concrete face slab and the cushion is modeled by adopting the ideal elastic-plastic interface model and the parameters (Xuet al., 2012; Konget al., 2016) are taken as shown in Table 5. The dynamic response analysis is performed using GEODYNA.
6 Discussion and results
With 0.3 g, 0.4 g and 0.5 g ground motion levels, 690 finite element calculations considering the asymmetry of near-source earthquakes are performed for the CFRD.
6.1 Analysis of time histories
The acceleration and velocity time histories of artificial seismic waves are shown in Figs. 4 and 5,respectively. The amplitude and duration of acceleration and velocity pulses in these waves are almost symmetric on both sides of the axis and are much smaller than those of the near-fault ground motion. The deformations of the dam subjected to artificial seismic waves with different ground motions are approximately the same, such that only the horizontal displacement and settlement time histories of the dam crest under 0.3 g ground motion levels are plotted in Figs. 6 and 7. It can be seen that the deformation of the dam under artificial seismic waves gradually accumulates, and the maximum displacement remains within 0.3 m. Artificial seismic waves have the same contribution on displacements of the dam when the input motions are positive and reverse, respectively.

Table 3 Parameters of concrete face slabs

Table 4 Parameters of bedrock
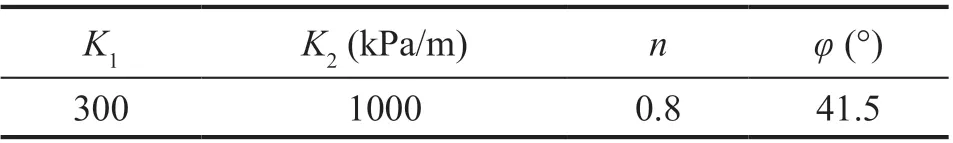
Table 5 Parameters of ideal elasto-plastic interface model

Fig. 3 Finite element mesh of Gushui CFRD
Figures 8 and 9 show the acceleration and velocity time histories of near-fault ground motion from the CHY101N, CHY024N and TCU074N stations. The horizontal displacement time histories of the dam crest corresponding to 0.3 g, 0.4 g and 0.5 g ground motion levels are shown in Figs. 10-12. The horizontal displacements of the dam crest before and after reversing the motions appear similar in the first 10 seconds of the time histories. When the peak ground velocity appears,it is always possible to locate a velocity pulse where a horizontal displacement extreme of the dam crest occurs.Nevertheless, when inputting the same motion in reverse,a sudden horizontal displacement extreme occurs in the opposite direction of growth, which seems to dampen the displacement trend. As a result, the displacements of the dam crest before and after reversing the polarity of the near-fault motions make a significant difference,which always increases with increasing PGA. In the same way, the settlement time histories of the dam crest with different ground motion levels are shown in Figs. 13-15. As indicated by the time history curves, a distinct separation occurs in the settlement traces under two input modes of near-fault ground motions after about 40 s.
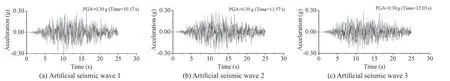
Fig. 4 Acceleration time histories
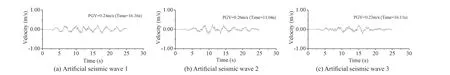
Fig. 5 Velocity time histories

Fig. 6 Horizontal displacements of dam crest under 0.3 g ground motion levels

Fig. 7 Settlements of dam crest under 0.3 g ground motion levels

Fig. 8 Acceleration time histories of near-fault ground motions
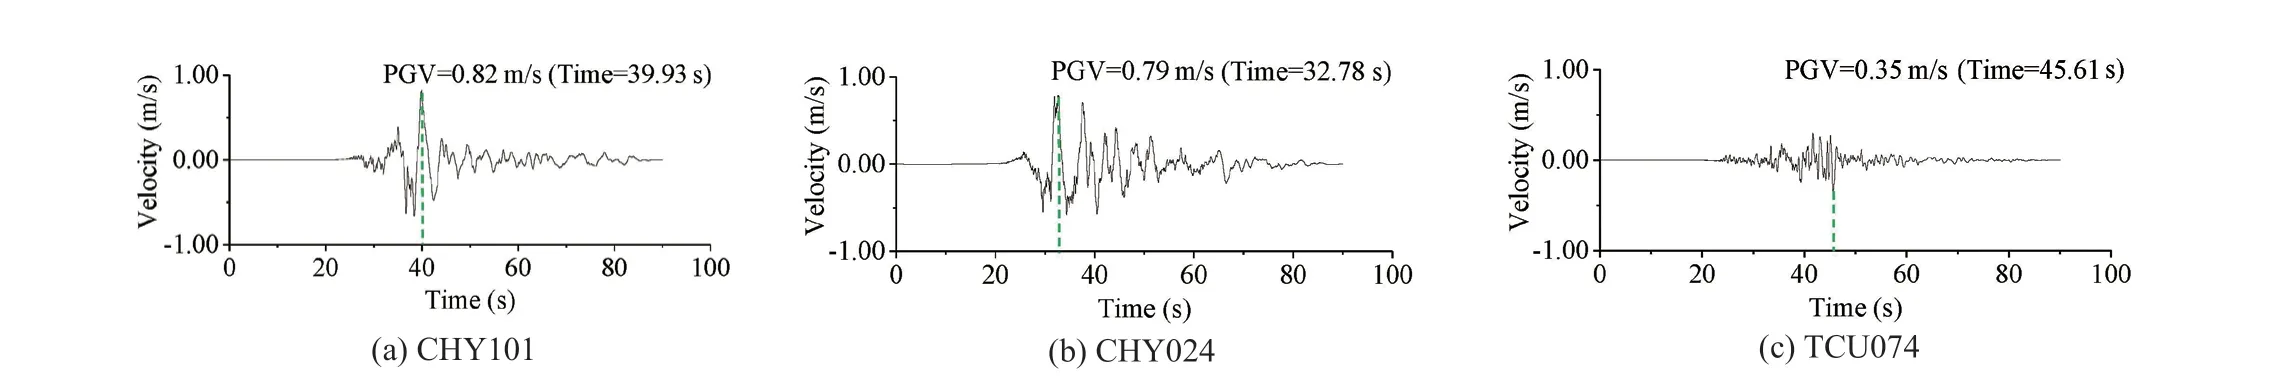
Fig. 9 Velocity time histories of near-fault ground motions

Fig. 10 Horizontal displacements of dam crest under 0.3 g near-fault ground motions

Fig. 11 Horizontal displacements of dam crest under 0.4 g near-fault ground motions

Fig. 12 Horizontal displacements of dam crest under 0.5 g near-fault ground motions
An important observation is that the dynamic responses of the dam corresponding to positive and reverse input of near-fault excitation have greater differences than under artificial seismic waves—a fact arising from the existence of large one-sided pulses in earthquakes near the faults.
6.2 Displacements of dam crest
Tables 6 and 7 list the maximum displacements of the dam crest under positive and reverse input of 93 ground motions, respectively. The ratio of displacements of the dam crest corresponding to two input modes of seismic waves are taken as metrics to help gauge the effects of asymmetry of near-fault motions on the structural response. The ratio of the horizontal displacement is referred to asHp/Hr, and the ratio of settlement is referred to asSp/Sr.
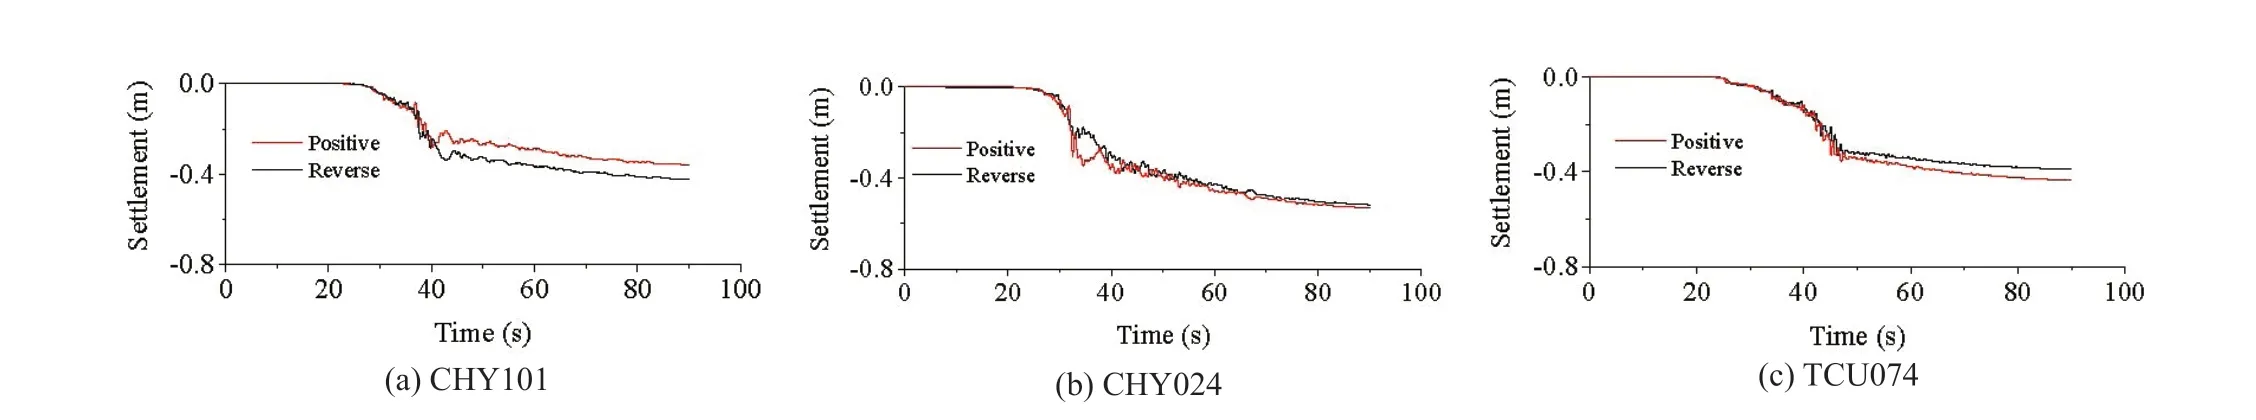
Fig. 13 Settlements of dam crest under 0.3 g near-fault ground motions
Fig. 14 Settlements of dam crest under 0.4 g near-fault ground motions
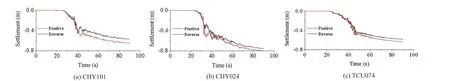
Fig. 15 Settlements of dam crest under 0.5 g near-fault ground motions
The first section of the tables lists the results under artificial seismic waves. When peak ground accelerations(PGA) of the artificial seismic waves are normalized to 0.3 g, 0.4 g and 0.5 g, theHp/Hrof the dam respectively range from 1.00 to 1.06, from 1.00 to 1.04 and from 1.03 to 1.07, and theSp/Srof the dam range from 1.00 to 1.07,stayed at 1.05, and from 1.04 to 1.08. The ratios suggest that the displacements of the dam under two input modes of artificial seismic waves only slightly differ.
Under the near-fault ground motions with PGA=0.3 g, 0.4 g, and 0.5 g, the ratios ofHp/Hrof the dam, respectively, range from 1.00 to 2.04, from 1.00 to 2.53 and from 1.00 to 2.34, which translates to averages of 1.21, 1.24 and 1.28. The ratios ofSp/Sr, respectively,range from 1.00 to 1.43, from 1.00 to 1.61 and from 1.00 to 1.61, corresponding to averages of 1.09, 1.09 and 1.11.
Figures 16 and 17 further show histograms of theHp/Hrand the percentage occupied by each range. To compare them with the artificial seismic waves, the ratio ofHp/Hr= 1.1 can be set as the dividing point. The percentages ofHp/Hrchange with the ground motion levels (0.3 g, 0.4 g, and 0.5 g): 28.90%, 32.20% and 30.00%forHp/Hr=1.0 to 1.1; 26.70%, 23.30% and 18.90%forHp/Hr= 1.1 to 1.2; 24.40%, 17.80% and 13.30%forHp/Hr= 1.2 to 1.3; and 20%, 26.70%, 37.80% forHp/Hrmore than 1.3. Significantly, despite with the various peak accelerations of near-fault ground motions,the percentage ofHp/Hrof 1.0 to 1.2 is almost equal to that ofHp/Hrover 1.2, and the percentage ofHp/Hrforgreater than 1.1 is about 70%. On the other hand,with the increase of the seismic acceleration, the percentage ofHp/Hrratios between 1.2 and 1.3 decreases, but the percentage greater than 1.3 rises. Similarly, the histogram ofSp/Srand the percentage of each interval are shown in Figs. 18 and 19. The percentage corresponding to the 0.3 g,0.4 g, and 0.5 g ground motion levels are as follows:62.22%, 64.44% and 60.00% forSp/Sr= 1.0 to 1.1;30.00%, 24.44% and 31.11% forSp/Sr= 1.1 to 1.2;4.44%, 8.89% and 3.33% forSp/Sr= 1.2 to 1.3;and 3.33%, 2.22% and 5.56% forSp/Srgreater than 1.3. The percentages ofSp/Srgreater than 1.1 are about 35%. The above numerical analysis indicates that displacements under the two input modes of near-fault ground motion differ remarkably, especially for horizontal displacements. Furthermore, the ratios ofHp/Hrconsistently increase with increasing PGA.

Table 6 Max horizontal displacements of dam crest under 0.3 g, 0.4 g and 0.5 g ground motion levels

Table 6 Continued

Fig. 16 Interval distribution of Hp/Hr under 0.3 g, 0.4 g and 0.5 g near-fault ground motions
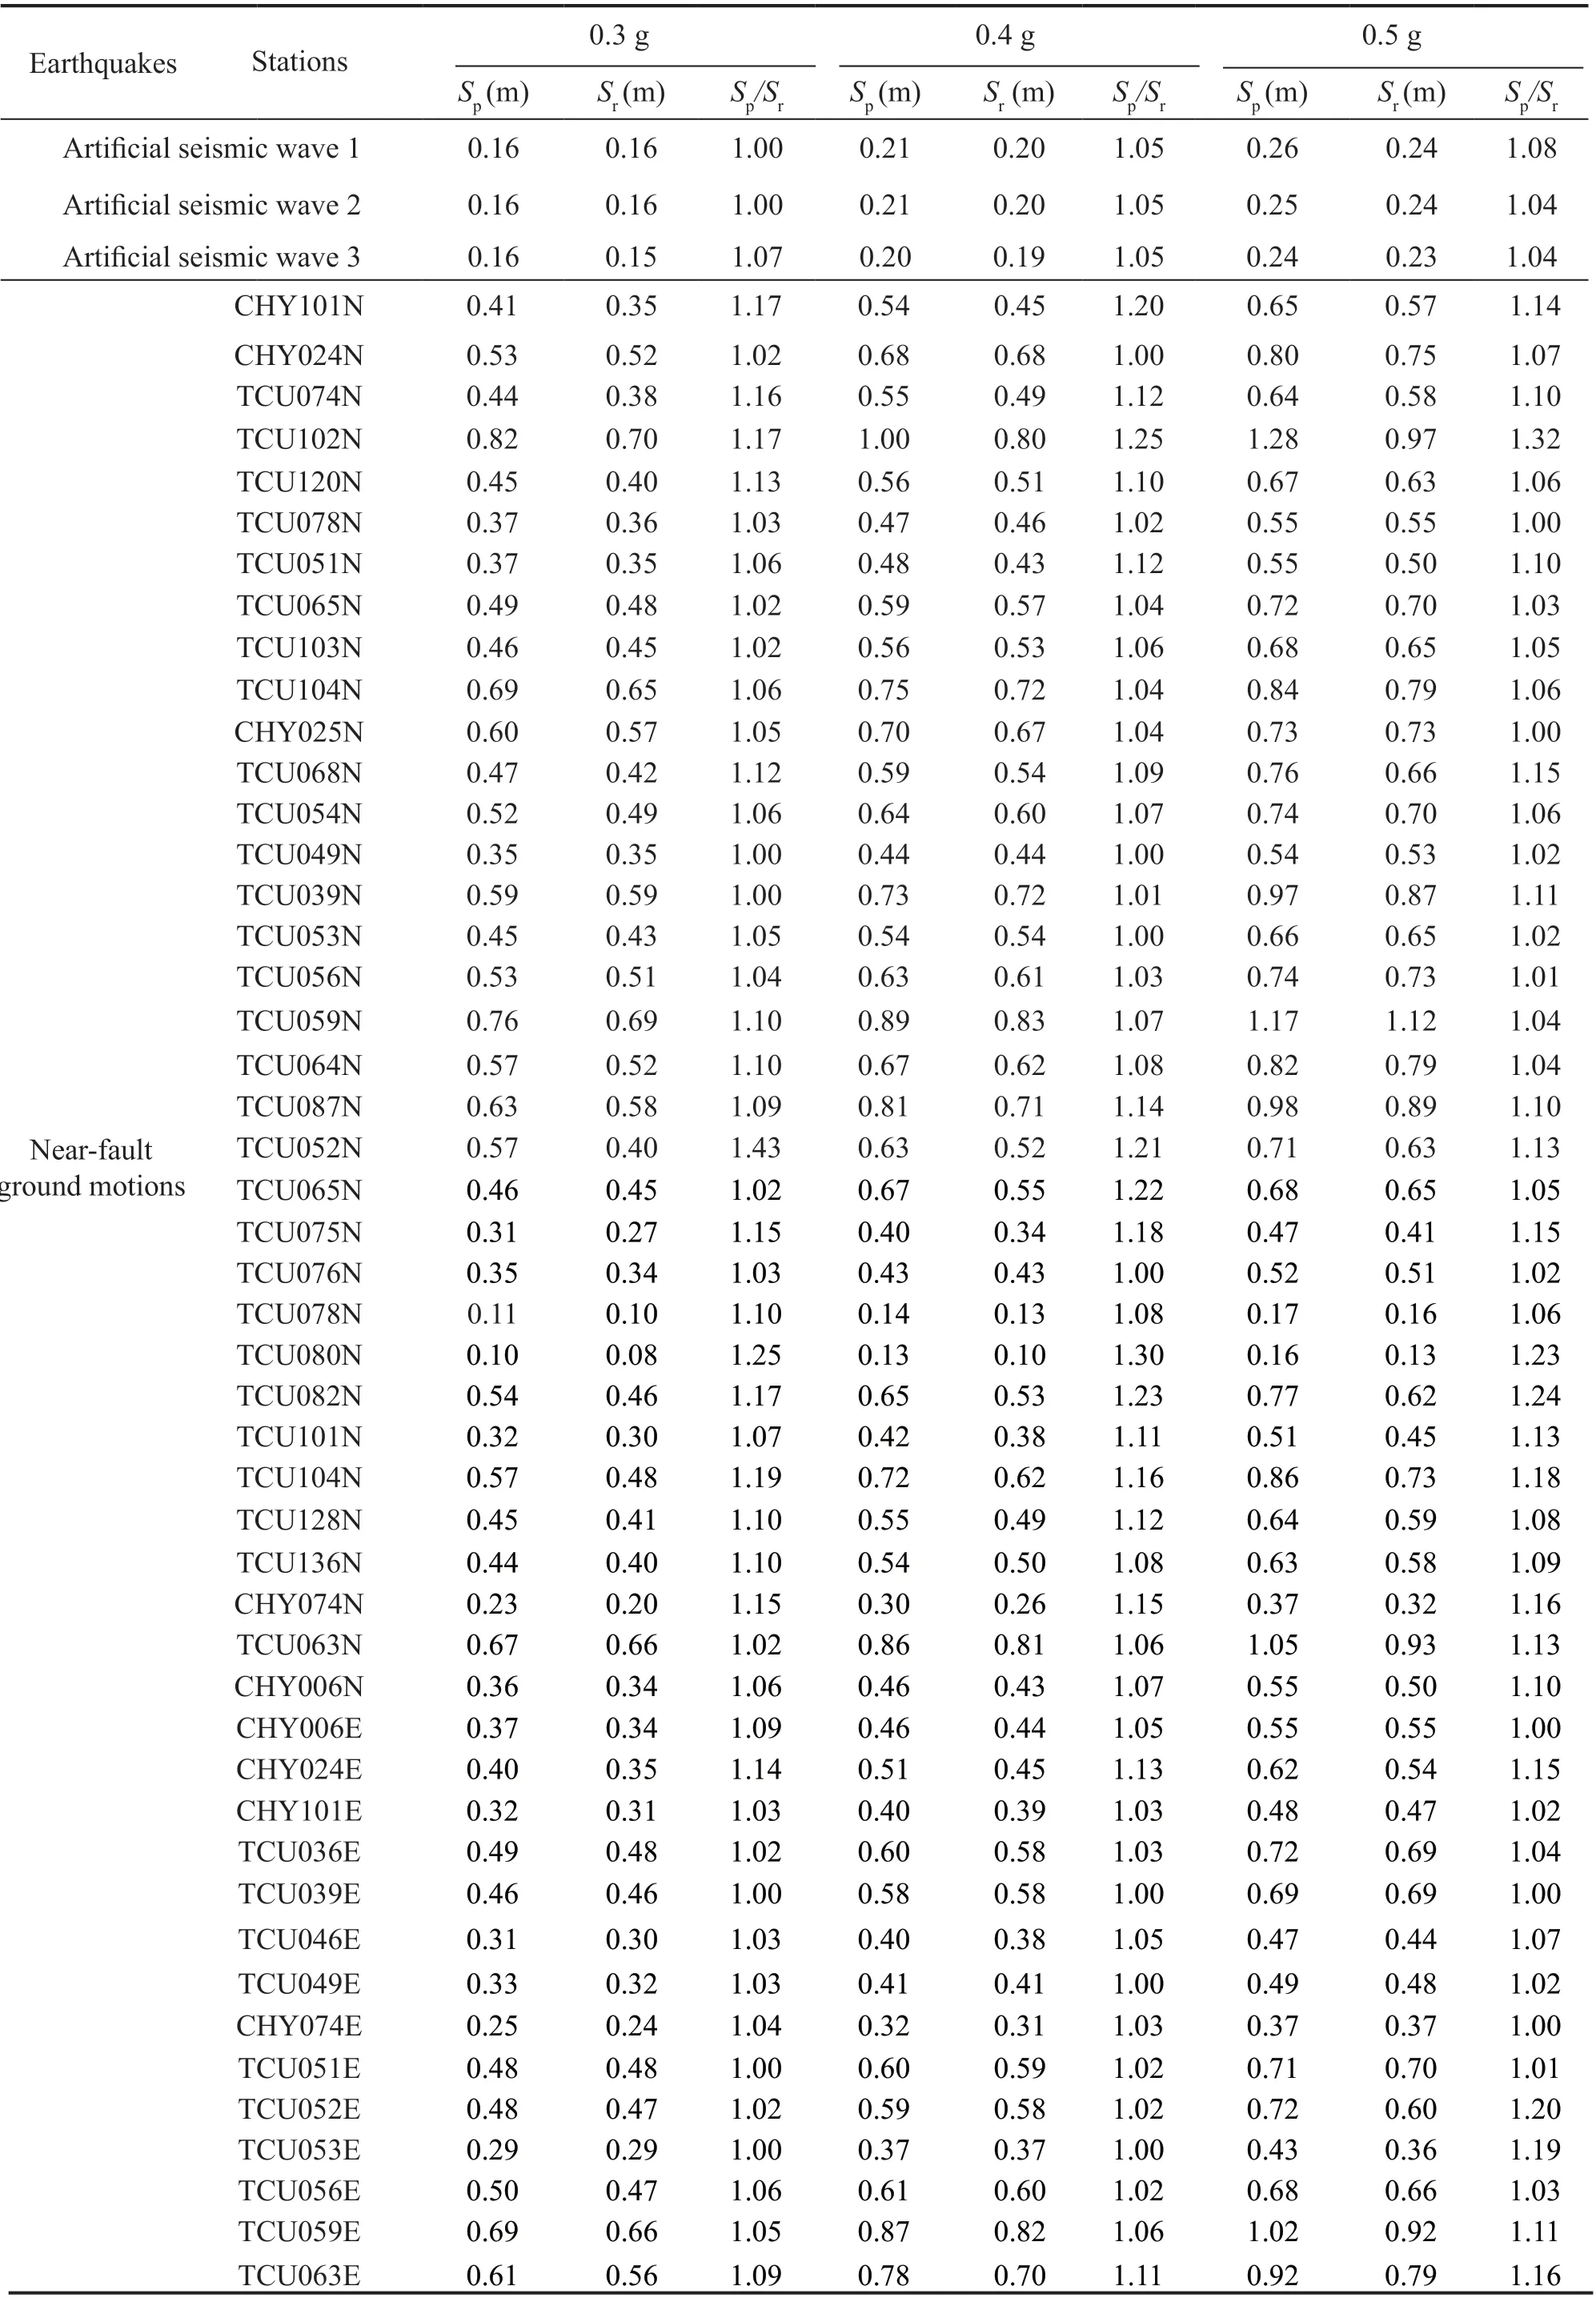
Table 7 Max settlements of dam crest under 0.3 g, 0.4 g and 0.5 g ground motion levels

Table 7 Continued
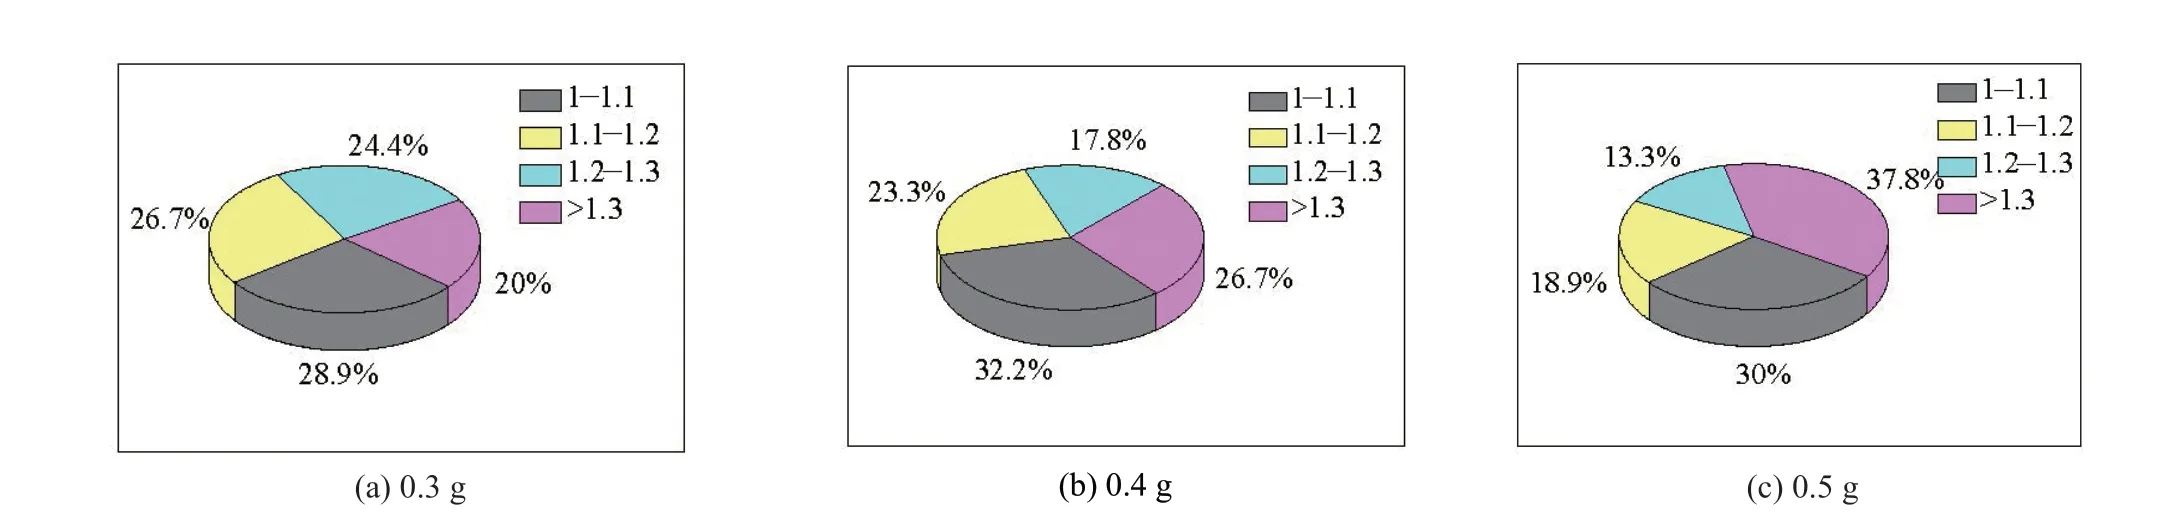
Fig. 17 Percentage of each range of Hp/Hr under 0.3 g, 0.4 g and 0.5 g near-fault ground motions
6.3 Simultaneous horizontal and vertical ground accelerations
Due to the nature of the P and S waves, the vertical acceleration components of an actual earthquake usually contain much higher frequency content and lower energy content than the horizontal component (Papazoglou and Elnashai, 1996; Gazetaset al., 2009). It is generally accepted that the significance of components of a motion for damage potential is determined by the strong-motion energy stored in this frequency range (Papazoglou,1995; Elnashai and Papazoglou, 1995; Papazoglou and Elnashai, 1996). However, in some cases, the presence of severe vertical components of motions may lead to different failure modes or damage from that of the neglected components (Papazoglou and Elnashai, 1996).Therefore, the effect of the vectorial synthesis of the horizontal and vertical components on the subject has been studied in this investigation with actual near-source motions.
The results from 11 pairs of horizontal and vertical components of earthquakes are used as the simultaneous excitations; the station information is shown in Table 1.These two-components earthquakes are applied in four input modes: inputting both the horizontal and vertical components of motion as positive (PP); inputting the horizontal components as positive and inputting the simultaneous vertical components in reverse (PR);inputting the horizontal components in reverse and the simultaneous vertical components as positive (PR); and so on. The amplitude is still modulated at equal intervals(the range is 0.1 g) (Panget al., 2018; Xuet al., 2020).To clearly illustrate the effects of near-fault motions, the two typical displacement time histories with the largest difference are highlighted and compared.
The horizontal displacement time histories of the dam crest under 0.3 g near-fault ground motions from stations TCU102, CHY024 and TCU059 are plotted in Fig. 20, respectively. First, in terms of stations TCU102,the input mode of RR for ground shaking is beneficial for the rapid development of nonlinear behavior in the rockfill with the maximum horizontal displacement of the dam crest as 1.20 m. When the same earthquake is applied in the input mode of PR, the time-history curve of horizontal displacement of dam crest is completely reversed, with the maximum value of 0.75 m. Obviously,completely different displacement traces occur. To develop a deeper insight into the variability of response under different input modes of the same motion, the horizontal displacement time histories under motions of stations CHY024 and TCU059 have been plotted, which also show that the dynamic response of high CFRDs changes with polarity reversal of the earthquake.Figures 21 and 22 show that with the increase of the earthquake intensity, the difference of the horizontal displacements of dam crest gradually increases. On the other hand, the settlement time histories of the dam crest under four input modes of two-component motions with different earthquake intensities are illustrated in Figs. 23-25, respectively. Apparently, the phenomenon still exists in the vertical deformation of the dam and the results using vectorial synthesis of the horizontal and vertical components as excitations have a greater difference than those of a single component.
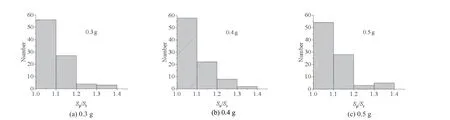
Fig. 18 Interval distribution of Sp/Sr under 0.3 g, 0.4 g and 0.5 g near-fault ground motions

Fig. 19 Percentage of each range of Sp/Sr under 0.3 g, 0.4 g and 0.5 g near-fault ground motion

Fig. 20 Horizontal displacements of dam crest under two-component earthquakes with PGA = 0.3 g near the fault. The two typical displacements time histories with the largest difference are highlighted

Fig. 21 Horizontal displacements of dam crest under two-component earthquakes with PGA = 0.4 g near the fault. The two typical displacements time histories with the largest difference are highlighted

Fig. 22 Horizontal displacements of dam crest under two-component earthquakes with PGA = 0.5 g near the fault. The two typical displacements time histories with the largest difference are highlighted
Similarly, to quantitatively evaluate the effect of the polarity of motions, the max horizontal displacements and settlements of the dam crest under two-component excitation within a few kilometers from the fault are listed in Tables 8 and 9. Under the 0.3 g, 0.4 g, and 0.5 g ground motion levels, the ratios of maximum to minimum of horizontal displacement of the dam crest(Hmax/Hmin), respectively, range from 1.06 to 1.66, from 1.06 to 1.98 and from 1.15 to 2.23 and the corresponding averages of 1.33, 1.40 and 1.49 are well above these under the horizontal component alone. Moreover, theHmax/Hmingreater than 1.1 accounts for 81%, 81% and 100%, greater than 1.2 are 72%, 81% and 72% of all cases, and greater than 1.3 are 45%, 63% and 63%corresponding to different ground levels. Likewise, the ratios of maximum to minimum of settlement of the dam crest (Smax/Smin), respectively, range from 1.13 to 1.60,from 1.10 to 1.44 and from 1.09 to 1.53, and the averages of 1.24, 1.22 and 1.26 also exceed 1.09, 1.09 and 1.11 using a single component as excitation. Furthermore, theSmax/Smingreater than 1.1 accounts for 100%, 91% and 91% of all cases, greater than 1.2 are 36%, 36% and 64%,and greater than 1.3 are 27%, 18% and 27% of all cases.This demonstrates that the response of high CFRDs is very sensitive to the different polarity of motion input,especially under two-component excitations, in which the asymmetric one-sided long-period pulses of nearfault excitation exert an important role.

Fig. 23 Settlements of dam crest under two-component earthquakes with PGA=0.3 g near the fault. The two typical displacements time histories with the largest difference are highlighted
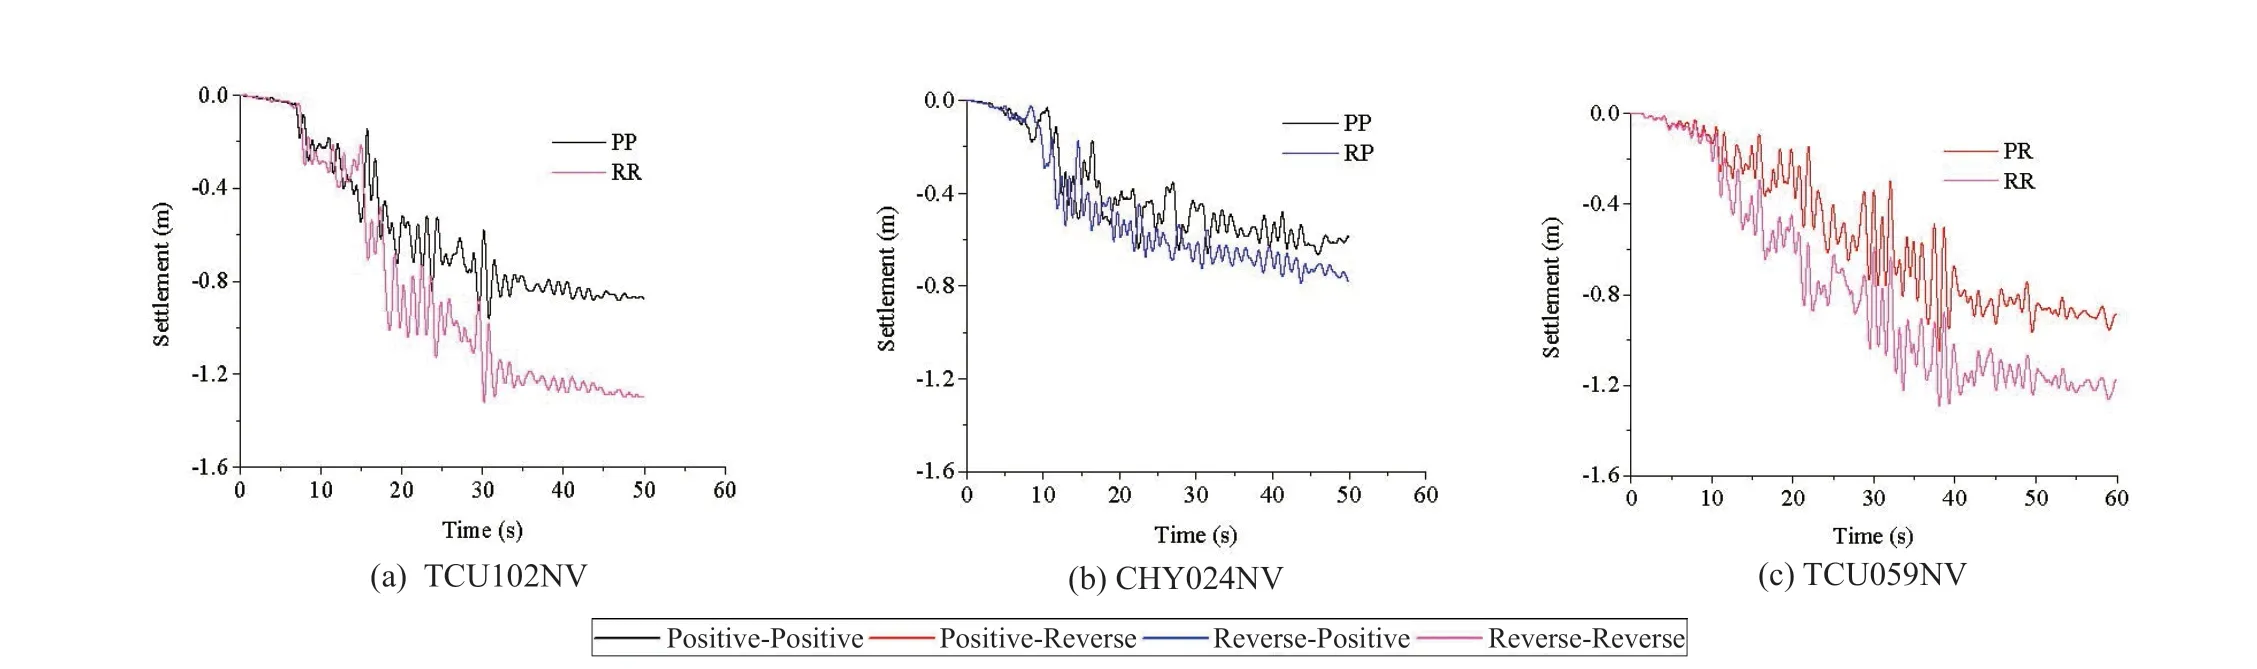
Fig. 24 Settlements of dam crest under two-component earthquakes with PGA=0.4 g near the fault. The two typical displacements time histories with the largest difference are highlighted
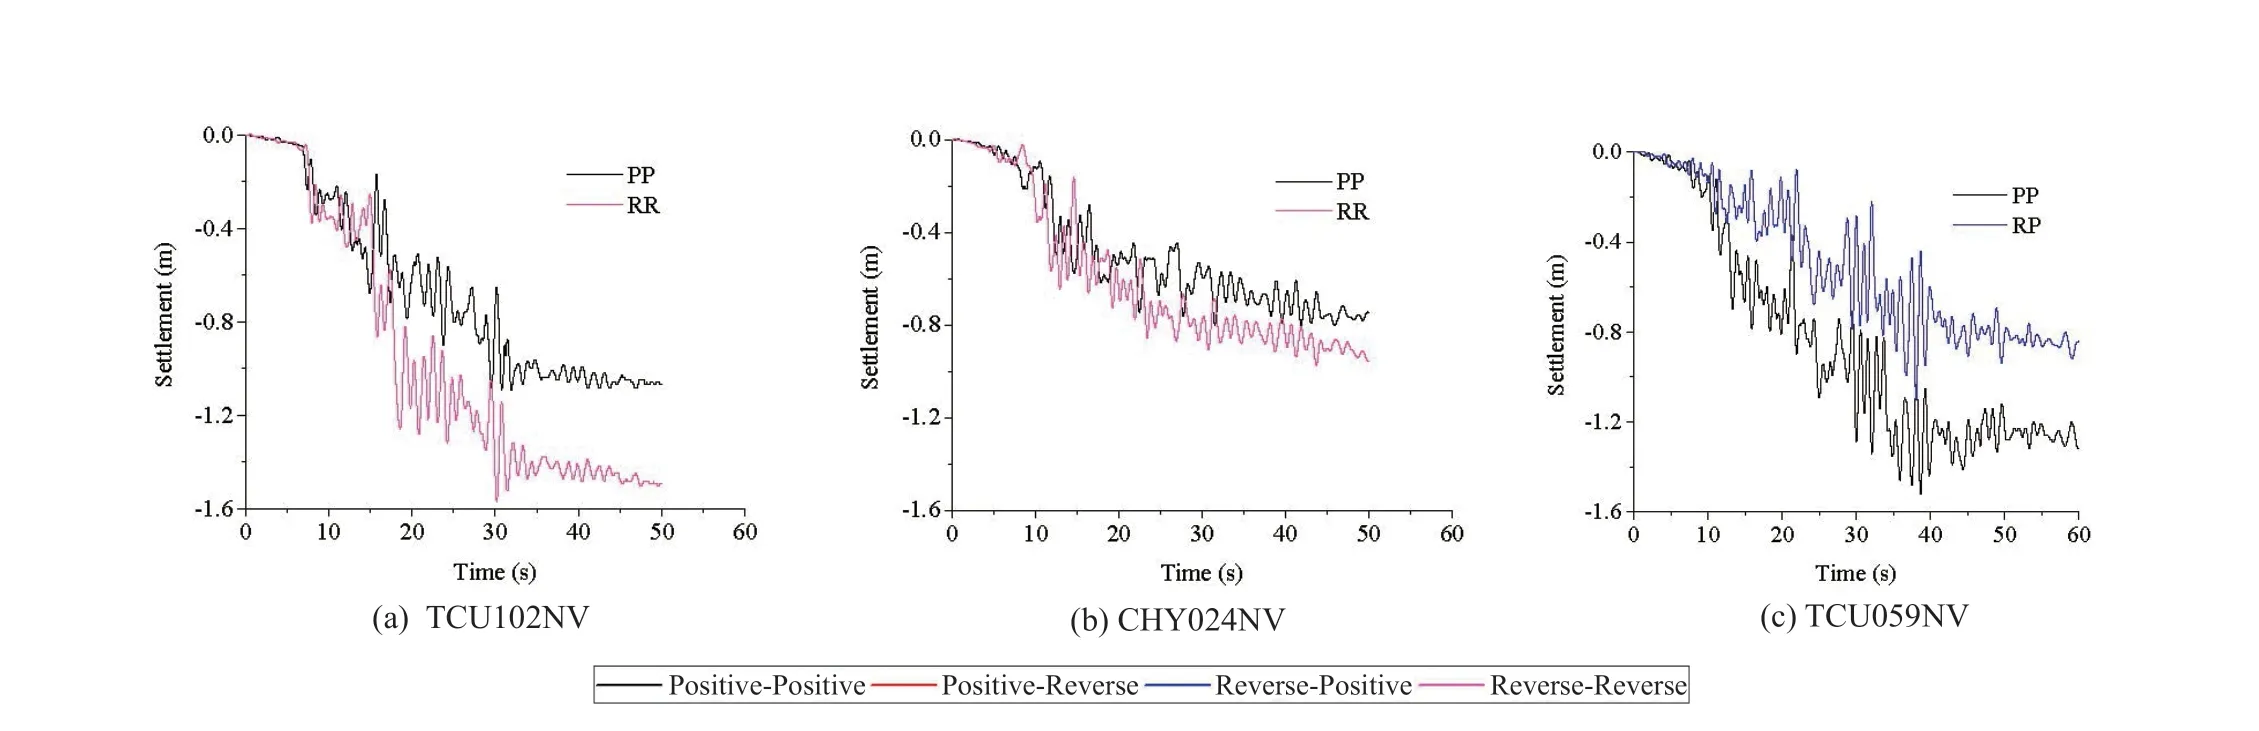
Fig. 25 Settlements of dam crest under two-component earthquakes with PGA=0.5 g near the fault. The two typical displacements time histories with the largest difference are highlighted

Table 8 Max horizontal displacements of dam crest for two-components motions near the faults
These results have verified and reinforced the validity of the aforementioned conclusions and further indicate that considering the asymmetric one-sided longperiod pulses of near-fault excitation or the polarity of excitation is of significance for seismic analysis.
7 Conclusions
Based on 690 finite element calculations, the deformation of Gushui CFRD with a height of 242 m considering the asymmetry of earthquakes is investigated and analyzed under three artificial seismic waves and 101 near-fault ground motions with 0.3 g, 0.4 g and 0.5 g ground motion levels. A modified generalized plasticity model is used to describe the dynamic behavior of the rockfill materials, while the deformation of the interface is depicted as employing an ideal elastic-plastic model.The earthquake motion input is achieved by the wave input method for a viscoelastic boundary. Some conclusions can be drawn from the above analyses as follows:
(1) The displacements of the dam crest corresponding to the positive and reverse input of nearfault ground motion make a significant difference,while the displacements of the dam crest under artificial seismic waves are similar, with ratios of maximum displacements only between 1.00 and 1.10. The large one-sided pulses of near-fault motions exert an important role in the responses of CFRDs.
(2) Using the horizontal and vertical components as simultaneous excitations, the displacements of the dam crest before and after reversing the motion produce a larger difference than that using a single component.With the different ground levels, the averages ofHp/HrandSp/Sr, respectively, are 1.21-1.28 and 1.09-1.11 under the horizontal components alone and the averages ofHmax/HminandSmax/Smin, respectively, are 1.33-1.49 and 1.24-1.26 under two-component motions.
(3) Under near-fault ground motion, the difference of the horizontal displacements of the dam crest increases with increasing earthquake intensity. Under 0.3 g, 0.4 g, and 0.5 g ground levels, the averages ofHp/Hrare 1.21, 1.24 and 1.28 and theHp/Hrmore than 1.3 are 20%, 26.70%,37.80% of all cases under the horizontal components of motions alone; and the averages ofHmax/Hmin,respectively,are 1.33, 1.40 and 1.49 andHmax/Hmingreater than 1.3 are 45%, 63% and 63% under two-component motions.
Given the randomness and uncertainties of earthquakes, it is necessary to consider the effect of polarity reversal of near-fault motions in earthquakeresistant analysis and engineering design of CFRDs,otherwise the damage to dams caused by an earthquake may be underestimated.
杂志排行
Earthquake Engineering and Engineering Vibration的其它文章
- Serviceability evaluation of water supply networks under seismic loads utilizing their operational physical mechanism
- Improving the seismic performance of base-isolated liquid storage tanks with supplemental linear viscous dampers
- Seismic fragility analysis of bridges by relevance vector machine based demand prediction model
- Over-height truck collisions with railway bridges: attenuation of damage using crash beams
- Seismic performance of a rectangular subway station with earth retaining system
- Optimization for friction damped post-tensioned steel frame based on simplified FE model and GA