Experimental study of vertical and batter pile groups in saturated sand using a centrifuge shaking table
2022-01-21ZhangJianLiYurunYanZhixiaoHuangDaRongXianandLiangYan
Zhang Jian, Li Yurun, Yan Zhixiao, Huang Da, Rong Xian and Liang Yan
1. School of Civil and Transportation Engineering, Hebei University of Technology, Tianjin 300401, China
2. Campus Construction and Management, Hebei University of Technology, Tianjin 300401, China
Abstract: To study the dynamic response of vertical and batter pile groups in saturated sand, dynamic tests of these pile groups in saturated sand were carried out using the ZJU400 geotechnical centrifuge at Zhejiang University. The following results were obtained. (1) As the motion intensity increased, the peak acceleration in soil layers at different depths significantly decreased, indicating that the soil stiffness was significantly reduced. (2) During the motion process, the instantaneous bending moment of the vertical and batter pile groups at different depths changed continuously, which had a strong relationship with the saturated sand liquefaction. In the process of sand liquefaction, the residual bending moment generated by the batter pile was more obvious than that of the vertical pile. (3) With the liquefaction of the saturated sand, the distribution of the maximum bending moment of the vertical pile group changed, and the bending moment near the pile cap of the vertical and batter pile groups was always large. (4) In certain cases, the horizontal acceleration and dynamic displacement of the vertical pile cap were amplified. When the motion intensity was large, residual displacement of the batter pile cap occurred.
Keywords: centrifuge shaking table; vertical and batter pile group; saturated sand; liquefaction; dynamic response
1 Introduction
As an important type of deep foundation, pile foundations have been widely used in various engineering applications. In areas with poor geological conditions,the advantages of pile foundations are prominent. Due to their wide application range, especially in marine environments, pile foundations have begun to attract attention. However, the factors affecting the performance of pile foundations in marine environments are very complicated, and earthquake activity is a particularly significant factor affecting pile foundations because earthquakes are often accompanied by sand liquefaction in the marine environment. Therefore, many scholars have preliminarily explored the seismic performance of pile foundations under the condition of liquefaction.
The methods currently used by some scholars to study such problems include model tests and numerical simulations. Model test studies are mainly based on shaking table tests and centrifuge shaking table tests. Miyajimaet al.(1991) conducted a shaking table test under the condition of saturated sand to investigate the influence of the slope and thickness of sand on soil deformation at an early stage. Zhuanget al.(2015, 2018)conducted a detailed study of the changes of relevant parameters after sand liquefaction. Meanwhile, the modulus decay functions for post-liquefaction Nanjing sand in different loading stages were formulated based on the test results. Samuiet al.(2012) studied the lateral instability buckling of piles in 26 pile foundations under applied axial loads, considering the liquefaction of soil around the pile. Suet al.(2016) analyzed the damage due to liquefaction-induced lateral spreading of a single pile behind a retaining wall and proposed a beam on nonlinear Winkler foundation (BNWF) model. This model better predicted the observed pile response compared to simple soil pressure approaches. Linget al.(2006) carried out a model test of a pile foundation by using a large shaking table and observed sand liquefaction and its influence on the damage of the pile foundation through the input of different earthquake intensities. Huanget al.(2013) studied the dynamic pile-soil-structure response under earthquake action through a small shaking table dynamic model test. With changes in the excess pore pressure, the saturated sand gradually liquefied from top to bottom, and the settlement of the structure increased;in addition, the pile-soil-structure interaction effect increased the seismic response of the upper structure.Lianget al.(2017a) studied the seismic responses of pile foundations supporting a long-span cable-stayed bridge and considered the seismic soil-pile-structure interaction through multifunctional shake tables. Panahet al.(2018) studied the effects of different inclination angles on the seismic performance of micropiles by performing shaking table tests. The results of this study indicate that inclined micropiles exhibit a better seismic performance than vertical micropiles. Cengiz and Guler(2018) studied the response of geosynthetic composite gravel piles and ordinary gravel piles under dynamic loading by performing shaking table tests. Yanget al.(2018) studied the pile-soil interaction mechanism under the condition of liquefied soil overlying a frozen soil layer during shaking table testing. Their setup provided data for computer model calibration and offered insight into the impact of frozen ground crust on the seismic performance of piles under lateral spread induced by liquefaction.
The above review introduces some of the research progress on pile foundations at liquefaction sites based on the use of shaking table tests, which are commonly used to research such problems. However, to correctly capture the stress-strain behavior of the soil in scaled models of geotechnical problems and overcome the constraints of model size, researchers in China and around the world have gradually recognized the advantages of centrifuge shaking table model tests. Bolandet al.(2001a, 2001b)conducted a series of dynamic centrifugal tests on vertical and batter pile groups, and the configurations chosen for the tests are generalized representations of typical pile-supported wharf structures from ports in the western US.
Researchers have also conducted dynamic centrifugal tests on the dynamic response of pile foundations for different test conditions. Su and Li(2006) studied the variation in lateral soil resistance and the evolution of the horizontal pile-soil interaction of a single pile in saturated sand by using a centrifuge shaking table. Wanget al.(2012, 2016) studied the influence of the permanent displacement of the sloping ground before and after liquefaction on the horizontal stress of a single pile by using centrifuge shaking table tests. At the same time, related problems were studied in more detail through numerical simulations. Liuet al.(2018) studied variations in the pile body response of a pile group foundation under the condition of earthquake liquefaction by using centrifuge shaking table tests.Huiet al.(2018) proposed a new method for analyzing a pile-soil system using the ground motion parameter index by analyzing the centrifuge shaking table test of a single pile.
The researchers mainly studied the dynamic response of a single pile in saturated sand. The single pile model can clearly show the mechanical behavior of the pile foundation in saturated sand, although the pile group model is more common in engineering construction.Therefore, research on pile group is also particularly important.
Zhanget al.(2008) performed dynamic centrifuge tests on pile groups embedded in loose sand, including a 2×4 pile group composed of eight vertical piles and a 2×4 pile group with four batter piles and four vertical piles. Liet al.(2016) studied the response of batter piles under different base shaking signals and superstructures in unsaturated soils during an earthquake. Zhang and Yang (2018) studied the influence of ground motion parameters on the pile-soil response in both liquefied and non-liquefied soils using a three-dimensional finite element analysis model corrected by centrifuge test data.Hussienet al.(2016) carried out a series of centrifuge experiments, including experiments to determine the dynamic response characteristics of single piles, 3×3 piles, and superstructures in sand, and compared the bending moment distributions of piles at different locations. Lianget al.(2016) studied the influence of high and low cap forms on the distribution of the pile bending moment under the condition of an unsaturated soil foundation through the use of centrifuge shaking table tests.
The above literature shows that researchers have studied the dynamic response of vertical and batter pile groups in dry sand using dynamic centrifuge tests.However, research on vertical pile groups is more detailed, while fewer studies have focused on the dynamic response of batter pile groups in saturated sand.
As mentioned above, the most common research method other than model testing is numerical simulation.Choobbastiet al.(2012) used the finite difference method to study the pile foundation response and pile-soil interaction after the soil had liquefied under earthquake loading. Li and Motamed (2017) investigated a largescale model test on the E-Defense shaking table facility in Japan and established a two-dimensional nonlinear dynamic finite element model to study the interaction of a pile-soil system considering the two-dimensional effective stress. The results of the coupled finite element model analysis and the experimental results were compared using OpenSees. Lianget al.(2017b)considered a three-dimensional soil column distribution mass system model built on the OpenSees simulation platform to provide appropriate applications of nonlinear ground response analysis in soil-pile-structure interactions. Zhang and Yang (2018) used numerical simulation to analyze the dynamic response of pile foundations in laterally spreading frozen ground crust overlying liquefiable soils. Panaghiet al.(2019) used OpenSeesPL to numerically simulate mildly sloping liquefied ground under dynamic loads. Chatterjeeet al.(2019) used FLAC3D to compare the dynamic response of single piles under liquefied and non-liquefied sites.
In summary, the shaking table test has become a popular method of studying the seismic behavior of pile foundations in liquefied soil. However, prototype test conditions have not been adequately realized using shaking table tests. Moreover, the dynamic responses of pile foundations have also been studied via centrifuge shaking tables. The study of single piles and pile groups under non-liquefied ground conditions and of vertical pile groups under liquefied soil have been preliminarily researched, and the related seismic damage mechanism requires further exploration. In particular, research on the seismic performance of batter piles under liquefied soil conditions has rarely been conducted using constant 1-g shaking tables or centrifuge shaking tables.Therefore, a detailed study of the seismic liquefaction of saturated sand and the dynamic response of a high-rise platform pile foundation is conducted by using two sets of centrifuge shaking table tests.
2 Centrifuge shaking table test setup
The device used in this experiment is the Zhejiang University ZJU400 centrifuge (Chenet al., 2011), which is a centrifuge jointly developed by Zhejiang University and the China Academy of Engineering Physics (Fig. 1).The rated load of this device is 400 gt, and the maximum centrifugal acceleration is 150 g. The maximum effective radius of rotation is 4.5 m. In the dynamic test, due to the participation of the vibration table and considering the reliability of the test, the centrifugal acceleration can reach 100 g. To meet the needs of sensor placement during the test, 80 dynamic data acquisition channels are allotted (Fig. 2).
The shaking table (Fig. 3) was jointly developed by Zhejiang University and the Japan Solution Company. Its driving mode is an electrohydraulic servo hydraulic drive,which can realize horizontal one-dimensional vibrations at a vibration amplitude of ±6 mm and a frequency range of 10-200 Hz. The maximum vibration acceleration and speed are 40 g and 150 cm/s, respectively. The shaking table has a size of 900 mm×800 mm. It can drive a mass weighing 500 kg.
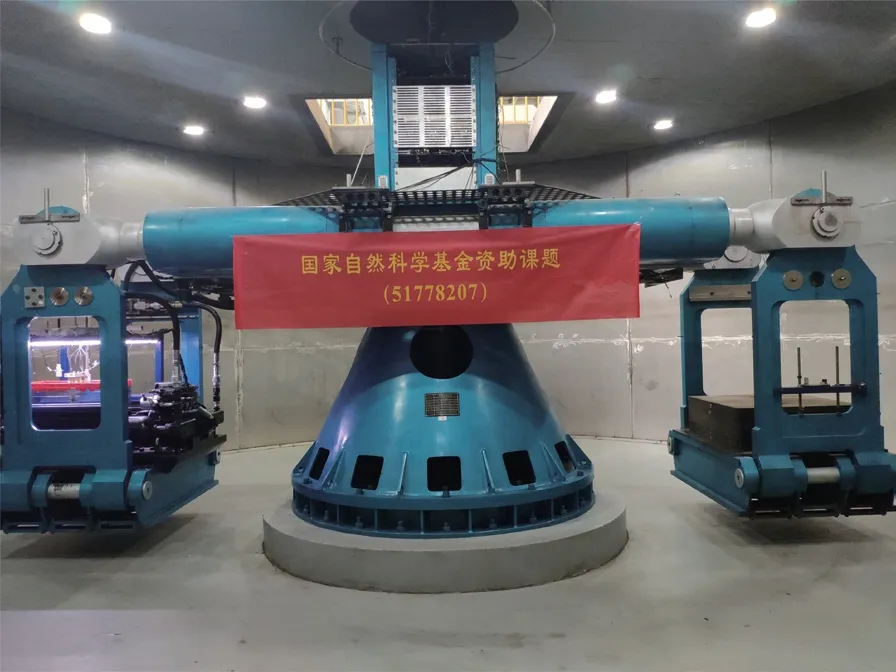
Fig. 1 Geotechnical centrifuge
In this test, the influencing factors were comprehensively considered in the selection of the container; ultimately, a laminary box (Fig. 4) was used as the container for the test. Eight permeable stones were installed at the bottom of the sand box to facilitate the inflow of liquid during saturation. The container was made of a laminated aluminum alloy, and between the layers of the frame, approximately 2-mm thick bearing couplers were installed. The design concept was proposed by Whitman and Lambe (1986). The benefit of laminar boxes is that they can be designed to have a minimal contribution to the combined stiffness and mass of the soil-box system. The specific parameters are shown in Table 1.
3 Centrifuge test procedure
3.1 Scaling law of centrifuge test
Because the greatest advantage of the geotechnical centrifuge is that the entire model can be compressed bythe centrifugal field, the consistency of the test results with the prototype site conditions is greatly improved.During a centrifuge test, according to the scaling laws for theng centrifugal field, the gravity, acceleration, and frequency are increased byntimes while the length and time are reduced byntimes. The scaling laws of greater physical quantities are shown in Table 2. The stress and strain measured at the scale of the model are the same as the stress and strain experienced by the prototype.Additional information on geotechnical centrifuge scaling laws can be found in Schofield (1980, 1981). In this study, all the tests were performed at a centrifugal acceleration of 50 g (n= 50).
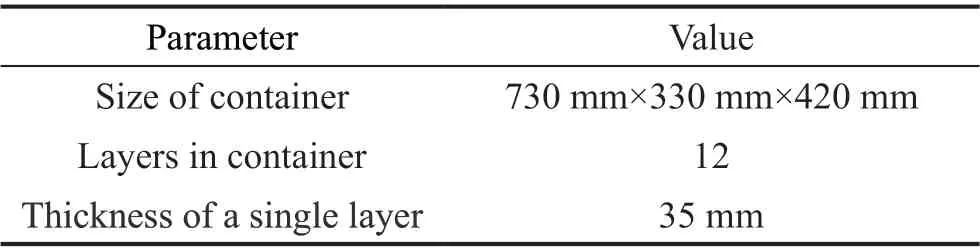
Table 1 Laminary box parameters
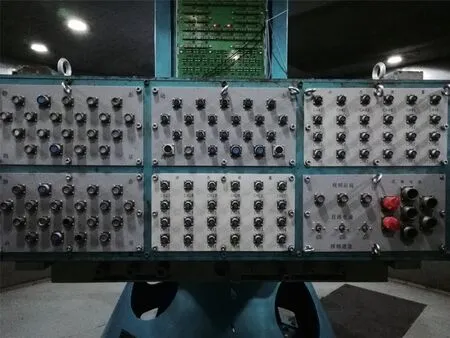
Fig. 2 Dynamic data acquisition channel
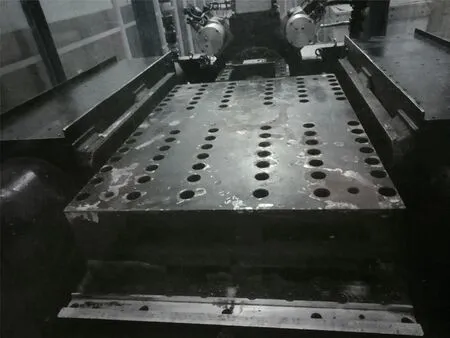
Fig. 3 Shaking table

Fig. 4 Laminary box
3.2 Base shaking signal selection
The main research content of this experiment is the pile body response of vertical piles and batter piles under the action of saturated sand. However, the frequency component of the sine wave is simple, and its physical meaning is concise and clear, which simplifies the input load form to a certain extent, allows the test results to be more clearly defined, and provides better initial conditions for subsequent data analysis. Therefore, a sine input with a relatively simple spectral component is selected. The test conditions are shown in Table 3.
3.3 Model design
Considering the effects of the prototype size, test materials, and test conditions, the test similarity ratio was determined to be 1: 50. This test was designed to study the dynamic behavior of the piles of offshore platforms,so the model was simplified as shown in Figs. 5-6.The test pile foundation models mainly consider the similarity of the bending stiffness. Ultimately, 6061 aluminum alloy is used as the model material, and its detailed dimensions are determined according to the design similarity ratio (Figs. 7-8). The average grain diameter of the sand used in this test is much smaller than the pile diameter. According to the test results of Ovesen (1979), when the pile diameter is more than 30 times greater than the average grain diameter of sand, the scaling law of the soil grain has little influence on the test results. In the model test, the soil used was sand from thearea around Fujian, China. After the soil was taken back to the laboratory, it was minimally treated and directly tested as the foundation soil for the test. As a common test material, Fujian sand is used in many geotechnical tests in China. Considering the more convenient testing conditions for subsequent studies, the test soil is the common Fujian standard sand, which has an average particle diameterd50of 0.00016 m, a specific gravity of 2.645, a maximum void ratio of 0.961, a minimum void ratio of 0.615, and a permeability of 3.14×10⁻⁴. The model is prepared by an air pluviation technique. The relative density of the sand is controlled to be 50%by adjusting the falling sand height. In the pluviation process, the acceleration and pore pressure transducers are placed in different sand layers according to the design position (Figs. 9-10). After the preparation of the dry sand model is completed, because centrifugal artificial gravity occurs in the test, silicone oil with a viscosity of 50 cSt is used instead of water for saturation to consider the influence of the liquid flow rate in the sand. The stability of silicone oil is good. Zhouet al.(2018) conducted a dynamic centrifuge model test at Zhejiang University according to the LEAP-GWU-2015 experimental specifications. To satisfy the scaling law for dynamic centrifuge testing, silicone oil was used as the pore fluid.

Table 2 Scaling laws of the model to the prototype
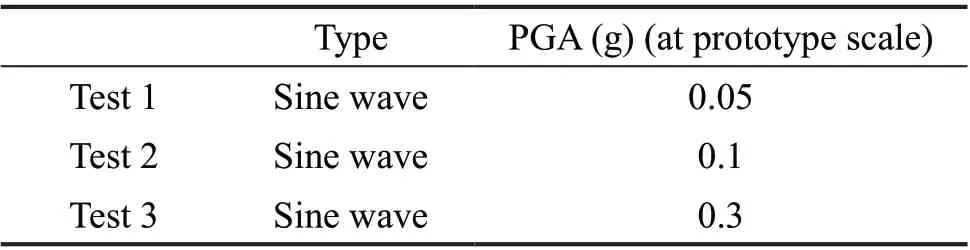
Table 3 Test conditions

Fig. 5 Vertical pile model
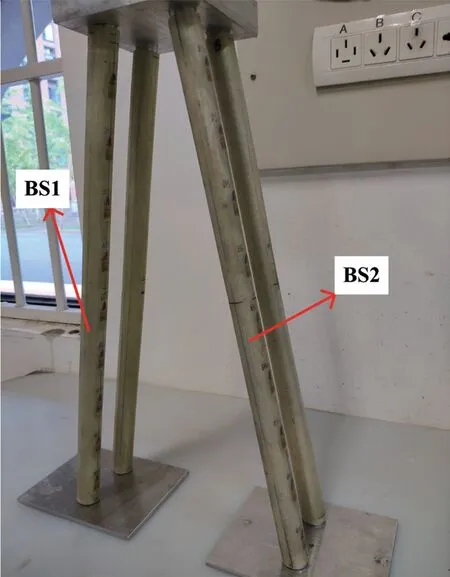
Fig. 6 Batter pile model
Saturation was accomplished using a vacuum device(Fig. 11). Before saturation began, silicone oil was added to the oil tank, the prepared dry sand model container was placed in a vacuum box, the vacuum box and the oil tank were sealed, and the silicone oil and the model container were placed under the same vacuum for 24 h.Then, the valve from the oil tank to the saturated box was opened, and the silicone oil in the oil tank was slowly injected into the prepared dry sand model container until the entire model was saturated. Throughout the above process, the model container was placed under a vacuum of approximately 80 kPa; in addition, the oil tank and model container were kept under the same vacuum.
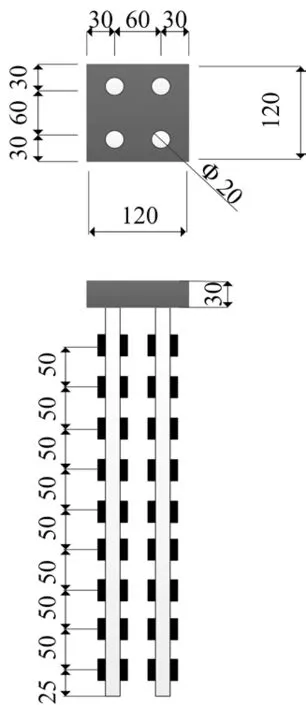
Fig. 7 Geometrical characteristics of the vertical pile (at model scale in mm)
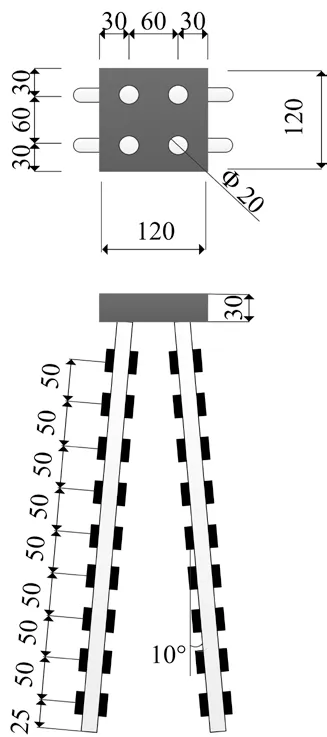
Fig. 8 Geometrical characteristics of the batter pile (at model scale in mm)
The testing was divided into two groups of tests,and the test conditions were consistent except for the pile type. The pile toes were rigidly attached to the base to simulate the end-bearing pile. Escoffieret al.(2008) used the form of end-bearing piles to study the dynamic response of pile groups through centrifugal tests. In each test, seven accelerometers were set at different depths in the sand and two accelerometers were arranged on the shaking table surface and on the pile cap. A1 was set on the shaking table, A9 was set on the pile cap, and A2-A8 were embedded in the sand. These transducers measured the acceleration of the shaking table during the test, the accelerations at different depths in the sand, and the acceleration of the pile cap. The data was recorded and saved in real-time format. Seven pore pressure transducers, numbered P1-P7, were installed to measure the variation in the pore pressure at different depths and inside and outside the pile groups. On the side of the pile cap, a laser displacement transducer, J1,was horizontally arranged along the vibration direction to measure the horizontal displacement of the pile cap during the vibration process. A target was placed on the surface of the sand near the pile, and a laser displacement transducer, J2, was arranged vertically above the target to measure the settlement of the sand during the experiment. The position of each transducer and the size of the model are shown in Figs. 12-13. In each set of tests, there were two piles with strain gauges.Figure 14 shows the strain gauge placement process.The specific locations of the strain gauges are given in Figs. 7-8. In this test, the relationship between the output voltage value of the data acquisition system and the bending moment was determined by the bending moment calibration method. Because the size of the pile was small, the simple beam form shown in Fig. 15 was adopted, and the relationship between the voltage and the bending moment was calibrated according to the bending state thereof. Then, the bending moment value of the prototype was obtained by the similarity ratio. For clarity and consistency, all the measurements mentioned below were given at the prototype scale.
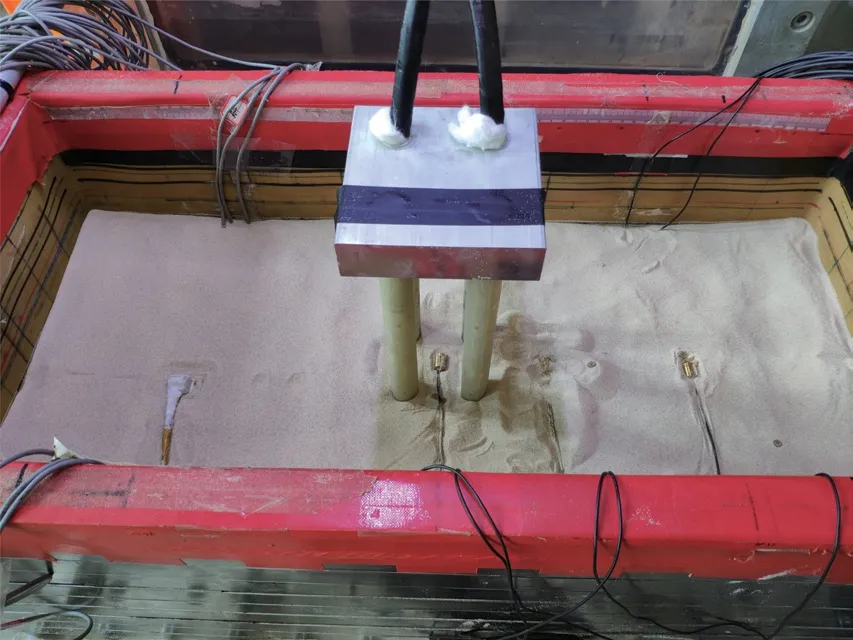
Fig. 9 Foundation soil preparation and transducer layout(vertical pile)

Fig. 10 Foundation soil preparation and transducer layout(batter pile)
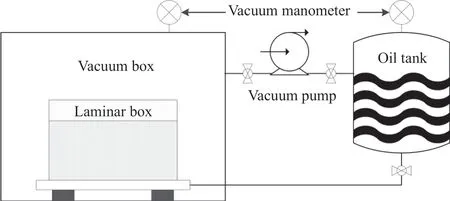
Fig. 11 Schematic of the saturation system
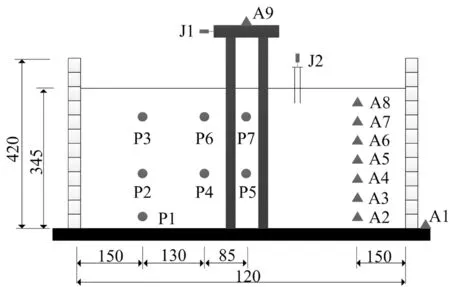
Fig. 12 Configuration of the sensors in the vertical pile test (at model scale in mm)

Fig. 13 Configuration of the sensors in the batter pile test (at model scale in mm)
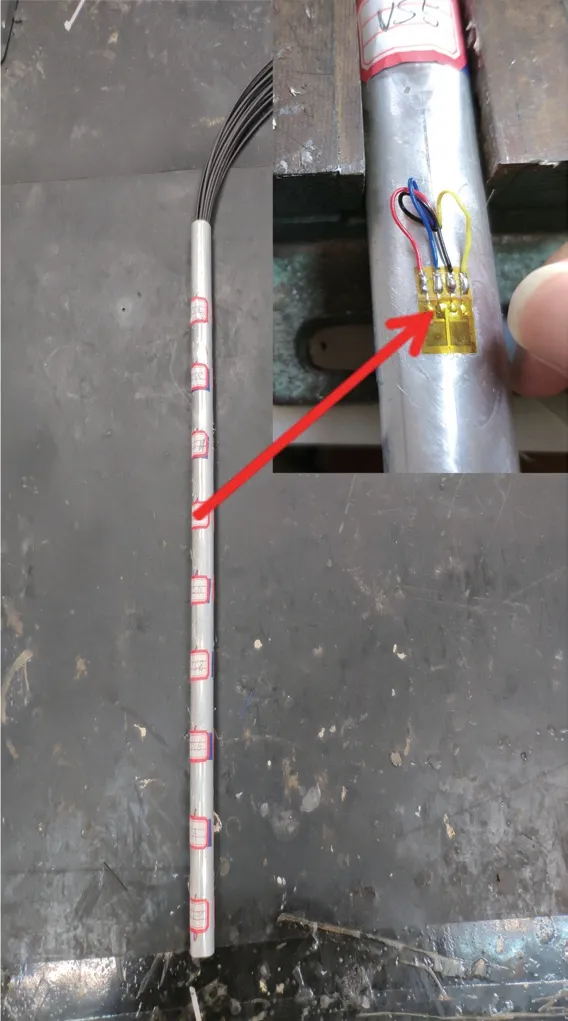
Fig. 14 Setting of pile bending strain gauges
4 Results and analysis
4.1 Acceleration of the shaking table
During the two sets of experiments, data are collected from each accelerometer. The data collected by the shaking table accelerometer (A1) are taken as the real input waveform of the model. Figure 16 shows the original and processed acceleration signals of the shaking table output under the condition of 0.05 g in the two groups of tests. In the process of common structural dynamic testing, due to the influence of factors such as the circuit, sensor, and test equipment, some unnecessary high-frequency components may be mixed in the test results. The shaking table included in the geotechnical centrifuge equipment used in this test works during high-speed rotation. Therefore, these factors will have a significant impact on the test results. The sine wave prototype frequency is 1 Hz. The Fourier spectrum in Fig.16 clearly shows that the main frequency component is at 1 Hz. Therefore, to cancel the adverse effect of the highfrequency component on the test results, the acceleration signal output from the shaking table is subjected to lowpass filtering processing.
The processed acceleration signals under other conditions are shown in Fig. 17. Because of the low prototype frequency, the acceleration peak has a certain attenuation after filtering. However, the acceleration signal pattern of the table output is clearly consistent with the signal pattern input by the shaking table controller. Therefore, the validity of the input signal is also verified. At the same time, the shaking table acceleration time history of the two sets of experiments shows that the input waveforms of the two tests are highly consistent, which provides a good basis for the later analysis of the dynamic response of the two pile foundation models.
4.2 Acceleration responses of different soil layers

Fig. 15 Calibration of pile bending strain gauges

Fig. 16 Acceleration time histories (original and processed) of the shaking table output and the Fourier spectrum of the original signal of the two groups of tests ((a) vertical pile group, (b) batter pile group) under the condition of 0.05 g

Fig. 17 Acceleration time histories of the shaking table data with different intensities (vertical pile group and batter pile group)
The acceleration of the sand at depths of 16 m, 13.5 m,11 m, 8.5 m, 6 m, 3.5 m, and 1 m (A2-A8) was measured during the test. Figure 18 shows the acceleration time histories for different burial depths (16 m, 11 m, 3.5 m,and 1 m) at 0.05 g, 0.1 g, and 0.3 g peak accelerations.In the case of 0.05 g, the peak acceleration of the uppermost accelerometer (A8, depth=1 m) showed a decrease in a short period after the start of vibration and a rapid decrease to approximately zero. As the intensity increased, the decrease of the peak acceleration gradually spread to the deeper soil layer. When the peak acceleration of the shaking table reached 0.3 g, the peak acceleration of all the sand layers appeared to decrease during the vibration process.
The main reason for the above phenomena may be the increase in the excess pore pressure of the sand during the vibration process, which can reduce the pressure only by continuous upward draining. The large peak acceleration caused the excess pore pressure throughout the sand layer to quickly rise, which caused the stiffness of most of the sand to decrease to various extents, and this change was more obvious in the upper layer. Eventually, the peak acceleration of the soil layers decreased as the depth decreased.
4.3 Bending moment
4.3.1 Residual bending moment
During an earthquake event, due to permanent soil deformations and the influence of the superstructure,pile foundations may move from their initial position.Permanent lateral displacements may occur at the pile head and along the pile. Therefore, the total bending moment can be decomposed into two parts: a residual part and a dynamic part. The residual bending moment is defined as the difference between the bending moment at the beginning and end of the earthquake event.
The residual bending moments show different phenomena under different ground motion intensities(Fig. 19). When the ground motion intensity was low,the residual bending moment of the pile with a deeper depth had a significant influence on the total bending moment. The reason may be that the sand had not reached liquefaction at 0.05 g. The deep soil constrains the pile body more obviously. In combination with the fixed pile end, the result was a large residual moment at a depth of 16 m under 0.05 g. As the motion intensity increased,the influence of the residual bending moment of the pile with a deeper depth on the total bending moment was obviously weakened, but the residual bending moment of the upper part of the pile was slightly larger. During the increase of the excess pore pressure, the dynamic bending moments of the pile at different positions had different degrees of amplification.
A comparison ofaandbin Fig. 19 shows that the residual bending moment of the batter pile group is obviously larger than that of the vertical pile group in most cases. Therefore, the residual bending moment and the maximum dynamic bending moment of the vertical and batter pile groups are compared (Fig. 20).The residual bending moment of the vertical pile group is larger than the dynamic bending moment at a depth of 16 m under the condition of 0.05 g, and in all other cases, it is obviously smaller than the dynamic bending moment. The residual bending moment of the batter pile group is very close to the dynamic bending moment in the case of 0.05 g and 0.1 g. Under the condition of 0.05 g, the residual bending moment of the batter pile group at the depth of 11 m is obviously larger than the dynamic bending moment. However, under the condition of 0.3 g, the residual bending moments of the vertical and batter pile group are significantly smaller than the dynamic bending moment.
4.3.2 Dynamic bending moment
The analysis of the residual bending moment and dynamic bending moment shows that the dynamic bending moment has a significant influence on the total bending moment of the vertical and batter pile groups in most cases, especially when the acceleration peak reaches 0.3 g. Therefore, according to the change of the excess pore pressure ratio (EPPR) and the maximum dynamic bending moment, the instantaneously measured bending moment profiles are compared and analyzed in each motion process.

Fig. 20 Residual bending moment and maximum dynamic bending moment of vertical and batter pile groups
Figure 21(a) shows that under the condition of 0.05 g, the instantaneous measured bending moment profile (VS1) is basically consistent at different times. With the increase of the vibration intensity (0.15 g), the larger bending moment of the pile extends to the deeper soil. When the vibration intensity reaches 0.3 g, the bending moment of the pile body shows a tendency to gradually increase from the bottom to the top over time. This result may be related to the weakening of the constraint effect of the upper soil on the pile body under increases in the excess pore pressure ratio, which changes the distribution of the internal force of the pile body.
A comparison of Figs. 21(a) and 21(b) shows that the larger bending moment of the pile body (BS1) of the batter pile group gradually moves down from the position of the pile top to a certain depth (3.5 m) with increases in the vibration intensity. The bending moment at the top of the pile of the batter pile group shows that regardless of the vibration intensity, the bending moment gradually decreases with time. This phenomenon is different from the changing trend of the bending moment on the top of the vertical pile group.
4.3.3 Maximum bending moment
In the above section, the effects of residual bending moments and the variation of dynamic bending moments along the buried depth at different moments were discussed. However, the maximum bending moment of piles at different depths will occur at different times.From the perspective of reliability, the maximum value of pile bending moments at different moments should be considered as the most unfavorable factor in the design process. In view of the above problems, the maximum bending moment of the vertical and batter pile group during the vibration process are compared and analyzed.
Figure 22 shows that under the condition of saturated sand, the bending moment envelope diagram of the vertical pile groups changes greatly as the vibration intensity increases, which causes the maximum and minimum positions of the bending moment envelope of the pile below the soil surface to move down. The minimum positions are -1 m, -3.5 m, and -6 m, and the maximum positions are -6 m, -11 m, and -11 m. Combined with Fig. 23, it can be found that as the vibration intensity increases, the excess pore pressure ratio increases at different depths, which leads to the gradual increase of the liquefaction depth of the soil and the weakening of the constraint effect of the deep soil on the pile body.Therefore, the bending moment distribution of the pile body changes as mentioned above.

Fig. 21 Instantaneously measured bending moment profiles of (a) vertical and (b) batter pile groups under different input signals

Fig. 22 Maximum positive and negative bending moment envelopes of vertical and batter piles for different conditions
However, near the joint of the pile cap, the bending moment envelope diagram of the vertical and batter pile group has a large value. At the same time, the bending moment envelope diagram of the batter pile group under the soil surface has not significantly changed. However,under the condition of 0.3 g, the bending moment envelope diagram of the entire pile body of the batter pile group is larger than that of the vertical pile group,which shows that under the condition of saturated sand,the bending rigidity near the connection between the pile and the cap should be carefully considered in the design of both vertical and batter pile foundations, although the bending moment of the batter pile group should be more carefully considered than that of the vertical pile group when the vibration intensity is relatively high (0.3 g).
4.4 Dynamic response of the pile cap
4.4.1 Acceleration
Figure 24 shows the acceleration time histories of the caps of vertical and batter piles under different ground motion peaks. Figure 24(a) shows that in the cases of 0.05 g and 0.1 g, the acceleration of the vertical pile cap has an obvious amplification phenomenon, and the larger the peak value, the larger the amplification effect.After the test is finished, the acceleration of the cap will exhibit a certain phase lag. Figure 24(b) shows that the amplification phenomenon of the peak acceleration of the batter pile is significantly reduced when compared with that of the vertical pile, especially in the case of 0.1 g. In the case of a 0.3 g peak acceleration, the acceleration of the vertical pile cap is basically the same as that of the shaking table in the initial stage, but it quickly decreases,and the amplitude of the cap acceleration is smaller than that of the shaking table until the vibration ends. A phase lag does not occur after vibration, and the acceleration of the cap and table simultaneously return to approximately zero. However, the above phenomenon does not occur in the batter pile, although as the vibration progresses,the acceleration of the cap has a certain phase lag when compared with the vibration table.
An analysis of the above-mentioned phenomena shows that as the vibration intensity and excess pore pressure ratio increase, the constraint effect of soil on the pile body is obviously weakened, which has a significant impact on the horizontal acceleration of the pile cap of the vertical pile group (for example, the peak acceleration amplification, phase lag, etc.) and no peak acceleration amplification for the batter pile group.
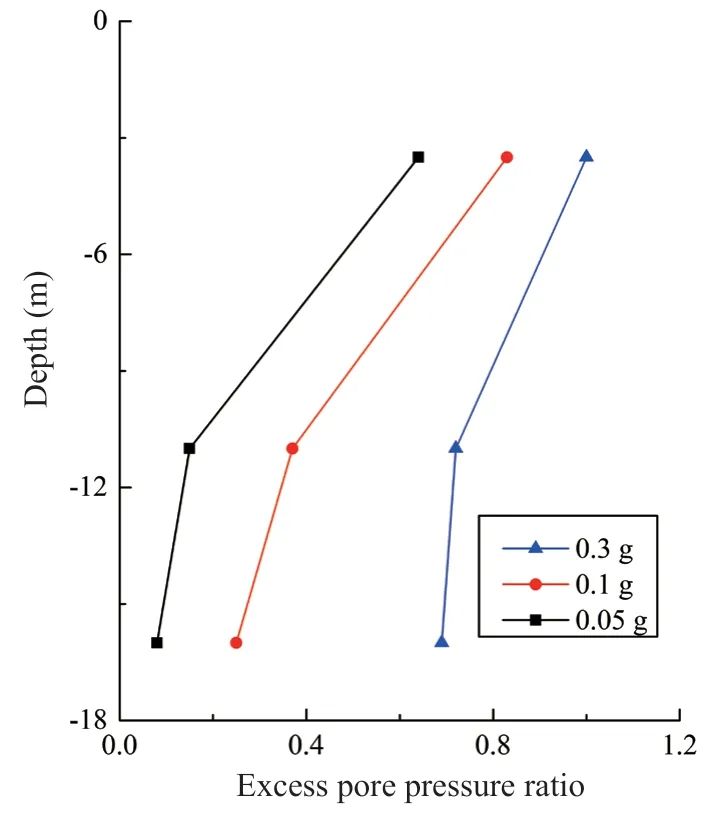
Fig. 23 Variation of the maximum excess pore pressure ratio in different soil layers during vibration
4.4.2 Displacement
Figure 25 shows that as the peak acceleration increases, the horizontal displacement of the vertical and batter pile caps tends to increase. A comparison and analysis of the horizontal displacement of the vertical and batter pile caps under different acceleration peaks shows that the horizontal displacement of the vertical pile cap is larger than that of the batter pile at 0.05 g and 0.1 g. Moreover, the greater the peak acceleration, the greater the difference. In the case of 0.3 g, the horizontal displacement of the vertical pile is also significantly larger than that of the batter pile in the initial stage of vibration. However, in the subsequent process, the horizontal displacement of the vertical pile cap decreases gradually. The residual displacement of the batter pile caps is obvious in the late stage of vibration.
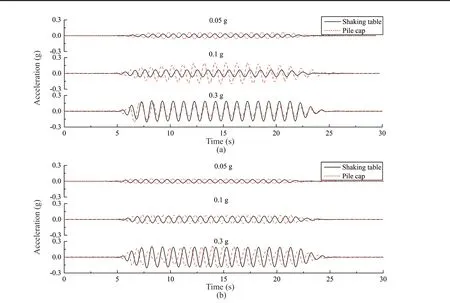
Fig. 24 Acceleration time histories of different intensities for vertical (a) and batter (b) pile caps
The above analysis shows that under the condition of saturated sand soil, the horizontal displacement of the vertical pile cap is obviously amplified and the batter pile cap has an obvious residual displacement under a large vibration intensity. However, when the pile toes attach to the base, the displacement of the batter pile cap does not appear to be significantly enlarged. However, the test results show that in most cases, the dynamic response of the batter pile cap is not significantly amplified. This phenomenon may have a very important relationship with the rigid connection between the pile toes and the rigid base in this test. Therefore, the batter pile group may have an advantage in reducing the horizontal dynamic responses of the cap for some cases.
5 Conclusions
In this study, the acceleration response of saturated sand at different depths under several vibration intensities was examined by using a centrifuge shaking table.Meanwhile, the excess pore pressure ratio of different soil layers was combined with the bending moment of the pile body, and the distribution of the bending moment was analyzed in detail. Finally, the dynamic responses of the vertical and batter pile caps were compared and analyzed. The main conclusions are as follows.
(1) As the intensity of motion increases, the weakening phenomenon of the soil stiffness becomes more obvious and is more significant in the deep sand.Eventually, the peak acceleration of the soil at different buried depths is significantly reduced.
(2) In most cases, the residual bending moment of the batter pile group is larger than that of the vertical pile group, and this phenomenon is more obvious as the soil liquefaction range increases. When the vibration intensity is small, the dynamic bending moment of the vertical pile is obviously larger than that of the batter pile, and when the vibration intensity is large, the dynamic bending moment of the batter pile obviously increases and exceeds that of the vertical pile.
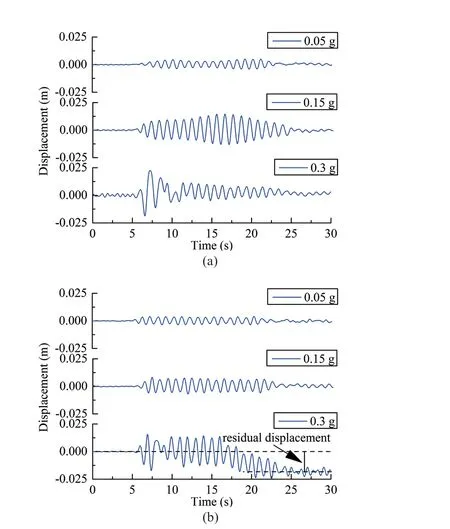
Fig. 25 Displacement time histories of different intensities for(a) vertical and (b) batter pile caps
(3) In saturated sand, as the motion intensity increases, the vertical pile group gradually moves downward at the maximum bending moment of the pile below the soil surface, although this phenomenon does not occur in the batter pile group. At the same time, the bending moments near the pile caps of the two pile types are always large. Therefore, the design of the vertical pile group under the condition of saturated sand should consider the change of the position of the maximum bending moment value. The connection between the pile and the cap should be strengthened regardless of whether it is a vertical pile or a batter pile.
(4) In some cases, the dynamic response of the pile cap of the vertical pile group shows a significant amplification phenomenon, although this phenomenon does not occur in the batter pile group in all cases.Therefore, in some cases, the batter pile group is more effective for reducing the dynamic response of the pile cap. However, when the motion intensity is large, a large residual displacement occurs in the cap of the batter pile group.
The above conclusions are obtained only under the conditions of this test. However, factors such as the material properties of sand, the type of the pile foundation, the height of the cap, and the angle of the batter pile may affect the test results. Therefore, these factors should be considered in detail in subsequent studies.
Acknowledgment
This work was supported by the National Natural Science Foundation of China (Grant No. 51778207),the Natural Science Foundation of Hebei Province(Grant No. E2018202107), and the Project of Graduate Students′ Innovative Ability Training of Hebei Province(Grant No. CXZZBS2019041).
杂志排行

Earthquake Engineering and Engineering Vibration的其它文章
- A review of the research and application of deep learning-based computer vision in structural damage detection
- Analytical evaluation and experimental validation on dynamic rocking behavior for shallow foundation considering structural response
- Effect of geofoam as cover material in cut and cover tunnels on the seismic response of ground surface
- Dynamic response of concrete face rockfill dam affected by polarity reversal of near-fault earthquake
- Analyzing uncertainties involved in estimating collapse risk with and without considering uncertainty probability distribution parameters
- Theoretical and experimental studies on critical time delay of multi-DOF real-time hybrid simulation