Driving factors of direct greenhouse gas emissions from China’s pig industry from 1976 to 2016
2021-12-14DAlXiaowenZhanliSUNDanielLLER
DAl Xiao-wen ,Zhanli SUN,Daniel MÜLLER,
1 Sichuan Center for Rural Development Research,Sichuan Agricultural University,Chengdu 611130,P.R.China
2 Leibniz Institute of Agricultural Development in Transition Economies (IAMO),Halle (Saale) 06120,Germany
3 Geography Department,Humboldt-Universität zu Berlin,Berlin 10099,Germany
4 Integrative Research Institute on Transformations of Human-Environment Systems (IRI THESys),Humboldt-Universität zu Berlin,Berlin 10099,Germany
Abstract Livestock cultivation is a significant source of greenhouse gas (GHG) emissions,accounting for 14.5% of the total anthropogenic emissions. China is responsible for a considerable share of the global livestock emissions,particularly caused by pork production. We used the Kaya identity and the logarithmic mean Divisia index (LMDI) to decompose the national annual GHG emissions from enteric fermentation and manure management in pig farming in China from 1976 to 2016. We decomposed the sources of the emissions into five driving factors:(1) technological progress (e.g.,feed improvement); (2)structural adjustment in the livestock sector; (3) structural adjustment in agriculture; (4) affluence; and (5) population growth.The results showed that the net GHG emissions from the pig sector in China increased 16 million tons (Mt) of carbon dioxide equivalents (CO2eq) during the study period. The decomposition analysis revealed that structural adjustment in agriculture,growing affluence,and population growth contributed to an increase of the GHG emissions of pork production by 23,41,and 13 Mt CO2eq,respectively. The technological progress and structural changes in animal husbandry mitigated emissions by -51 and -11 Mt CO2eq,respectively. Further technological progress in pig production and optimizing the economic structures are critical for further reducing GHG emissions in China’s pig industry. Our results highlight the dominant role of technological changes for emission reductions in the pig farming.
Keywords:livestock production,carbon emissions,manure management,pig farming,LMDI decomposition
1.lntroduction
Increasing greenhouse gas (GHG) emissions induced by human activities and their impacts on the global climate system pose a key challenge for humanity. One key contributor to global human-induced GHG emissions is livestock farming,which emitted approximately 8.1 gigatons (Gt) carbon dioxide equivalents (CO2eq) (FAO 2010),corresponding to 14.5% of global anthropogenic GHG emissions in 2013 (Gerberet al.2013). A large number of GHG emissions are generated directly and indirectly from the livestock sector,including emissions from enteric fermentation and manure management,energy consumption,and feed production (Fiala 2008; Petrovicet al.2015).
GHG emissions intensity (i.e.,emissions per unit of production) in pork production are substantially lower than for cattle. However,the total GHG emissions from pig farming are substantial because of the massive production quantity of pork. Pork is the most consumed meat in the world,accounting for 45% of total meat consumption(Philippe and Nicks 2015; Pork Chekoff 2018). Most existing studies,however,are about GHG emissions from ruminants,such as cattle and sheep; fewer studies focus on monogastric animals such as pigs (Tianet al.2014; Wuet al.2018). Until now,the driving forces behind the increasing GHG emissions from pig farming have remained vague and have rarely been quantified. This knowledge gap hinders the formulation of policies that aim at mitigating GHG emissions from the pig sector.
China is by far the largest producer and consumer of pork in the world. The GHG emissions from pork production in China have been increasing rapidly in the past few decades.However,studies on the driving forces of GHG emissions from the pig sector in China on the national level remain scarce. Existing studies either focus on the livestock sector as a whole or combined various meat industries,e.g.,the pig and poultry sector (Wanget al.2017). Other studies examine particular regions within China,usually the main pig producing provinces (Wanget al.2018),or focus on large pig farming facilities (Zhou Det al.2018). Studies on the GHG emissions from the pig sector in China at the national level are unfortunately still lacking. Besides,existing studies rarely consider macroeconomic factors that drive the changes in emissions,such as technological progress,structural changes in agriculture,changes in human affluence,and population growth despite that these macro-level factors play crucial roles in driving the variations in GHG emissions in the pig sector.
Here we examine GHG emissions and their driving force in China’s pig industry. Pork accounts for the largest part of Chinese meat consumption and has increased rapidly in the past few decades,as a result of shifts in the dietary structure towards more animal-based protein,i.e.,meat and dairy products. China’s animal farming number almost tripled from 1980 to 2018 (Baiet al.2018). In 2018,the per capita pork consumption in China was 40 kg (Zhang 2019).By the end of 2016,China had 442 million heads of pigs,slaughtered 701 million pigs,and produced 54Mt of pork meat (NBSC 2018),which corresponds to half of the world’s total pork production (OECD 2019). The large quantity of pork production transformed pig farming into a major source of GHG emissions in China’s agriculture (Wanget al.2018).Reducing emissions from the pig industry thus plays an important role in China’s endeavour to fulfil its commitment to reduce GHG emissions made under the 2015 Paris Agreement on climate change (Gallagheret al.2019).
There are two main kinds of direct GHG emissions associated with the production of pigs:methane (CH4),which arises from enteric fermentation in animal intestines,and nitrous oxide (N2O),which originates from manure management. The total GHG emissions in CO2equivalents from manure management and enteric fermentation in China’s pig sector are estimated at around 42 Mt,accounting for 33% of the GHG emission of global pig production in 2016 (FAO 2019). To find feasible and effective ways to reduce GHG emissions from livestock in China,it is critical to quantify GHG emissions from the pig sector in China as well as the driving factors of the emissions.
We quantify the driving factors of the changes in GHG emissions from enteric fermentation and manure management in China’s pig production between 1976 and 2016. We use decomposition analysis to assess the contribution to the GHG emissions from technological changes in the production process,structural change in both animal husbandry and agriculture,increasing affluence,and population growth. The specific research questions are as follows:1) How has the total GHG emissions from the pig sector varied over the past 40 years? 2) How much have the driving forces affected the changes in GHG emissions in the pig sector? Answering these questions will shed light on opportunities for reducing GHG emissions in pig production.
2.Data and methods
We exclusively focus on the direct emissions from the pig production process and ignore indirect emission sources,including energy consumption,such as pig house lighting or cooling,and feed production. Energy consumption can be substantial but,overall,constitutes a relatively small share of the total emissions from pork production (Zhou Y Qet al.2018). We also abstracted from the emissions embodied in traded fodder products and pork meat. The emissions from imported feed and fodder production can,however,be substantial. For example,industrial pig rearing mainly relies on proteins from soybean. China imports most of its soybean,and a substantial share of the imports originate from South America,where soybean production has been associated with substantial deforestation and thus GHG emissions (Müller 2020). Our estimated emissions are therefore conservative and with a focus on the emissions that emerge in the production process.
2.1.Data
We rely on statistical data to compile GHG emissions from the pig industry. The main variables consist of GHG emissions in CO2eq from the pig sector,gross production values of the entire agricultural sector and of the livestock sector,and population:
(1)GHG emission in CO2eq:The emission data are derived from the FAOSTAT database of the Food and Agriculture Organization of the United Nations (FAO 2019).The GHG emissions in CO2eq are calculated from the CH4and N2O emissions from the pig sector.
(2) Gross production value (GPV):The GPVs of the entire agricultural sector and of the livestock sector are expressed in local currency from 1961 to 2016 and also stem from FAOSTAT. This ensures data consistency,a uniform data source,and has the advantage that we can consistently use GPV data (Skousen 2013; Tubielloet al.2013).
(3) Population:The population data were fromChina Statistical Yearbook(NBSC 2017).
(4) Affluence and other relevant factors,such as CO2emissions per unit production and structure of the agricultural and livestock sectors,were calculated with the variables mentioned above. Per capita meat consumption in China has increased substantially in the last 40 years along with rising household income.
2.2.Decomposition models
Overview of the decomposition methodsWe used decomposition analysis to identify and quantify the contributions of the main driving factors (such as demographic and economic factors) of a particular impact(e.g.,energy,environmental impact and carbon emissions).An approach frequently used to analyse the driving forces of GHG emissions is IPAT identity (I,human impact on the environment; P,population; A,affluence; and T,technology)(Ehrlich and Holdren 1971,1972; Commoner 1972) as shown in eq.(1):

The IPAT identity explains the impacts (e.g.,GHG emissions) of the combined influences of population growth,economic growth,and technology upgrades (McNicoll 2001;Alcott 2010; Brizgaet al.2013). The IPAT identity has also been applied to analyse CO2emissions in China (e.g.,Auffhammer and Carson 2008; Fenget al. 2009; Gaoet al.2010; Songet al.2011; Yueet al.2013).
Another frequently used approach related to the GHG emission issue is the Kaya identity,which refines the three driving forces in the IPAT identity to gross domestic production (GDP),energy intensity defined as energy consumption per unit GDP (E/GDP),and CO2emissions intensity defined as CO2emission per unit energy consumption (CO2/E),as shown in eq.(2).

Energy intensity represents the general technology upgrades,and CO2emission intensity reflects the impact of technological improvement on CO2emissions. The Kaya identity was first introduced in a report of the IPCC in 1989 by Kaya (1989),andthe identity was expanded by replacing GDP with two factors,GDP per capita and population (Kaya 1995; Kaya and Yokobori 1997),as shown in eq.(3):

whereGDP/Pis the GDP per capita,a proxy for the living standard or affluence,which reflects the impact of economic growth on CO2emissions; andPis the population,which typically has a positive impact on CO2emissions.
Due to the mathematical properties (i.e.,perfect decomposition,consistency in aggregation,and ability to handle zero values) and the decomposition flexibility,the Kaya identity has been widely used,e.g.,in energy consumption and greenhouse gas emission researches(Ang and Zhang 2000; Zhaoet al.2010). Eq.(3) shows the most common way to decompose the GHG emission.Some researchers have decomposed the GHG emissions into emission intensity represented by GHG emission per unit GDP,structure represented by GDP proportion of the specific industry,and economic scale represented by GDP value.
Overview of the decomposition methodsTo address our research questions,we adapted the Kaya identity into eq.(4):

whereCO2pigon the left side of the equation is the total GHG emissions in CO2eq from the pig sector.T=CO2/GDPpigrepresents the CO2eqper unit GDP of the pig sector,which is a proxy for technology level in pig production.GDPLsrepresents the GDP created by the animal husbandry sector,andS1represents the portion of pig sector GDP in the total GDP from animal husbandry. This value can be understood as the economic structure in the animal husbandry sector.GDPAgriis the GDP from agriculture,forestry,animal husbandry,and fisheries;S2hence captures the portion of the GDP from animal husbandry in total agricultural GDP.This value can be understood as the economic structure in the agricultural sector.
The structural changes variables,indicated byS1,andS2,reflect,to some degree,policy interventions. Industrial sector factors (e.g.,market instability,economics of size,supply-demand balance and price cost margin),institutional factors (such as structural regulation,taxation,credit,input subsidies),or macro-economic factors (such as inflation,interest rates change) are all greatly influenced by policy interventions. For example,during the outbreak of African Swine Fever,the Chinese government increased subsidies to boost pig production; at the same time,poultry consumption and production increased as consumers seeking alternative animal proteins. The change of the number of the pigs and the corresponding GDP values resulted in the change of the structure of the livestock sector,bothS1andS2. By including the two structural variables,we can thus catch the effects of the economic structural change. The two-macro-structural factors setting is also in line with previous studies (Wood 2009; Kofiet al.2012; Zanget al.2020).
L=GDPAgri/Prepresents the living standards of people,which has implications for GHGemissions because people typically adapt their consumption behaviour to changes in living standards and income. With rising income,people tend to increase animal-based protein intake,which in turn affects pork demand and supply,and thus the GHG emissions from pork production. When people can afford more nutritional options,measuring the impact of rising affluence on CO2emissions can be more complicated.
As we used the GPV from the FAOSTAT dataset to substitute the GDP dataset,we rewrote eq.(4) to create eq.(5):

We use the basic properties of mathematical laws to balance the equation without any residuals,which is a basic feature of the Kaya identity.T,S1,S2,L,andPin the modified identityare the most important drivers for the changes in the GHG emissions of the pig sector in China in the last four decades. Another notable thing is that in our earlier version of the identity,there were only four elements:T,S,L,andP. There is only one structural change variable,S=GPVpig/GPVAgri. But we found that the structural changeSalways had a positive effect,which is not reasonable. The animal husbandry sector was a main GHG emission source in the agricultural sector,and the expansion of livestock production will lead to an increase in GHG emissions from the livestock sector. However,we still do not know how much GHG emissions were caused by the pig industry. To disentangle the GHG emission contribution of the pig sector,we further decomposed the structural variable intoS1andS2to analyse the impacts of the structural change in animal husbandry and the structural change in agricultural sector on the change in the GHG emissions.
We also used the logarithmic mean Divisia index (LMDI)decomposition to decompose the contribution of the individual drivers. The LMDI was developed by Ang (1996)and further improved in later studies (Ang and Choi 1997;Ang 2005). One of the advantages of this method is its simplicity:the analysis only requires the total value of the target variable. This is important because the input-output data are often unavailable or difficult to obtain. Additionally,the LDMI method can decompose the targeted item without residuals. Thanks to its simplicity and low data requirement,it has been widely used in analysing the drivers of GHG emission issues. There are multiplicative forms and additive forms of LMDI decomposition. In our case,they are written as eqs.(6) and (7),respectively,and can be transformed into each other (Ang 2005).
Multiplicative decomposition is as follows:

Additive decomposition is as follows:

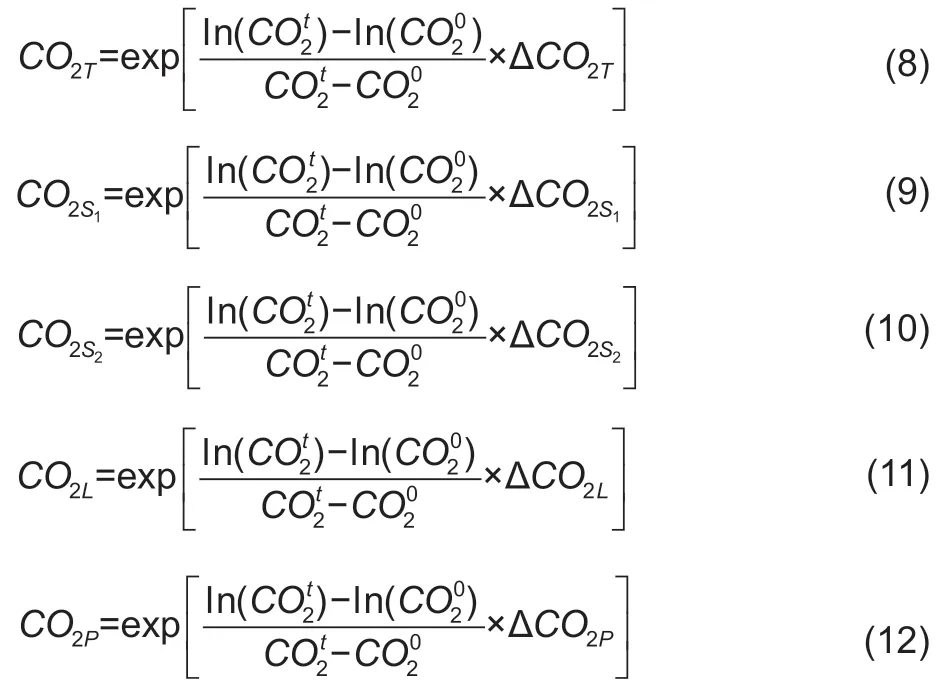
whereCO2pigis the total quantity of the CO2eq from the pig sector to be decomposed,as also shown in eq.(5).CO2T,,CO2L,andCO2P,represent the CO2eq from the pig sector caused by technology upgrades,structural change in animal husbandry,structural changes in agriculture,affluence improvements,and population growth,respectively.ΔCO2T,,ΔCO2L,and ΔCO2Prepresent the net contribution of CO2eq from technology upgrades,structural changes in animal husbandry,structural changes in agriculture,affluence improvements,and population growth,respectively.
According to the LMDI decomposition formulas,we can rewrite our formula as follows,and there are multiplicative forms and additive forms:
Multiplicative LMDI:
Additive LMDI:

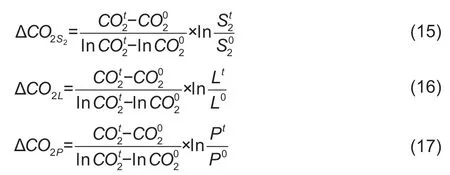
T,S1,S2,L,andPin eqs.(13)-(17) have the same meanings as those in eq.(4). Superscript 0 andtrepresent the beginning and end of the study period,respectively.We used eqs.(6)-(17) and the data described above for our analysis.
3.Results
We first calculated the changes in GHG emissions from the pig sector and the variations in the five key variables of driving forces from 1976 to 2016 (Fig.1).
Fig.1-A shows that GHG emissions from the pig sector,due to enteric fermentation and manure management,have been increasing steadily over the past four decades. The total emissions increased by more than 60% from 1976 to 2016. Noticeably,the increasing trend of total GHG emissions has slowed down in recent years,especially since the year 2000. From the remaining five subfigures,we find that both technological change (T) and structural changes in animal husbandry (S1) have declining trends,dropping by 78 and 27%,respectively. Meanwhile,structural changes in agriculture (S2),affluence improvements (L),and population growth (P) were rising,with increases of 100,240,and 47%,respectively.
The emission intensity measured by GHG emissions per unit of GPV from the pig sector has decreased by 78%from 1976 to 2016 (Fig.1-B). This reflects the process of technological advancement in pig production,e.g.,feed improvement and effective manure management optimization. Although the GPV of the pig sector (GPVpig)and GHG emissions from the pig sector (CO2P) both increased,the rates of increase differed:the rate of increase ofGPVpigwas higher than that ofCO2pig. Especially after 1996,GPVpigrose substantially faster thanCO2pig(Fig.1-B).In other words,the pig sector now generates the same value added with less GHG emissions due to technological progress.
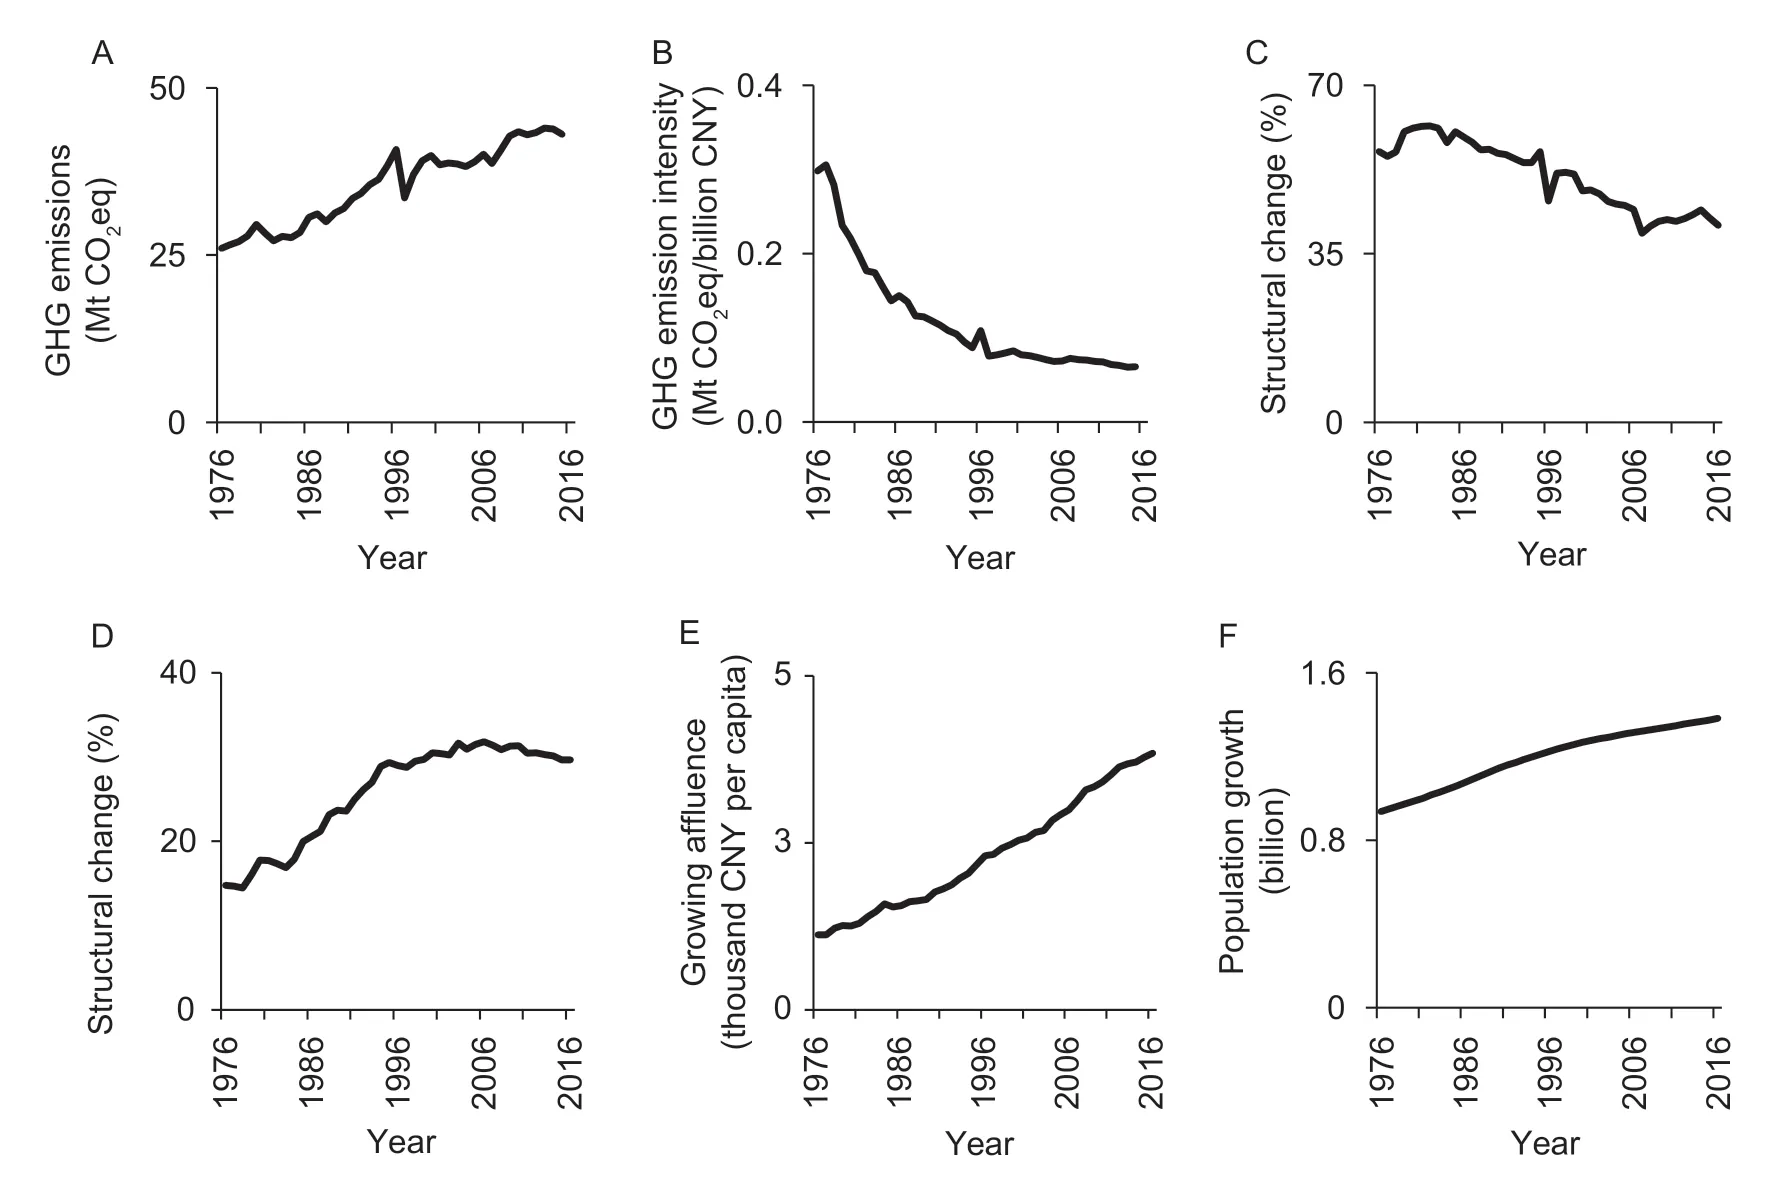
Fig.1 Changes in greenhouse gas (GHG) emissions from the pig sector and the variations in the five key variables of driving forces from 1976 to 2016. A,GHG emissions from the pig sector. B,technological change (emission intensity):GHG emissions per unit of value-added in pig sector. C,structural changes in animal husbandry:the changes of percentage of gross production value (GPV) of the pig industry as a share of total animal husbandry. D,structural change in agriculture:the changes in percentage of GPV of animal husbandry as a share of total GPV of the agricultural sector. E,growing affluence:changes in agricultural GPV per capita. F,population growth from 1976 to 2016. Data source:NBSC (2017).
The two variables reflecting the economic structure have experienced a substantial change (Fig.1-C and D).Measured by GPV percentages,the proportion of the pig farming industry in animal husbandry has declined by 27%,while animal husbandry doubled its proportion in agriculture over the study period.
China’s effective economic reforms have driven the rapid increase in the affluence of Chinese residents since the Reform and Opening-up Policy enacted in 1979. The living standard,measured byGPVagriper capita in this study,has increased more than three-fold (Fig.1-E). Improved living standards directly affect consumption patterns. As a result,the meat consumption per capita in China increased substantially in the past decades (Yu 2018).
Population has been increasing steadily but the population growth rate has been decreasing since 1986,mainly due to the “one-child policy”,which was implemented in the late 1970s (Fig.1-F).
According to eqs.(13)-(17),we used the additive decomposition of the GHG emissions from the pig sector for the five major drivers (Fig.2).
Between 1976 to 2016,the net change in GHG emissions from the pig sector in China was 15.71 Mt CO2eq (Fig.2).Structural change in agriculture,rising affluence,and population growth contributed to an increase of GHG emissions by 77 Mt CO2eq. Technological change and structural change in the livestock sector dampened the GHG emissions by 61 Mt CO2eq.
Technological change plays a negative role in GHG emissions in the pig industry. Technological advancements have reduced GHG emissions by 51 Mt CO2eq. The two economic factors have opposite effects on GHG emissions:the change of the animal husbandry structure,measured by the proportion of GPV of the pig industry in the whole animal husbandry sector,contributed negatively to the total GHG emissions from the pig industry by -11 Mt CO2eq; and the effect of agricultural structural changes,measured by the proportion of GPV of the animal husbandry sector in the whole agricultural sector,positively drove the total GHG emissions by 23 Mt CO2eq. Both affluence improvements and population growth had positive effects on GHG emissions from the pig industry,with a net contribution of 41 and 13 Mt CO2eq,respectively.
According to eqs.(8)-(12),we also decomposed the contributions of the five driving factors to GHG emissions from the pig sector from 1976 to 2016 in multiplicative mode(Fig.3).
The GHG emissions from China’s pig sector have increased more than 160% over the study period.Technological change and changes in the structure of animal had mitigated GHG emissions by 22 and 73%,respectively(Fig.3). Structural changes in the agricultural sector,rising affluence,and population growth positively affecting GHG emissions by 201,342,and 148%,respectively. These effects are consistent with the additive decomposition result shown in Fig.2.
Additionally,we performed a decomposition analysis on the effect of the five driving factors on an annual basis using eqs.(8)-(17) (Fig.4). The results suggest that technological change (Fig.4-A) and structural change in animal husbandry(Fig.4-B) contributed negatively to GHGemissions from the pig sector in most years; structural change in agricultural(Fig.4-C),rising affluence (Fig.4-D),and population growth(Fig.4-E) causing higher GHG emissions from the pig sector in most years.
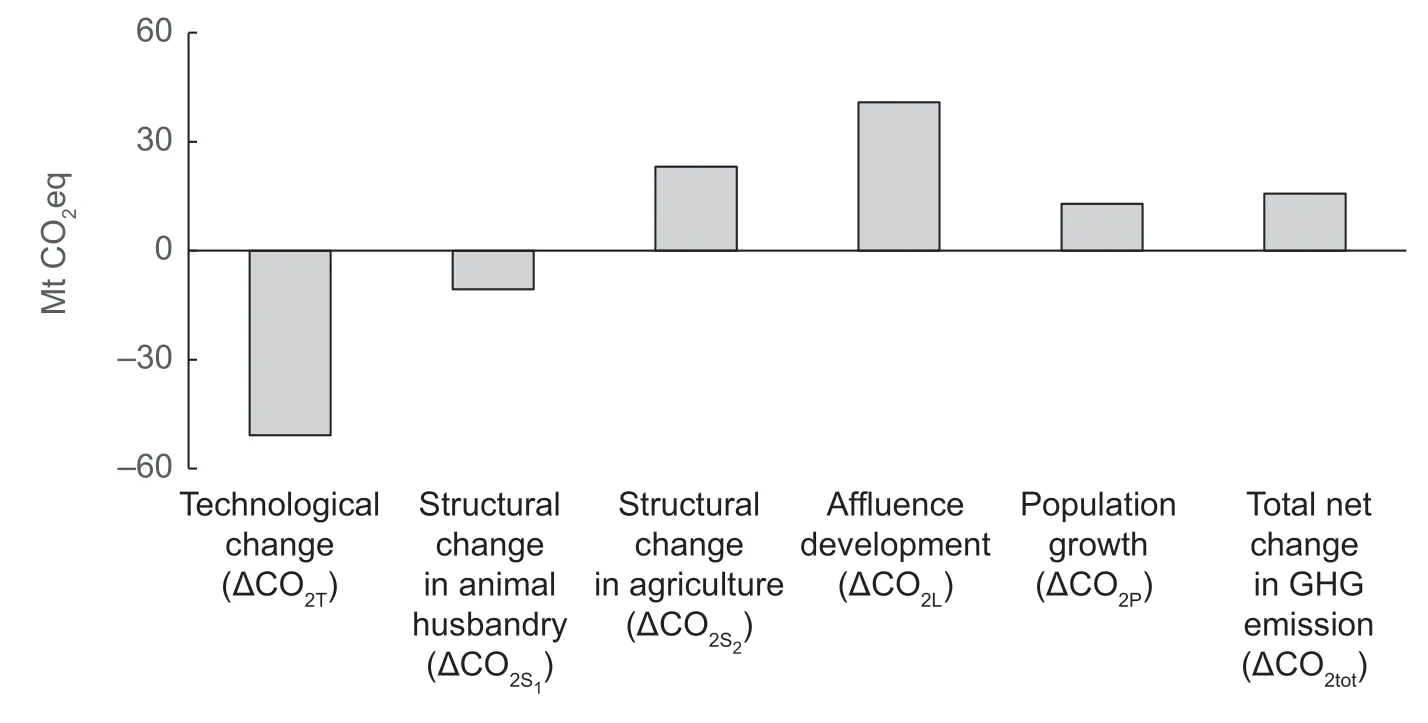
Fig.2 Decomposition of the greenhouse gas (GHG) emissions from pig sector in additive mode from 1976 to 2016. Data source:authors’ calculations.
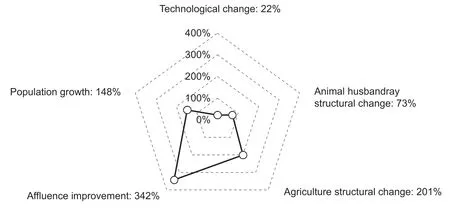
Fig.3 Contributions of five driving factors to greenhouse gas (GHG) emissions from the pig sector in China from 1976 to 2016.Data source:authors’ calculations.
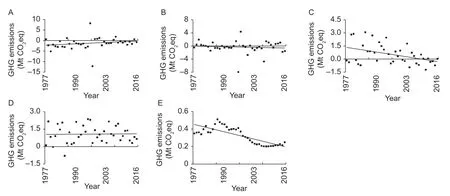
Fig.4 Annual change in the effects of the selected driving factors on the trend in changes of greenhouse gas (GHG) emissions form pork production in Mt from 1976 to 2016. A,technological change. B,animal husbandry structural change. C,agriculture structural change. D,affluence improvement. E,population growth. The scales of the y-axis differ between the panels to better visualize the temporal development of the driving factors. Data source:authors’ calculations.
The effect of technological change on GHG emissions declined over the study period (Fig.4-A),possibly because of diminishing marginal utility:technological progress can cause the GHG emissions from the pig sector to decline sharply at an early stage when the mitigation potential is still large but the emission reduction from subsequent technology upgrades tend to be diminishing. The effects of animal husbandry structural change on GHG emissions are overall negative but fluctuate over time:in some years it had positive effects,and in some years it had negative effects(Fig.4-B). Overall,the negative effect tends to increase over the study period. The GHG emissions were positively affected by agriculture structural changes (Fig.4-C),rising affluence (Fig.4-D),and population growth (Fig.4-E),while the effects of rising affluence and population growth appeared to be constantly positive over the study period.The trend of the rising affluence effect on GHG emissions from the pig sector remains flat,and the effect of population growth on GHG emissions from the pig sector had a strong downward trend in the last 40 years. The effect of structural changes in agriculture was decreasing. The affluence contributed the most to the positive GHG emissions among the three effects,and the population growth effect was the smallest.
4.Discussion
We analysed the main driving force of GHG emissions from pig enteric fermentation and manure management during pig production in China from 1976 to 2016. We explained the variations in GHG emissions by attributing the changes to five drivers,namely,technology,the added value of the husbandry sector,agro-structural changes,affluence,and population.
The improvement of affluence has been the most powerful driver for the rising GHG emissions from the pig sector over the past four decades. As income increased,people’s dietary structure shifted towards more consumption of meat protein (Shepherdet al.1996; Wanget al.2008).Because pork is traditionally the main source of meat in China,the number of pigs has grown by more than five folds over the past four decades,with concurrent increases in GHG emissions.
The technological advancements in our research represent various technological progresses,such as the construction of pig house energy-saving facilities,animal disease prevention and control,manure management technology,and breeding technology. This is unique compared to previous studies on the technological impact on GHG emissions from the pig sector,which mainly consider one particular factor (Vanottiet al.2008; Kaparaju and Rintala 2011; Philippeet al.2012; Dennehyet al.2017;Liet al.2017) or broader livestock GHG emission issues(Lesschenet al.2011; Sommeret al.2013). Most of those studies emphasized the aspect of manure management,such as storage techniques and additive technology,but failed to consider all aspects of technology.
Our results show that the improvement of technology in pig farming was critical for reducing GHG emissions in Chinese pork production. These findings are in line with previous studies that showed the adoption of new technologies can effectively reduce GHG emissions from the livestock sector (Kaparaju and Rintala 2011; Dennehyet al.2017).
We also analysed the effects of two types of structural changes on China’s GHG emissions from the pig sector:The structural changes in agriculture showed a positive effect,while structural changes in the livestock sector showed a negative effect. Although some studies have considered the overall economic structural changes in the mitigation of GHG emissions,none of these studies assessed the livestock or pig sectors. Most of the structure-and GHG emissionrelated studies have been conducted at the macroeconomic level. Although it has been proven that GHG emissions can be effectively mitigated by shifting the structure of the economy in the long run (Minihan and Wu 2012),no other detailed studies have investigated the mesoscale,as we did in this research. The research on the influence of structural change should be further studied in the future because it can guide the adjustment of national agricultural production structure to ensure the supply of agricultural products in the market and simultaneously meet the goal of reducing GHG emissions in agriculture.
Population growth is another important reason for the increase in GHG emissions in China’s pig sector. The population growth is expected to remain at low rate in the future despite that the “one-child policy” has been gradually phased out since 2013; the effects on the birth rate have been minimal. The fertility rate remains low because most urban residents are reluctant to have two or more children,even if they are allowed to,partially due to the increasing costs of parenting,education,and living. Thus,the decrease in population growth rates will contribute to lower demand for pork meat and thus contribute to lower GHG emissions from the pig sector in the long run.
To the best of our knowledge,few studies have used the decomposition method to analyse the driving forces of GHG emissions in the pig sector. Many decomposition studies focused on the driving factors of GHG emissions at a macroscale,usually a provincial level (Zhaoet al.2010),country level (Cansinoet al.2015; Mousaviet al.2017),or continental level (Gonzálezet al.2014). Additionally,previous studies focused mainly on specific industries,such as the logistics industry (Dai and Gao 2016),chemical industry (Lin and Long 2016),and manufacturing industry(Jeong and Kim 2013). We applied the LMDI decomposition method to GHG emissions in the pig sector and advanced the research to a mesoscale level (i.e.,agriculturehusbandry-pig sector).
One of the shortcomings of this research is that we only considered the direct GHG emissions from pig production.Indirect GHG emissions from pig fodder production,such as from energy usage in industrial pig production including the slaughtering process,were not included. Besides,the emissions embodied in fodder production,fodder imports,and imports of pork meat constitute a substantial component of the total lifecycle emissions in pig production. The fodder for pigs mainly stems from soybean,which provides the proteins,and from maize,which provides the energy.However,detailed data on the composition of the crops in pig fodder remain scarce,regardless of whether the fodder products are imported or domestically planted. Our estimations on the GHG emissions from the pig sector are hence underestimated.
Another challenge is that even if we know the quantity and origin of soybean and maize imported for pig fodder manufacturing,we still cannot determine the specific GHG emission equivalents generated by soybean and maize planting due to the technical heterogeneity found among different countries. An attention-attracting but the difficultto-solve problem is the specification of the embodied GHG emissions from the production process of pork and pork-related goods,which are related to transportation,warehousing,and retail circulation. Therefore,we did not add the GHG emission equivalents from pork and porkrelated production and its consumption into this research and more comprehensive research including the GHG emissions from production,consumption,and pig fodder will be conducted in the future.
The GHG emissions from pork production in China will likely rise further but at a much slower pace. China intends to transform its economy towards lower emission intensity and lower overall emissions,including from agricultural production (Pan 2016). Also,the GHG emissions from pork production will likely be reduced with new technological innovations and stricter environmental laws. The pork production in China will recover from the African Swine Fever in the near future but only grow marginally. According to recent forecasts,the pig production will increase marginally in the coming decade from 54 Mt in 2018 to 57 Mt in 2029 (OECD-FAO 2020). The Chinese government also advocates more sustainable food consumption patterns(e.g.,less meat consumption) and diversified protein sources,which may contribute to lower future demand for pork meat. Besides,China’s pig industry will continue the structural transition,from the traditional backyard production model to the large-scale production mode (Qiaoet al.2016),which will substantially reduce the carbon footprint of pig production (Baiet al.2014; Panet al.2019).
5.Conclusion
We attributed the GHG emissions from the pig sector in China to five driving factors with the Kaya identity and the LMDI method and using statistical data from 1976 to 2016.Results show that technological change and the structural change in animal husbandry had negative or mitigating effects on GHG emissions over the past forty years.Technological advancement in particular has mitigated GHG emissions substantially. Meanwhile,the structural changes in agriculture,rising affluence,and population growth contributed to higher GHG emissions in the pig sector,with rising affluence having the largest effect.
The results provide important insights that can inform policy on how to to mitigate the GHG emissions from the pig sector in China. This is timely because the Chinese government has committed to the transformation of agriculture towards lower emissions and green agricultural development. To achieve these aims,the government should continue fostering investment in technological innovations and the adoption of new technologies in livestock production to further decrease GHG emission intensity.Second,the structure of agriculture and the structure of the animal husbandry sector should be optimized based on the dietary changes in China. Finally,consumers need further information and education about low-carbon lifestyle and possibly emission taxes that internalize emissions costs into the product prices.
Acknowledgements
This research is financially supported by the National Social Science Fund of China (16CJL035) and the China Scholarship Council Program for Visiting Scholars.
杂志排行
Journal of Integrative Agriculture的其它文章
- The dynamic impact of income and income distribution on food consumption among adults in rural China
- ATP regulates the phosphorylation and degradation of myofibrillar proteins in ground ovine muscle
- Use of two-stage dough mixing process in improving water distribution of dough and qualities of bread made from wheatpotato flour
- lmpact of climate change on maize yield in China from 1979 to 2016
- Estimating daily actual evapotranspiration of a rice-wheat rotation system in typical farmland in the Huai River Basin using a two-step model and two one-step models
- Optimization of water and nitrogen management for surge-root irrigated apple trees in the Loess Plateau of China
