Optimization of water and nitrogen management for surge-root irrigated apple trees in the Loess Plateau of China
2021-12-14DAIZhiguangFEILiangjunZENGJianHUANGDeliangLIUTeng
DAI Zhi-guang ,FEI Liang-junZENG JianHUANG De-liangLIU Teng
1 Institute of Water Resources Research,Xi’an University of Technology,Xi’an 710048,P.R.China
2 School of Hydraulic and Ecological Engineering,Nanchang Institute of Technology,Nanchang 330099,P.R.China
Abstract The Loess Plateau is one of the main regions for growing apple trees in China,but a shortage of water resources and low utilization of nitrogen have restricted its agricultural development. A 2-year field experiment was conducted which included three levels of soil water content (SWC),90-75%,75-60%,and 60-45% of field capacity,and five levels of nitrogen application (Napp),0.7,0.6,0.5,0.4 and 0.3 kg/plant. The treatments were arranged in a strip-plot design with complete randomized blocks with three replications. For both years,the water and Napp had significant (P<0.05) effects on leaf area index (LAI),yield,water use efficiency (WUE) and nitrogen partial factor productivity (NPFP) while the interaction effect of water and Napp on yield,WUE and NPFP was significant (P<0.05) in 2018,and not in 2017. For the same SWC level,WUE first increased,then decreased as Napp increased,while NPFP tended to decrease,but the trend of LAI with different Napp was closely related to SWC. At the same Napp,the LAI increased as SWC increased,while the WUE and NPFP first increased,then decreased,but the yield showed different trends as the SWC increased. The dualistic and quadric regression equations of water and Napp indicate that the yield,WUE and NPFP cannot reach the maximum at the same time. Considering the coupling effects of water and Napp on yield,WUE and NPFP in 2017 and 2018,the SWC level shall be controlled in 75-60% of field capacity and the Napp is 0.45 kg/plant,which can be as the suitable strategy of water and Napp management for the maximum comprehensive benefits of yield,WUE and NPFP for apple trees in the Loess Plateau and other regions with similar environments.
Keywords:surge-root irrigation,yield,water use efficiency,nitrogen partial factor productivity
1.Introduction
Apple is one of the most consumed fruits worldwide and its popularity is gradually increasing,together with its use in nutrition,food,and drug industries (Giarettaaet al.2019).The Loess Plateau,covering arid and semi-arid regions of China,is one of the most important planting areas for apple trees (MaluspumilaMill),and apple orchards covered over 628 600 ha in 2016 (SPBS 2016). However,because of the lack of understanding of proper water and N management,farmers often applied excessive water and nitrogen (N),which is not only hampers increasing yield,but also causes a series of problems such as groundwater pollution (Huanget al.2018; Zhanget al.2019). Therefore,optimal water and N management is essential for the sustainable development of agriculture in this region.
Water is the most limiting factor for crop productivity,particularly in arid or semi-arid regions in which irrigation is the only way to ensure yield (Jiaet al.2018). To meet the increasing scarcity of water resources,many water-saving technologies have been introduced such as surge-root irrigation (Daiet al.2019a; Zhonget al.2019),sprinkler irrigation (Nasseri 2018; Alghory and Yazar 2019),drip irrigation (Liuet al.2018; Panigrahi and Srivastava 2019),and pit irrigation (Li and Zhang 2017). Among the water-saving technologies,surge-root irrigation (SRI) is a technology of micro-irrigation similar to subsurface drip irrigation (SDI) that can localize water and fertilizer through the emitter directly to the crop root and has the advantages of low evaporation,long service life,and low labor costs(Daiet al.2019a). Moreover,SRI is a three-dimensional columnar outflow,which has stronger anti-blocking ability and can shorten the irrigation time compared with SDI. In addition to crop yield,water and fertilizer use efficiencies can also be significantly improved (Daiet al.2019a). The emitter adopted by SRI has a larger flow,better hydraulic performance,and higher anti-blocking ability; therefore,it is particularly suitable for the irrigation of orchards (Daiet al.2019b). However,it remains debatable if this technology could achieve the dual goal of increasing yield and saving water for apple trees.
Besides water,N is another key factor that strongly influences the growth and yield of apple trees. Specifically,N plays a very important role in the synthesis of proteins,enzymes and chlorophyll (Massoudifaret al.2014; Tianet al.2019). In the Loess Plateau,the main type of soil is sandy loam soil,which has high hydraulic conductivity(Tanget al.2019; Xiaoet al.2019),and its permeable properties make the region susceptible to groundwater contamination by nitrate leaching (Liet al.2018). Under conventional cultivation practices,excess nitrate was detected in groundwater and its concentration exceeded 60 mg L-1,while the national standards state that the concentrations should be less than 20 mg L-1in drinking water,and N in excess of crop demand was found to be responsible for groundwater contamination by high nitrate leaching (Suet al.2017; Dinget al.2019). The irrational input of N not only increases the cost,but also has an adverse effect on the environment. Therefore,it is very important to optimize N management,which can reduce production costs and contribute to environmental protection while maintaining crop yield (Farneselliet al.2018; Sunet al.2018). In addition,combined management of water and N were found to be effective at promoting crop yield,and the use efficiencies of water and N (Kuşçuet al.2016; Ul-Allahet al.2018),but the effects of different water management strategies combined with different N on yield,water use efficiency (WUE) and nitrogen partial factor productivity(NPFP) of apple trees under SRI have remained elusive.
Furthermore,it is often difficult to balance the multiobjectives of high yield,WUE and NPFP through a single treatment,and studies investigating the multi-objective optimization of water and N management based on the yield,WUE and NPFP remain scarce. Thus,this study was conducted with the following objectives:(I) To quantify and to describe the response of yield,WUE and NPFP to water and Napp; (II) to establish the quantitative relation of yield,WUE and NPFP,and water and Nappinputs; (III) to determine the optimal level of water and Nappto yield,WUE and NPFP based on the comprehensive benefits for apple trees,which can achieve the purpose of high yield and water and Nappsaving under SRI in the Loess Plateau and other regions with similar environments.
2.Materials and methods
2.1.Experimental site
Field experiments were conducted during the apple tree growing seasons in 2017 and 2018 at the Modern Agriculture Apple Demonstration Orchard with micro-irrigation located in Qingshuigou Village,Yulin City,Shaanxi Province,China (37°27´N,110°2´E,altitude:1 020 m). This area is a typical hilly-gully region of the Loess Plateau that has a semi-arid climate. Based on 30 years of meteorological data (1986-2015) collected in Yulin,the average annual rainfall in the area is only 427.5 mm,most of which occurs from July to September,the average annual temperature is 9.2°C,the average annual sunshine is 2 632.9 h,the frost-free period is about 170 days. The soil type is sandy loam,the soil layer is deep,and the fertility is poor. The basic physical and chemical properties of the soil in 0-100 cm are shown in Table 1.
2.2.Experimental design
In this experiment,the variety of apple tree was dwarf Hanfu,andMalusmicromaluswas used as a rootstock. The tree was planted in 2012 with a planting density of 1 665 plants ha-1,and the height was 2.5-3.0 m. The phenological period of the apple tree was divided into four parts:budding leaf stage,flowering to fruit set stage,fruit expansion stage and fruit maturation stage. In general,the budding leaf stage was from early April to mid-May,the flowering to fruit set stage was from late May to early June,the fruit expansion stage is from mid-June to early September,and the fruit maturation stage was from mid-September to late September.
Before the start of the experiment,10 apple trees were randomly selected in the experimental area,and the root distribution was studied within 200 cm by the root-drilling method. The results showed that more than 90% of the tree absorbent roots (<2 mm in diameter) were distributed within the depth of 80 cm; therefore,the depth to which soil water content (SWC) was controlled in this experiment was 80 cm.
Apple trees are moderately drought-tolerant,with a suitable SWC of 90-45% of field capacity (mass water content) (Zhang Ket al.2010),and local farmers often use a rate of urea of 0.5 kg/plant in apple orchards. Therefore,the experimental treatments employed in this study were a combination of three water levels and five levels of Napp.Three levels of water were applied based on SWC,90-75%(W1),75-60% (W2),and 60-45% (W3) of field capacity,which represent the states of soil moisture in mild,moderate and severe deficits,respectively. The five Napplevels were 0.7 kg/plant (N0.7),0.6 kg/plant (N0.6),0.5 kg/plant (N0.5),0.4 kg/plant (N0.4) and 0.3 kg/plant (N0.3),for a total of 15 treatments. Each treatment contained three apple trees arranged in a strip-plot design according to complete randomized blocks with three replications. We selected 135 healthy,vigorous and uniformly sized apple trees,with one untreated tree positioned between treatments. In the fruit ripening stage,the apple trees’ demand for water is weak because of rapid temperature reduction,and the rainfall in the experimental area is large; therefore,the apple trees were not irrigated in this stage. The SWC and Nappfor each growth stage of the apple trees are shown in Table 2.
Each apple tree had two emitters 30 cm from the trunk buried at a depth of 45 cm and positioned east and west of the tree (Fig.1). A flow rate of 5.0 L h-1was maintained for each emitter,and the wetting ratio was 0.3 (volume ratio).The irrigation water was obtained from a water cellar that had a suitable water quality for irrigation. A water meter(nominal diameter:25 mm) was used to control the irrigation amount for each treatment,and a Venturi fertilizer injector was used to apply fertilizer. Based on Songet al.(2016),1.0 kg/plant organic fertilizer (sheep manure) was applied in the planting hole as the base fertilizer at 30 cm from the trunk of the apple tree,and 0.6 kg/plant of monopotassiumphosphate,0.5 kg/plant of potassium sulfate and 67% of the Nappfor the corresponding treatment were applied along with irrigation water by SRI in early April,while 0.3 kg/plant of potassium sulfate and 33% of Nappwere applied at the beginning of the fruit expansion stage. To eliminate the interactions among treatments,a plastic film was buried at a depth of 80 cm between treatments before the start of the experiment. In addition to the different SWC and Napp,other measures such as trimming,insecticide spraying,and weed control were the same for all treatments.

Table 1 Distribution of physical and chemical properties in 0-100 cm (Sampling date:2017-3-15)
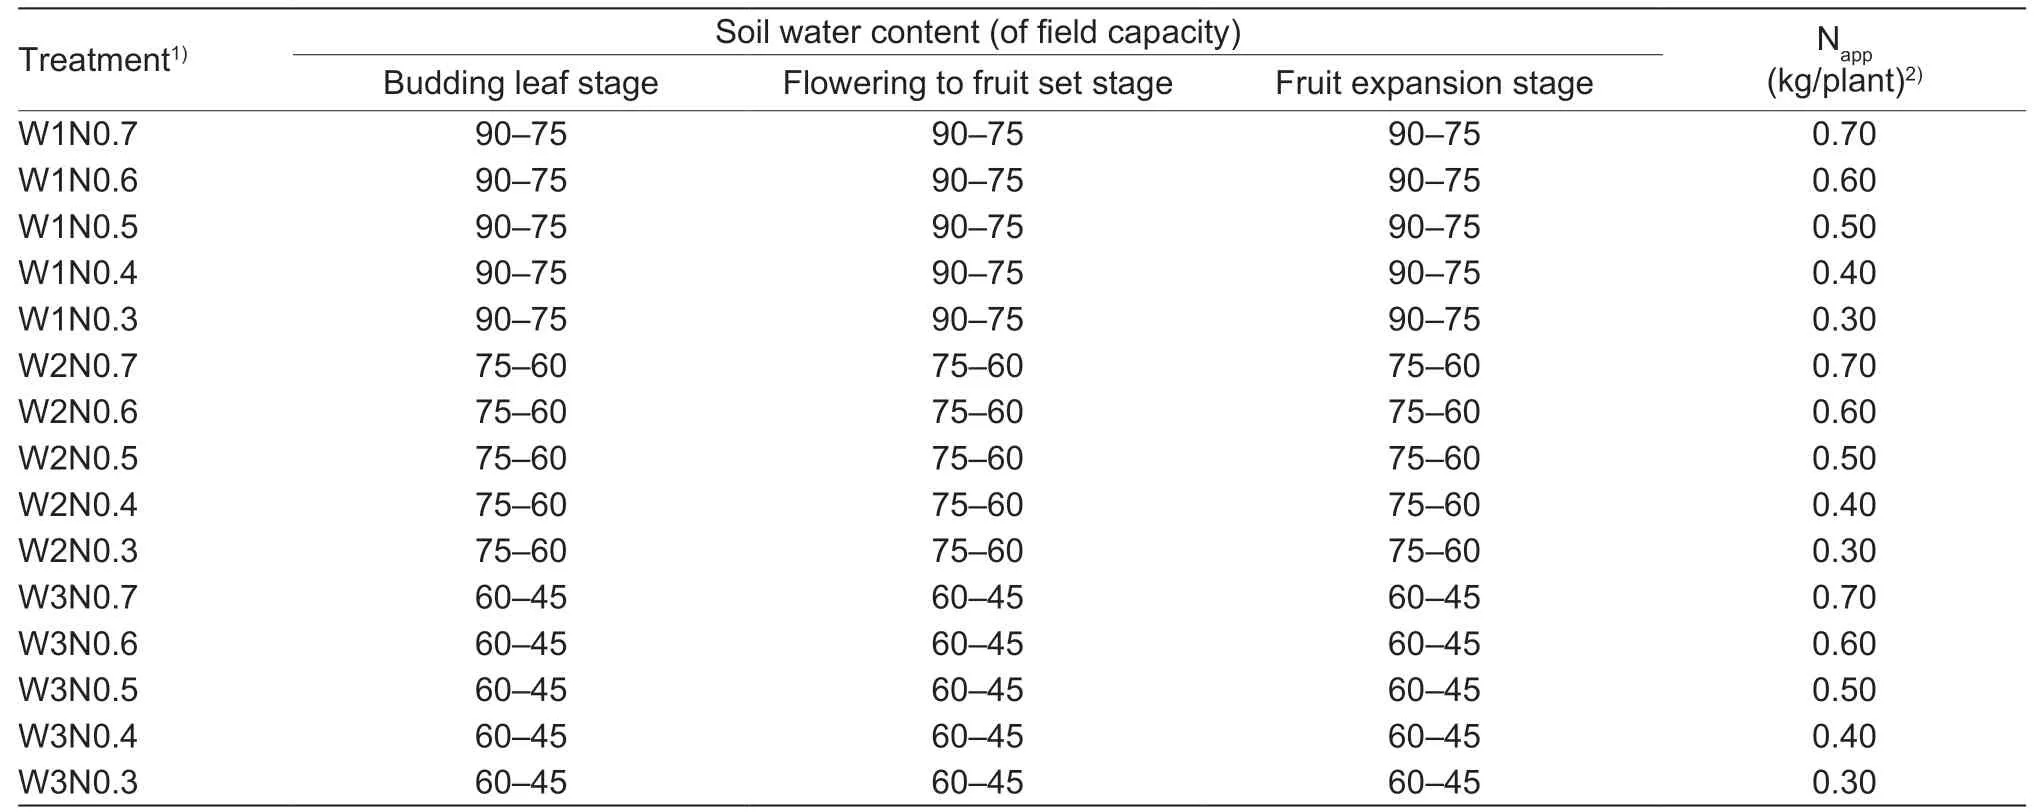
Table 2 Soil moisture content and nitrogen application of apple trees at different growth stages
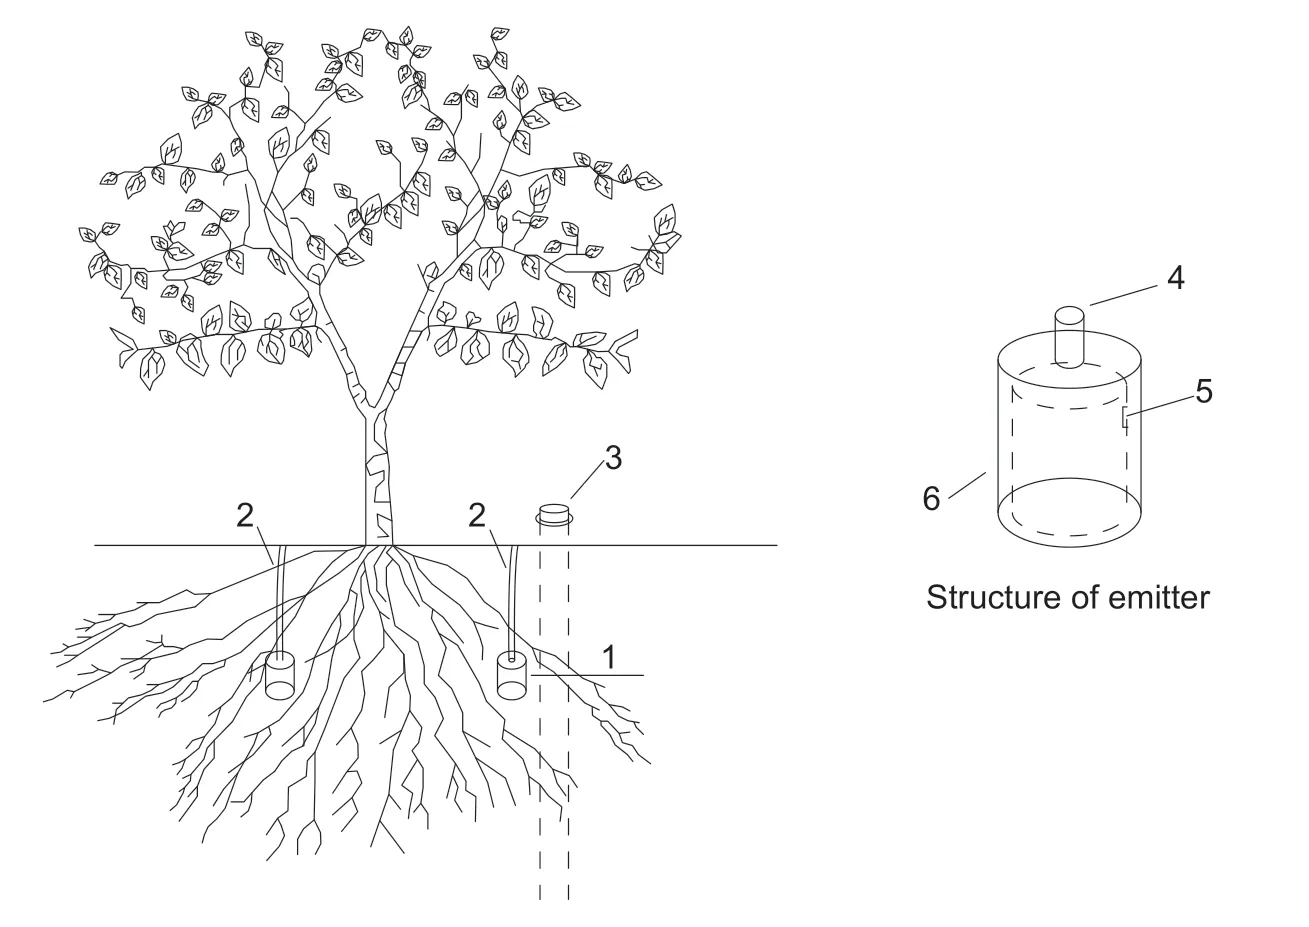
Fig.1 The layout and structure of emitter. 1,emitter; 2,microtube; 3,trime tube; 4,water intake; 5,water outlet; 6,labyrinth channel.
2.3.Measurements and calculations
Air temperature,relative humidity,atmospheric pressure,solar radiation intensity,wind speed,wind direction and precipitation were monitored by an automatic weather station (Vantage Pro 2). Parameters were measured every 1 min and recorded every 30 min. The LAI was measured at 10-day intervals from the middle of bud burst to the full-leaf stage to the end of the fruit expansion stage using a plant canopy analyzer. SWC was measured every 20 cm in the depth of 0-80 cm with TRIME-T3 tubular TDR (IMKO Ltd.,Germany) from the budding leaf stage to the fruit expansion stage and converted it to the mass water content. The yield of apple trees from each treatment was weighed immediately after harvesting. The harvest dates were October 24,2017 and September 17,2018.
Evapotranspiration (ET,mm) was calculated as follows(Duet al.2017):

wherePr,U,I,D,RandΔWare effective rainfall,recharge of underground water,irrigation,deep percolation,runoff and the difference in SWC between the beginning and the end of the experiment (mm),respectively. The underground water at the experimental location was over 50 m and no runoff was generated during the growing season,soUandRwere neglected. Eq.(1) could thus be simplified as follows:

The WUE was calculated as follows (Duet al.2017):

whereYis the yield (kg/plant) andETis the evapotranspiration(m3/plant).
The NPFP was calculated as Zhouet al.(2019):

whereYis the yield (kg/plant) andNappis the amount of urea applied (kg/plant).
2.4.Statistical analysis
Analysis of variance was conducted using the SPSS Statistical Software (ver.21.0,SPSS 2013). The data from each year were analyzed separately. The significance of the treatment effect was determined using theF-test,and comparisons of means were conducted using the least significant difference (LSD) at the 5% level of significance.
3.Results
3.1.Water consumption of apple trees
Based on 30 years of meteorological data (1986-2015)collected in Yulin,the annual rainfall at 25,50,75 and 95% frequency was 520.1,392.4,306.6 and 208.5 mm,respectively,while it was 640.1 and 561.6 mm in 2017 and 2018,respectively,indicating that both years were wet years. In 2017,the phenological phase of the apple tree was from April 15 to October 24 (a total of 193 days),during which time there was 576.4 mm of rainfall,accounting for 90.05% of the total annual rainfall,and the effective rainfall was 442.2 mm. In 2018,the phenological phase was from April 9 to September 17,for a total of 162 days. The rainfall during this period was 474.6 mm,accounting for 84.51% of the total annual rainfall,and the effective rainfall was 387.3 mm (Fig.2).
In 2017,the water consumption in W1 was 483.45 mm,10.02% lower in W2 (434.99 mm),and 15.41% lower in W3 (408.97 mm). In 2018,water consumption in W1 was 481.79 mm,10.14% lower in W2 (432.92 mm),and 18.71%lower in W3 (391.66 mm).
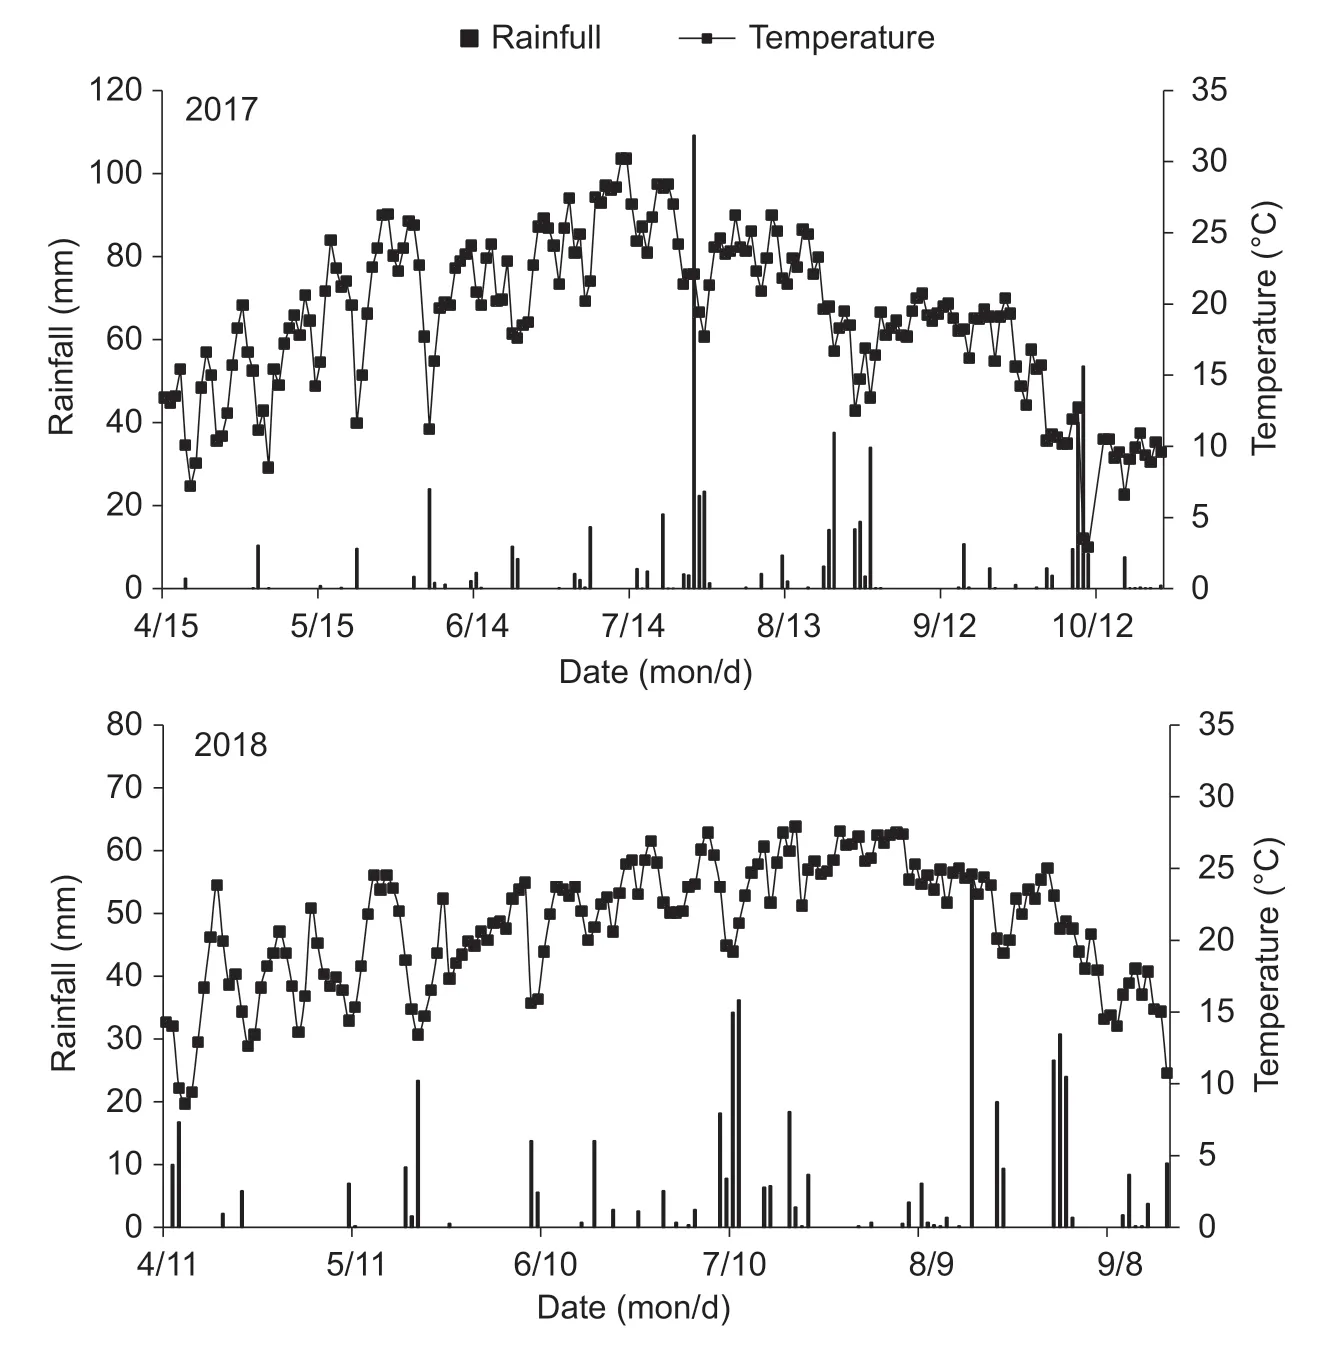
Fig.2 The rainfall and daily average temperature during the growth period of apple trees in the experiment area during 2017 and 2018.
3.2.Leaf area index (LAI)
During the full growth period of apple trees,the LAIs all showed a parabola curve with increasing time. This curve was roughly composed of three stages:a slowly rising stage(stage I:early April to early May),a rapidly rising stage (stage II:mid-May to mid-August),and a slowly falling stage (stage III:late August to mid-September) (Fig.3).
For two years,LAI showed the same trend. In stage I,the LAI did not differ significantly among the treatments. In stage II,as the Nappincreased,the LAI gradually increased.A larger Nappwas associated with a later date reached the maximum LAI (LAImax),indicating that the Nappaffects the number of days of LAI growth (Fig.3). These findings showed that the Napppromotes an increase of LAImax,but when the Nappexceeded 0.5 kg/plant,the effect of Nappon the LAImaxwas not significant. When the Nappwas the same,the LAI tended to increase with increased SWC,which indicated that the SWC promoted the increase in LAImax,and the difference between high and medium levels was not significant,while they were both significantly greater than the low treatment (Table 3; Fig.3). In stage III,the LAI of each treated apple tree began to decline slowly,and the difference between each treatment began to decrease.
3.3.Yield
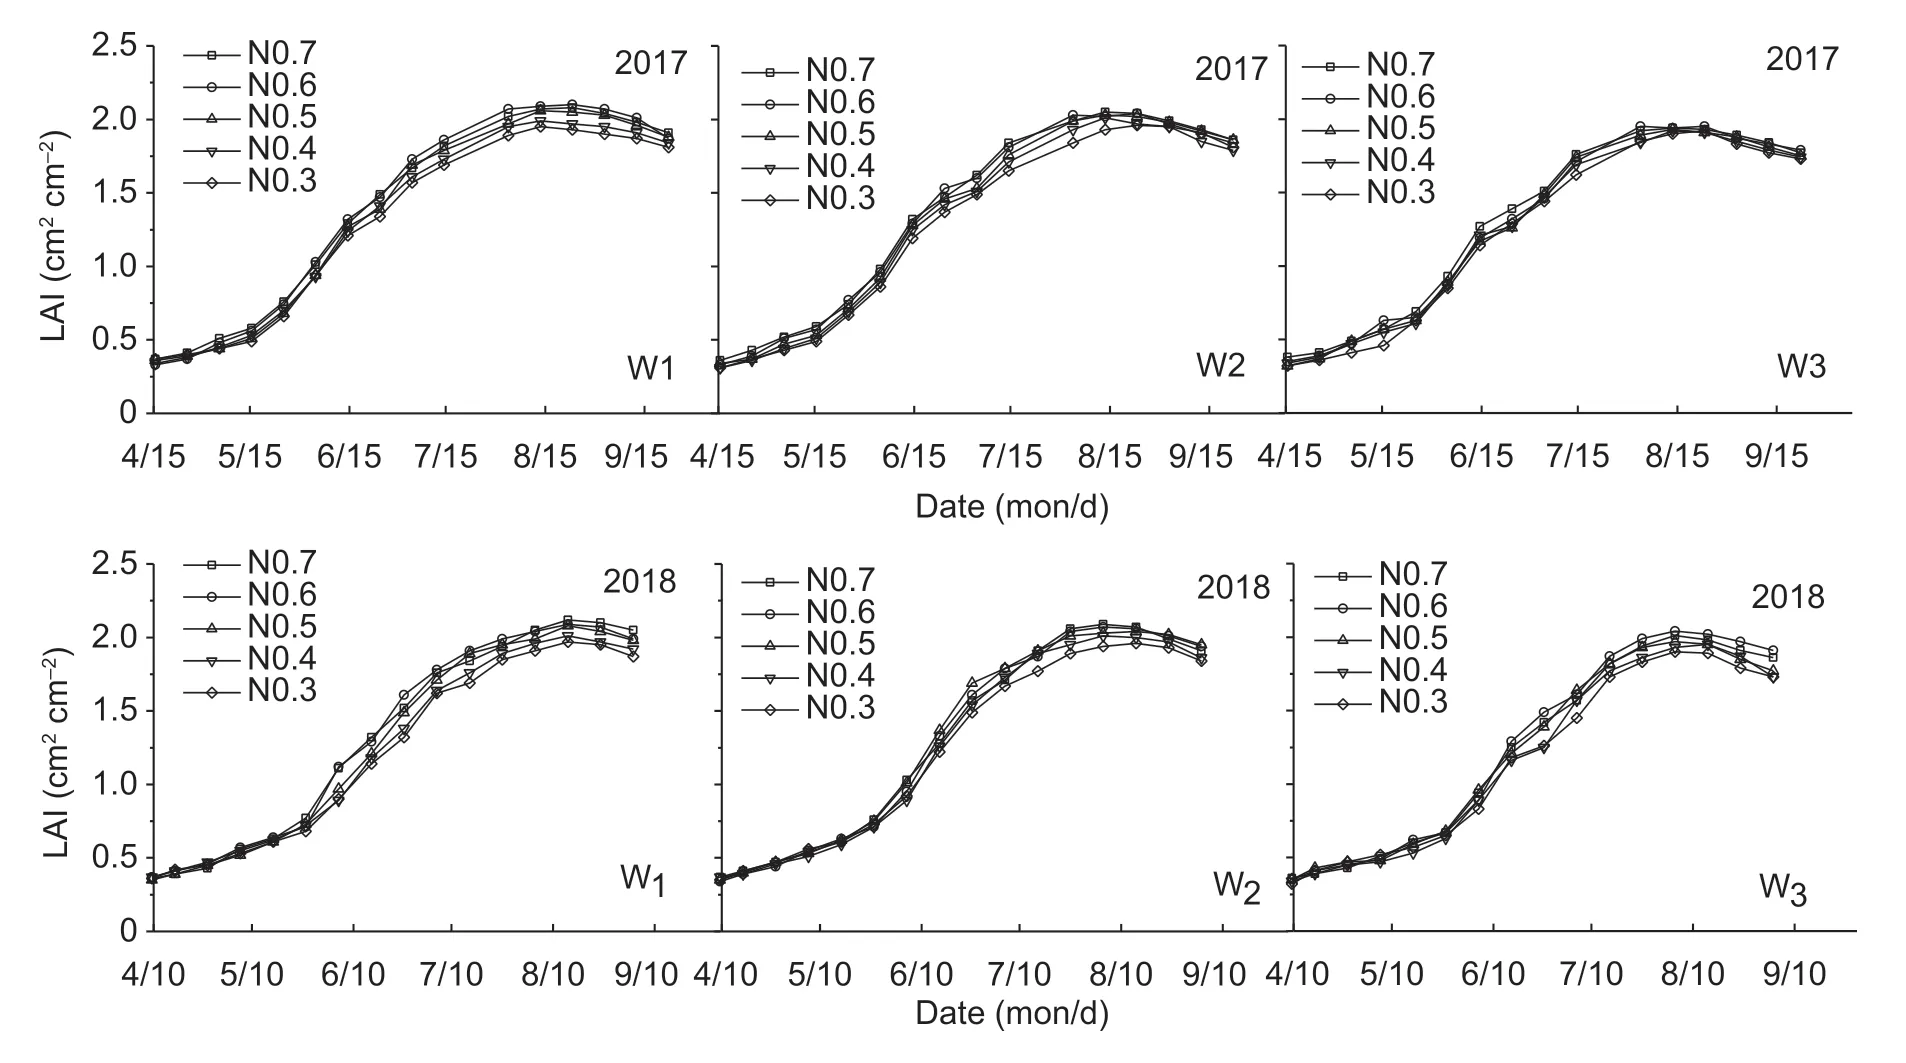
Fig.3 Effects of different amounts of water and nitrogen on leaf area index (LAI) of apple trees in 2017 and 2018. W1,W2 and W3 represent the soil water content at 90-75%,75-60% and 60-45% of field capacity; N0.7,N0.6,N0.5,N0.4 and N0.3 represent Napp of 0.7,0.6,0.5,0.4 and 0.3 kg/plant,respectively. Error bar indicates SD (n=3).

Table 3 Analysis of variance for the LAImax,yield,WUE and NPFP of apple trees in 2017 and 20181)
When the SWC was the same,the yield of apple trees first increased,then decreased as the Nappincreased (except for W1N0.7 and W2N0.7 in 2017). The variance analysis showed that the differences among treatments were not significant when the Nappexceeded 0.5 kg/plant,but they were significantly greater among the treatments when the Nappwas 0.3 kg/plant for the same SWC (Fig.4). For the same Napp,when the SWC was at low to medium levels,the yield was significantly increased (except for W3N0.4 in 2017 and W3N0.5 in 2018),while the difference was not significant when the SWC was from medium to high (except for W1N0.6,W1N0.5,and W1N0.4 in 2017),which indicated that the yield could be significantly increased by increasing the irrigation amount when the SWC was lower than the W2 level,but did not increase the yield significantly when the SWC was higher than the W2 level (Fig.4). The interaction effect of water and Nappon yield was significant (P<0.05)in 2018,but not in 2017,which may be due to the climate difference between the two years (Table 3).
3.4.Water use efficiency (WUE)
When the Nappwas the same,the WUE increased first,then decreased as the SWC increased in both years. In 2017,when the Nappwas greater than 0.6 kg/plant,the WUE of W2 level was significantly greater than that of W3 level,while there was no significant difference between W1 and W2 (Fig.5). Additionally,when the Nappwas less than 0.5 kg/plant,the difference in WUE among all treatments did not reach the significant level for the same SWC (Fig.5).In 2018,with the exception of W2N0.6,no significant difference in WUE among treatments was observed for the same SWC. When the SWC was the same,the WUE first increased,then decreased with increasing Napp,and the WUE increased significantly when the Nappincreased from 0.3 to 0.6 kg/plant (except for W1N0.7 in 2017 and 2018),while the difference in WUE between the Nappof 0.6 and 0.7 kg/plant did not reach a significant level (Fig.5). These findings indicated that the WUE increased significantly as Nappincreased when the Nappwas less than 0.6 kg/plant,but that increasing the Nappwould cause a decrease in WUE when the Nappwas greater than 0.7 kg/plant. The effect of water on WUE reached a very significant level in 2017,but not in 2018 which may be due to the serious reduction in yield because of spring fall in 2018 (Table 3).
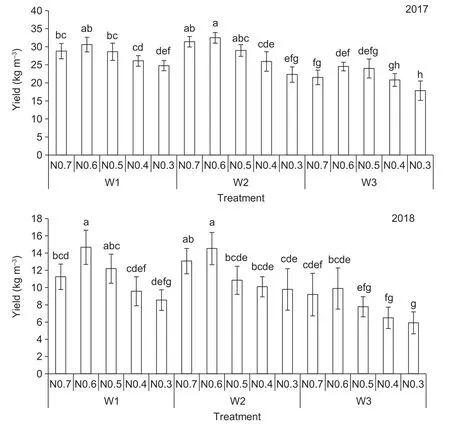
Fig.4 Effects of different amounts of water and nitrogen on the yield of apple trees in 2017 and 2018. W1,W2 and W3 represent the soil water content at 90-75%,75-60% and 60-45% of field capacity; N0.7,N0.6,N0.5,N0.4 and N0.3 represent Napp of 0.7,0.6,0.5,0.4 and 0.3 kg/plant,respectively. Different letters above the bars indicate a significant difference at P<0.05 according to an LSD test within the same year. Error bar indicates SD (n=3).
3.5.Nitrogen partial factor productivity (NPFP)
The NPFP gradually decreased as Nappincreased for the same SWC within two years (except for W1N0.4 and W2N0.5 in 2018),with a higher Nappbeing associated with a faster NPFP decline. These findings indicated that the increase in Nappwas not favorable for improving the NPFP in the two years. For the same Napp,when the SWC increased from W3 to W2,the NPFP increased significantly,while it declined when the level of SWC was from W2 to W1,but the difference did not reach a significant level in either year.Variance analysis of the NPFP treated with different water and Nappshowed that the effect of water on NPFP reached a very significant level (P<0.01) and the effect of Nappon NPFP was significant (P<0.05) in both years,while the interaction effect of water and Nappwas not significant in 2017,but reached a significant level (P<0.05) in 2018 (Table 3),which may have been because of climate differences between the two years (Fig.6).
3.6.Coupling effects of water and N on yield,WUE and NPFP
The amount of water and Nappgreatly influences the yield.Low water and Nappinputs are not conducive to high yields,so farmers believe that increasing water and Napplevels is an important method to reduce their risk of yield reduction.However,in the present study,excessive water not only reduced WUE,but also caused the leaching of nitrate nitrogen,and the excessive Nappcould result in increased costs and degraded soil structure. The WUE is an important indicator of water saving,and a high WUE is essential to sustainable agricultural development in water-scarce areas.The productivity of nitrogen is an indicator of local fertilization and soil nutrient levels. Therefore,the yield,WUE and NPFP were selected as the optimization objectives in the present study.
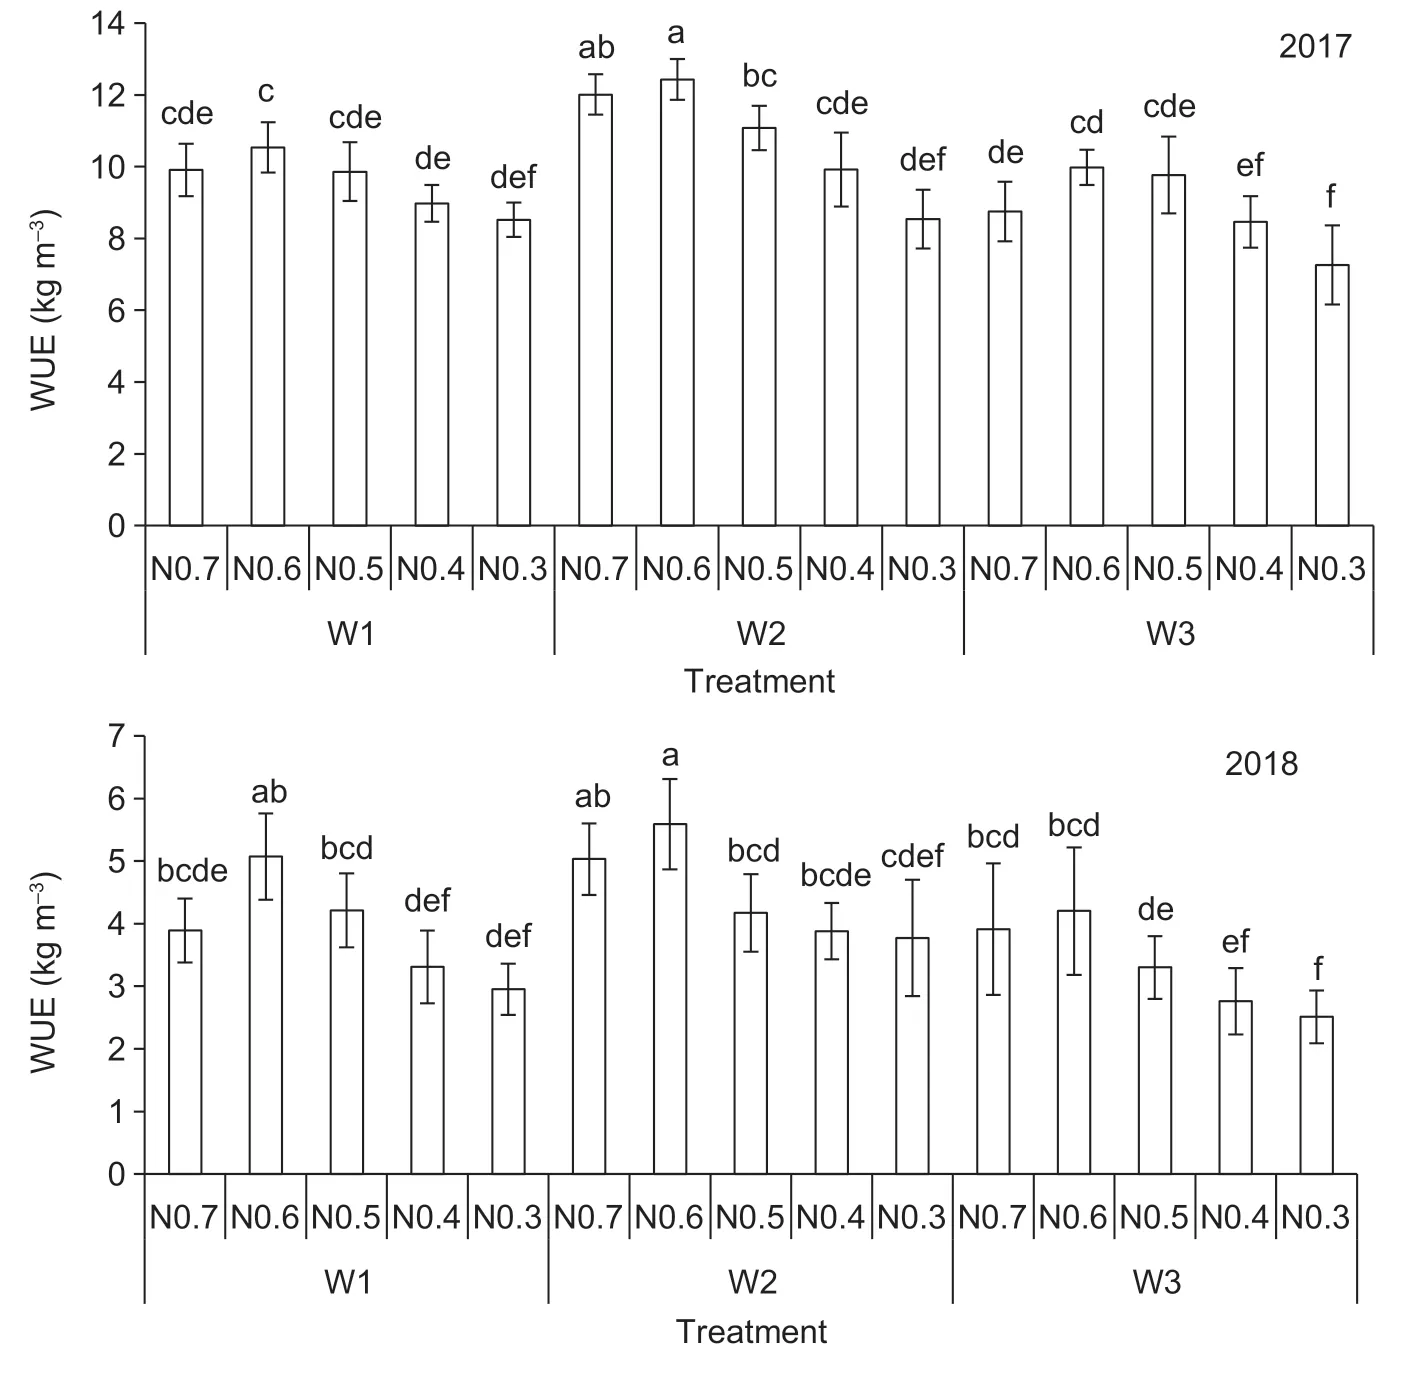
Fig.5 Effects of different amounts of water and nitrogen on the water use efficiency (WUE) in 2017 and 2018. W1,W2 and W3 represent the soil water content at 90-75%,75-60% and 60-45% of field capacity; N0.7,N0.6,N0.5,N0.4 and N0.3 represent Napp of 0.7,0.6,0.5,0.4 and 0.3 kg/plant,respectively. Different letters above the bars indicate a significant difference at P<0.05 according to an LSD test within the same year. Error bar indicates SD (n=3).
In the following analyses,the input amounts of water and Nappwere the independent variables; the upper and lower limits of water inputs were those corresponding to the W1 and W3 levels,respectively; and the upper and lower limits of the Nappwere 0.7 and 0.3 kg/plant,respectively. Yield,WUE,and NPFP were selected as the response variables.Based on the least squares method,the data were analyzed using the Matlab Software. A binary quadratic regression equation was established (Table 4) to calculate the amounts of water and Nappneeded to maximize the above parameters(Table 5).
Our results showed that it is difficult to obtain the maximum yield,WUE and NPFP simultaneously. Therefore,to help growers select the most suitable water and N management strategies to maximize yield under SRI,we conducted a spatial analysis of the WUE and NPFP of apple trees under SRI for two years to determine which treatment had the best results in terms of water and N use and yield.
Using the spatial analysis method,overlap of 85% of the maximum values was considered to be acceptable based on evaluation of 95,85,and 75% of the maximum yield,maximum WUE and maximum NPFP,respectively,for the two years. In 2017,when the irrigation amount and Nappwere 0.41 m3/plant and 0.45 kg/plant,the yield,WUE and NPFP were 31.09 kg/plant,11.63 kg m-3and 67.72 kg kg-1,respectively,representing a decline of 8.34,6.61 and 14.89% compared to the corresponding maximum in 2017.In 2018,when the irrigation amount and Nappwere 0.54 m3/plant and 0.45 kg/plant,the yield,WUE and NPFP were 12.25 kg/plant,4.60 kg m-3and 26.83 kg kg-1,respectively,with a decline of 13.31,12.38 and 14.53% compared to the corresponding maximum in 2018 (Fig.7). Assuming that the frequency of the optimal irrigation amount was the same as for W2,the corresponding SWC values were 75.60-60%and 77.62-60% of field capacity in 2017 and 2018,which does not exceed 3% of the difference of W2. Therefore,it is reasonable that the irrigating frequency for optimal irrigation was the same as W2.
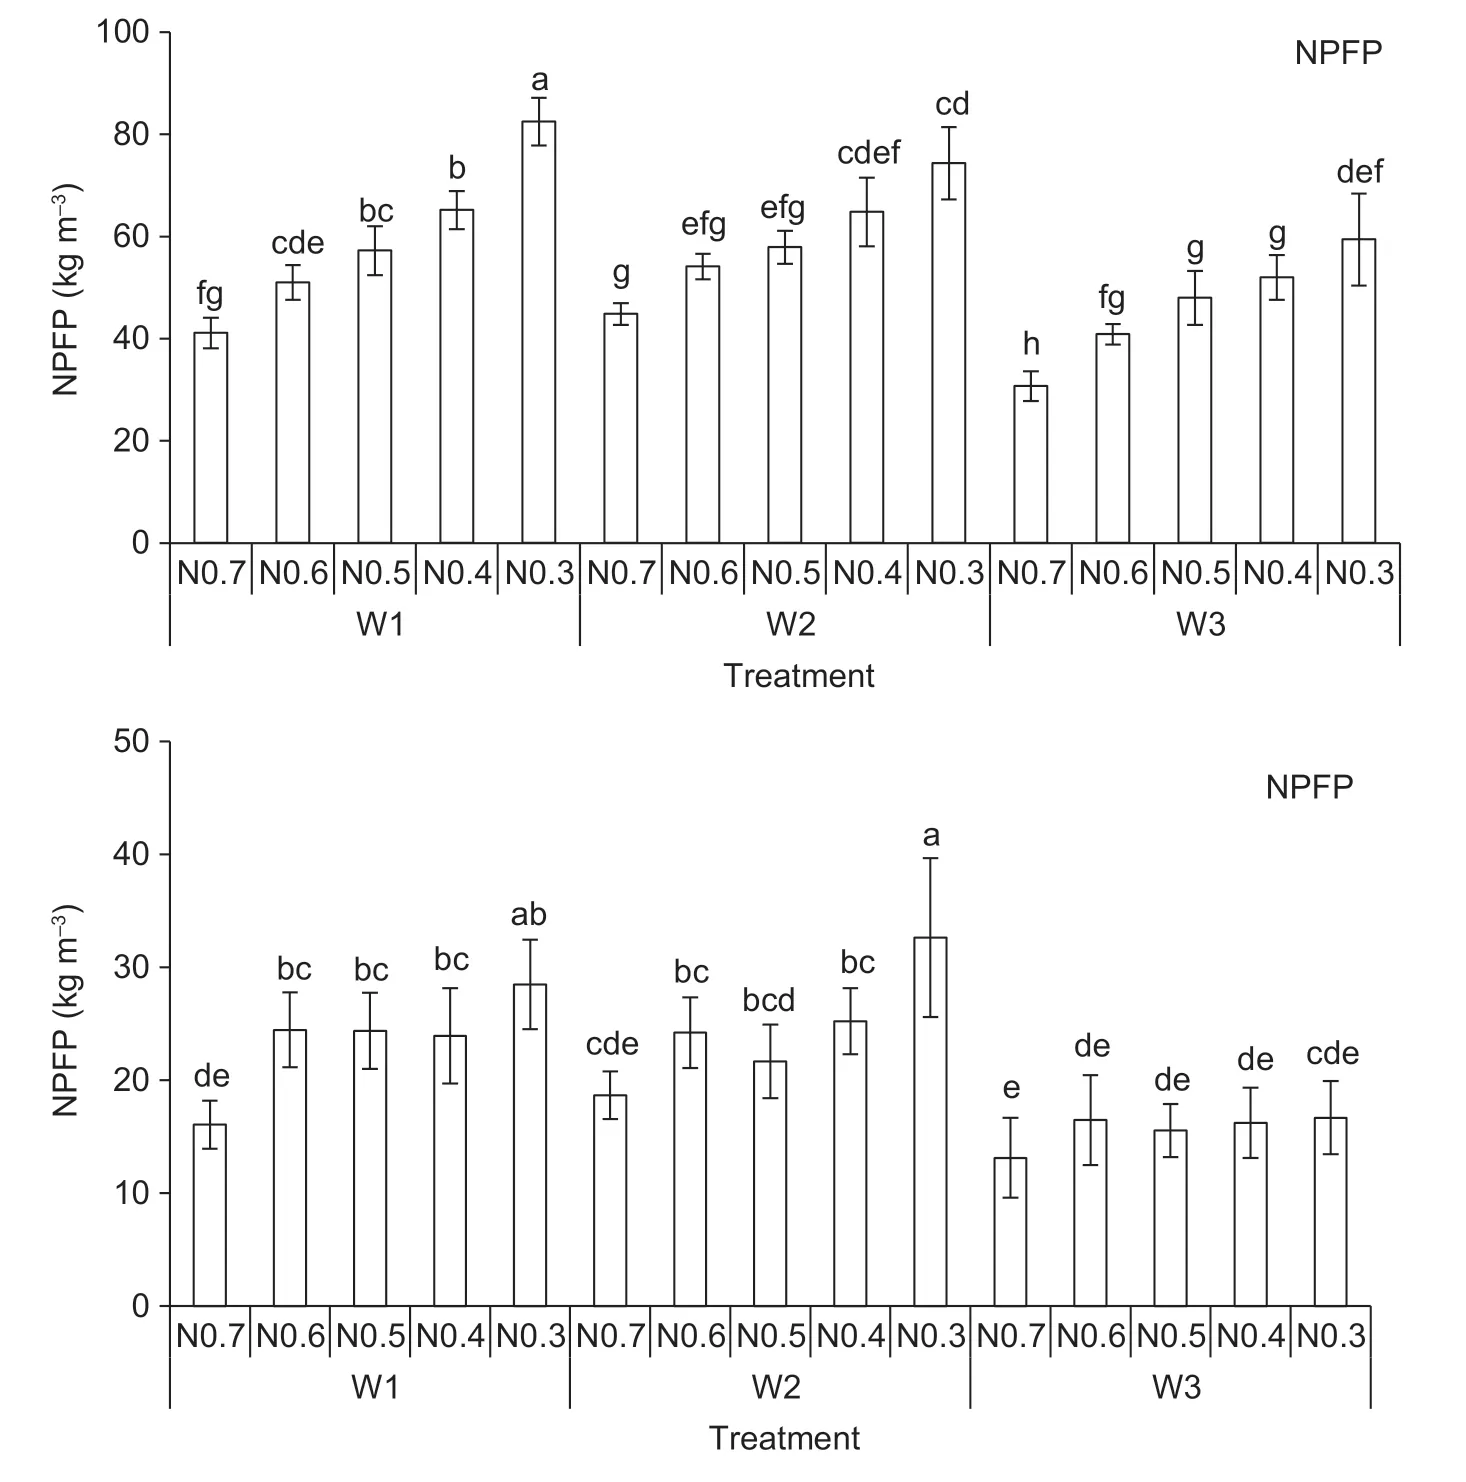
Fig.6 Effects of different amounts of water and nitrogen on the nitrogen partial factor productivity (NPFP) in 2017 and 2018. W1,W2 and W3 represent the soil water content at 90-75%,75-60% and 60-45% of field capacity; N0.7,N0.6,N0.5,N0.4 and N0.3 represent Napp of 0.7,0.6,0.5,0.4 and 0.3 kg/plant,respectively. Different letters above the bars indicate a significant difference at P<0.05 according to an LSD test within the same year. Error bar indicates SD (n=3).

Table 4 Regression equation of water and Napp inputs and yield,WUE and NPFP for apple trees in 2017 and 20181)
Combining the results for yield,WUE and NPFP under SRI in 2017 and 2018,we concluded that the optimal management of water and N applied by SRI to apple trees cultivated on the Loess Plateau is to control SWC within 75-60% of field capacity and the Nappat 0.45 kg/plant. This may achieve multiple targets of increasing yield while saving water and fertilizer.
4.Discussion
4.1.Effects of different water and N on the LAl and yield
The LAI,one of the main indicators for evaluating the status of leaf growth,is affected by soil moisture and nutrients(Dadrasanet al.2015; Vilanovaet al.2018). The results of the present study showed that the change in the LAI can be divided into a slow growth period,rapid growth period and slow decline period,similar to studies of cotton (Jiaet al.2015) and jujube (Zhang L Jet al.2010). At the end of the fruit expansion period,the LAIs of apple trees were between 1.73 and 2.05 cm2cm-2,which generally agreed well with the results of a previous study conducted by Liu C Wet al.(2013). Moreover,the effects of water and Nappon the LAI were significant (P<0.05),and the water had a greater influence on the LAI than Napp,which was inconsistent with the results of our previous research on surge-root irrigated jujube in this region (Daiet al.2018),which may be because of the poor drought tolerance of apple trees compared to jujube trees. When the SWC was the same,the LAImaxincreased with the increasing of Napp,and the duration of the rapid growth period of the leaves was longer. These findings indicate that Nappprolongs the growth period of leaves for apple trees. However,at the end of the fruit expansion stage,LAI is more strongly affected by the SWC than by the Napp. Therefore,both the SWC and Nappshould be controlled appropriately for optimum growth of fruit trees. This is because the absorption of Nappis mainly accomplished by crop roots,while suitable SWC conditions can improve the root oxidation activity and rootsourced cytokinins,which play an important role in crop root growth (Askaryet al.2018). Therefore,the ability of crops to absorb N is improved,which can delay the senescence of leaves and increase the LAI (Ookawaet al.2004; Rahimiet al.2013). Accordingly,the optimal LAI can be achieved only by considering the SWC and Nappcomprehensively.

Table 5 Maximum yield,WUE and NPFP and corresponding water and Napp inputs in 2017 and 20181)
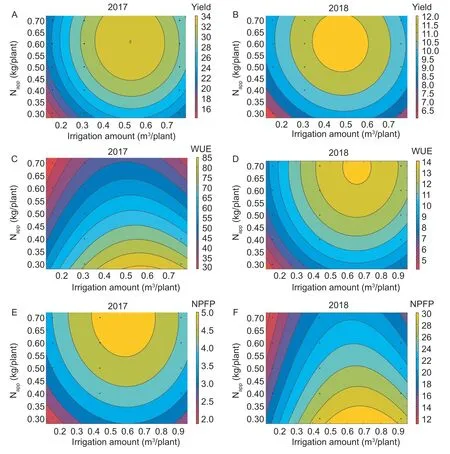
Fig.7 Regression fit of water and nitrogen application (Napp) inputs and yield,water use efficiency (WUE) and nitrogen partial factor productivity (NPFP) for apple trees in 2017 and 2018. A,the yield under different irrigation amounts and Napp in 2017. B,the WUE under different irrigation amounts and Napp in 2017. C,the NPFP under different irrigation amounts and Napp in 2017. D,the yield under different irrigation amounts and Napp in 2018. E,the WUE under different irrigation amounts and Napp in 2018. F,the NPFP under different irrigation amounts and Napp in 2018.
As the ultimate goal of crop production,yields are greatly influenced by the water and Napp,which has been confirmed in many crops,such as winter wheat (Zhanget al.2018),winter rapeseed (Guet al.2017) and tomato (Liu Het al.2013). Within a certain range of water and N inputs,the yield of apple trees gradually increased with increases in water and Napp,but the yield decreased when the amount of water and Nappexceeded a certain threshold. Therefore,only the appropriate amount of water and Nappcan achieve the goal of high yield (Chenafiet al.2016; Lopezet al.2018;Meszaroset al.2019). Under the same water conditions,the yield first increased,then decreased with increased Napp,which shows that when the Nappexceeds the appropriate range,it not only cannot increase the yield but also causes a decline in apple production. Therefore,selection of a suitable Nappis not only conducive to increasing the yield,but also to reducing fertilizer costs (Daiet al.2018). When the Nappwas the same,the yield was not significantly different between W1 and W2,but higher than that of W3. These findings indicate that when the SWC was 75-60% of field capacity,the increase of SWC cannot significantly increase the yield,while a SWC lower than this level could cause the yield decreasing significantly. Therefore,a SWC of 75-60% of field capacity can be considered suitable for saving irrigation water while ensuring that the yield of apple trees does not decrease significantly,which was similar to the study of Guo (2013).
Comparison of the yield and LAI of apple trees revealed that the yield had a non-linear relationship with the LAI.These findings indicate that the yield increased as the LAI increased within a certain range of water and Napp. The low SWC and Napplevels resulted in a low LAI,which influenced the photosynthesis of apple trees and resulted in a decline of yield,while a reasonable water and Nappinput could increase the LAI within a certain range,allowing the leaves to take full advantage of light energy and improve photosynthetic efficiency,so as to obtain the highest yield (Dadrasanet al.2015). However,there is competition between leaf growth and apple growth for water and N,and when the LAI exceeds a certain reasonable range increased amounts of water and N are absorbed for leaf growth,thus affecting the yield (Daiet al.2018). In the present study,the LAI was not the highest when the Nappwas 0.6 kg/plant,but the highest yield was obtained when the SWC was 75-60% of field capacity in 2017 and 90-75% of field capacity in 2018,and this difference may have been because of meteorological differences between the two years. When the Nappexceeds a reasonable range,the physiological growth process will be too prosperous,thus consuming too many nutrients,which will lead to a decline in yield. Therefore,only reasonable Nappcan promote increased water and N entering the fruit under the condition of reasonable control of the LAI to achieve the purpose of increasing production.
In addition,the sample size also had an impact on the results,the larger the sample size,the more accurate the results,but the larger the workload. Therefore,this experiment used three replicates,and each replicate contained three trees,and combined with statistical analysis to reduce the impact of the sample size.
4.2.Effects of different water and N on the WUE and NPFP
The WUE of apple trees was significantly influenced by water and Napplevels in both years. Aujlaet al.(2005) revealed that the WUE was not affected by the quantity of water,but a decrease in the Nappcaused a decrease in WUE at all quantities of water applied,which was consistent with the results of the current study. When the Nappwas less than 0.5 kg/plant,the WUE did not differ significantly among water levels (P>0.05),which indicated that when the Nappwas less than 0.5 kg/plant,increasing or decreasing the water did not improve the WUE significantly. When the Nappwas more than 0.6 kg/plant,the WUE showed a decreasing trend with increasing Napp,and the WUE of W1 and W2 was significantly higher than that of W3,while the WUE of W1 and W2 did not differ significantly for the same Napp. This is because,when the Nappwas more than 0.6 kg/plant,continuing to increase Nappmay have caused inefficient growth of apple trees,leading to a decrease in yield under the same SWC. When the SWC increased from W3 to W1,the WUE increased,then decreased. This was because as the SWC increases,the proportion of soil water and air gradually decreases,which can affect the root system’s growth characteristics and then the WUE (Yanget al.2011).
The NPFP was also greatly influenced by Napp,with the maximum value being obtained at the lowest Napp,indicating that NPFP was inversely proportional to Napp(Aujlaet al.2007; Zotarelliet al.2008). These findings are similar to those reported in studies of sunflower (Massignamet al.2009) and maize (Gheysariet al.2009). The highest NPFP was observed at the lowest Napplevel,indicating that N stress resulted in decreased partitioning of dry matter to vegetative growth and increased transfer of assimilates to fruits near the end of the growing season. Suitable SWC conditions may induce the initiation and growth of secondary roots,which improves the ability of the crop to absorb both water and N from the soil matrix,and may increase the NPFP(Lopezet al.2018). Zotarelliet al.(2009) found that crops extracted more N from the soil to sustain crop N demand under conditions in which N is limited,so the NPFP was improved. Additionally,when the soil moisture was at W3 level,the yield and NPFP were low,regardless of the Napp.These findings showed that when the SWC is low,it is unreasonable to increase the yield by only increasing the Napp,and there will be less N uptake and high nitrate leaching(Sotoet al.2015).
4.3.Coupling effects of water and N
Increasing yield is of great importance to increasing farmers’income,while increasing WUE and NPFP can help farmers reduce the inputs of water and Napp,which would also be of great benefit to the sustainable development of agriculture.The relationships between water and Nappinputs and crop yields have been established by many researchers through a combination of multivariate regression and spatial analyses(Kianiet al.2016). According to our results,the maximum yield,WUE and NPFP of apple trees cannot be achieved simultaneously. Therefore,apple growers must make appropriate choices during the cultivation of apple trees,so that water and N resources are managed to maximize the yield,WUE and NPFP under SRI. In this study,we established the relationship between water and Nappinputs and crop yield by considering 85% confidence intervals.A SWC interval of 75-60% of field capacity and an Nappof 0.45 kg/plant resulted in ≥85% of the maximum yield,WUE and NPFP for apple trees under SRI. Therefore,these conditions may achieve the multiple targets of reduced water and fertilizer use coupled with increased yield. Fenget al.(2008) showed that the optimal amount of pure N for apples was 0.18-0.27 kg/plant,about 0.39-0.58 kg/plant of urea which was similar to our study.
5.Conclusion
The level of SWC and Napphad significant effects on LAI,yield,WUE and NPFP of apple trees under SRI. The LAI got the maximum when the SWC and Nappwere all the highest.Increasing the SWC significantly increased the yield and NPFP,but did not lead to a significant improvement in the WUE when the Nappwas less than 0.5 kg/plant,while the yield,WUE and NPFP showed a parabolic trend with the increase of SWC when the Nappwas more than 0.6 kg/plant.The different irrigation amounts and Nappwere needed to obtain the maximum yield,WUE and NPFP simultaneously.The combination of controlling the SWC at 75-60% of field capacity and the Nappat 0.45 kg/plant provides the optimum conditions for surge-root irrigated apple trees in the Loess Plateau,which can achieve a high yield while reducing water and fertilizer use.
Acknowledgements
This study was supported by the National Key Research and Development Program of China (2016YFC0400204),the National Natural Science Foundation of China (51479161 and 51279157) and the Natural Science Foundation of Jiangxi Province of China (20192BAB216037).
杂志排行
Journal of Integrative Agriculture的其它文章
- lnfectious disease-resistant pigs:Will they fly?
- Crop photosynthetic response to light quality and light intensity
- Alginate oligosaccharides preparation,biological activities and their application in livestock and poultry
- Genome-wide pedigree analysis of elite rice Shuhui 527 reveals key regions for breeding
- TaSnRK2.4 is a vital regulator in control of thousand-kernel weight and response to abiotic stress in wheat
- Development and characterization of new allohexaploid resistant to web blotch in peanut
