Use of two-stage dough mixing process in improving water distribution of dough and qualities of bread made from wheatpotato flour
2021-12-14YlNJianCHENGLiHONGYanLlZhaofengLlCaimingBANXiaofengGUZhengbiao
YlN Jian,CHENG Li , ,HONG Yan , ,Ll Zhao-feng , ,Ll Cai-ming , ,BAN Xiao-feng , ,GU Zheng-biao ,
1 State Key Laboratory of Food Science and Technology,Jiangnan University,Wuxi 214122,P.R.China
2 School of Food Science and Technology,Jiangnan University,Wuxi 214122,P.R.China
3 Collaborative Innovation Center of Food Safety and Quality Control in Jiangsu Province,Jiangnan University,Wuxi 214122,P.R.China
Abstract The two-stage dough mixing process was innovated to improve the qualities of bread made from potato flour (PF) and wheat flour at a ratio of 1:1 (w/w). The final dough was first prepared from wheat flour before being added with PF. The effects of the method on enhancing the dough qualities were verified,and the distribution of water in gluten-gelatinized starch matrix of the doughs was investigated. We observed that the bread qualities were improved,as reflected by the increase of specific volume from 2.26 to 2.96 mL g-1 and the decrease of crumb hardness from 417.93 to 255.57 g. The results from rheofermentometric measurements showed that the dough mixed using the developed mixing method had higher maximum dough height value,time of dough porosity appearance,and gas retention coefficient,as well as enhanced gluten matrix formation compared to that mixed by the traditional mixing method. The results from low-field nuclear magnetic resonance confirmed that the competitive water absorption between gluten and gelatinized starch could restrict the formation of gluten network in the dough mixed using the traditional mixing process. Using the novel mixing method,gluten could be sufficiently hydrated in stage 1,which could then weaken the competitive water absorption caused by gelatinized starch in stage 2;this could also be indicated by the greater mobility of proton in PF and better development of gluten network during mixing.
Keywords:gelatinized starch,gluten network,potato flour,water distribution,two-stage dough mixing process
1.lntroduction
To meet human’s healthy diet needs,a number of nutritious grains (Gosine and Mcsweeney 2019) and whole flour (Liuet al.2016; Liu Xet al.2019) have increasingly been used in bread and other staple foods. In addition,as an important source of carbohydrates in human diet,potato is a low-fat source of dietary nutrients (Lianget al.2019),including the essential amino acid lysine (Caoet al.2019),dietary fiber,vitamins,minerals,protein,and antioxidants (Tianet al.2016). Potato flour (PF) is one of the most important forms of potato used in the food industry because of its high nutritional values and storage stability (Liet al.2018). At a macro level,the Chinese government has launched thePotato Staple Food Strategyin 2015 that aims at ensuring national food security,promoting agricultural income,improving people’s dietary pattern,and ensuring people’s health needs met (Lianget al.2019).
Previous studies have shown that at content of under 20 g 100 g-1mixed flour,PF can be mixed with wheat flour and used to improve bread qualities,such as texture and flavor,without significantly affecting its external attributes (Jianget al.2018). However,at higher contents,PF could have negative effects on some sensory qualities (especially for specific volume and texture) of bread. These drawbacks severely limit the application of PF in fermented staple foods.According to most researchers,the problems are due to the steric hindrance effects of PF,which block the formation of gluten network. Some corresponding solutions have been established,including the use of additives (such as gluten,Hathornet al.2008; enzyme,Santiagoet al.2015; and hydrocolloids,Liuet al.2017),sourdough (Zhaoet al.2019),and the treatment of PF with high pressure (Carballoet al.2018). While most of these studies used PF of no more than 30 g 100 g-1mixed flour,some studies have used PF of as high as 50 g 100 g-1mixed flour (specific volume<2.4 mL g-1); in both cases,the bread quality still could not be much improved. Thus,it appears that the steric hindrance effects may not be the primary factor contributing to the decline of bread qualities.
Hydration during mixing and formation of gluten network is known to affect dough properties (Xionget al.2017) and bread qualities. Nawrockaet al.(2017) have described that polysaccharides with high water-holding capacity could partially dehydrate gluten network during mixing. Thus,a dough mixing process that reduces the destructive effects of PF,which has similar properties to that of polysaccharides (Liuet al.2016),may be used to optimize the water distribution in dough systems prepared from flour with a high degree of gelatinization. However,the availability of technology and equipment for potato staple food is still limited (Zhanget al.2017). An effective dough mixing method that can successfully improve the qualities of bread made from PF has not been reported.
Composite bread made from PF was selected as a representative of fermented staple foods in this quality improvement research. The aims of this study are to establish a dough mixing process that can improve the qualities of composite bread,and to elucidate the mechanism of how the established mixing method can affect the competitive water absorption between gluten and gelatinized starch. A twostage dough mixing process was innovated with an aim to weaken such effects. To better understand the interactions between gluten and PF in the composite matrix,low-field nuclear magnetic resonance (LF-NMR) spectrometer was employed to study the state and distribution of water in the dough obtained from different processes. The relationships between the distribution of water in the gluten-gelatinized starch matrix and the properties of the dough and final products were also established.
2.Materials and methods
2.1.Materials
Potato flour (moisture=7.59 g 100 g-1,protein=7.70 g 100 g-1,starch=81.34 g 100 g-1; dry basis) was purchased from Fuguang Food Co.,Ltd.(Inner Mongolia,China).Wheat gluten (moisture=9.98 g 100 g-1,protein=83.99 g 100 g-1,starch=12.28 g 100 g-1; dry basis) and wheat starch (moisture=12.51 g 100 g-1,protein=0.01 g 100 g-1,starch=99.97 g 100 g-1; dry basis) were purchased from Midaner Trading Co.,Ltd.(Henan,China). Wheat flour(moisture=13.10 g 100 g-1,protein=14.41 g 100 g-1,starch=82.93 g 100 g-1; dry basis) was purchased from New Land Co.,Ltd.(Henan,China). Instant yeast was purchased from Lesaffre Group (Marcq-en-Baroeul,France).Sugar,salt,skimmed milk powder,and unsalted butter were purchased from a local supermarket (Auchan,Wuxi,China).
2.2.Dough preparation processes
Traditional dough mixing processThe first three types of dough were prepared by a traditional dough mixing method. Each type of dough was prepared using the same wheat protein content,14.41 g 100 g-1,which is the same content found in the commercial wheat flour. Main materials and their amounts are shown in Fig.1. Supplementary ingredients (SI) including instant yeast,salt,milk powder (2 g 100 g-1each),and sugar (10 g 100 g-1) were also added.The amount of total water was 85% of the moisture content and water absorption (dry basis) of the main materials,as measured by a Mixolab analyzer (Appendix A).
Dry materials and ingredients were weighed and then placed in a stand mixer (Premier Chef KMC510,Kenwood,UK). The mixture was premixed at low speed (50 r min-1)for 1 min before tap water was added. After that,it was continuously mixed at low,medium (96 r min-1),and high(132 r min-1) speeds,each for 4 min. After the mixer was stopped,unsalted butter (6 g 100 g-1) was immediately added,and the mixture was further stirred at low,medium,and high speeds for 0.5,2,and 2 min,respectively.
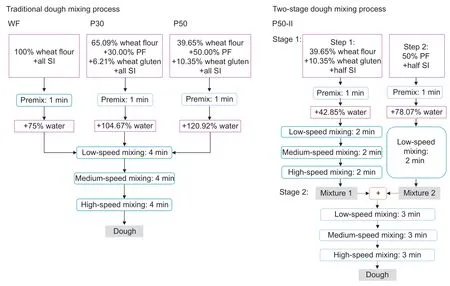
Fig.1 Flow diagrams showing the traditional and the two-stage dough mixing processes. WF,dough made from wheat flour; P30,dough made from blended flour containing 30% PF (dry basis); P50,dough made from blended flour containing 50% PF (dry basis);P50-II,dough made from the same materials as those used for P50,but the dough was prepared by the two-stage dough mixing process. SI,supplementary ingredients. Text boxes highlighted with grey,product obtained from different dough mixing stages.
Two-stage dough mixing processThe last type of dough was prepared by a two-stage dough mixing method. The materials used in this process are listed in Fig.1. In stage 1,dry materials in step 1 were premixed with water for 1 min.After that,they were stirred at the three different speeds mentioned previously,each for 2 min. Thereafter,materials in step 2 were premixed for 1 min and then blended at low speed for 2 min. In stage 2,the two mixtures from steps 1 and 2 were mixed at the three speeds,each for 3 min.Finally,the dough was mixed with butter as described previously. To minimize the numbers of variables between the two samples,the total amount (the combined amount used in steps 1 and 2) of water added to P50-II (dough made from blended flour containing 50% PF by the two-stage dough mixing process) was the same as that added to P50 dough (dough made from blended flour containing 50% PF by the traditional dough mixing process); by this way,the only difference between the two doughs during the whole dough-making process is the mixing method. The amount of water added to P50-II in step 1 was determined by a Mixolab analyzer (Appendix A). The amount of water added to P50-II in step 2 was the same as the difference between water added to P50 and that added to P50-II in step 1.
2.3.Bread preparation process
Each dough sample was divided into 200-g pieces,each of which was molded,sheeted and then shaped into loaves before placing in a toast mold (MY23081,Bakewell Appliance Co.,Ltd.,Wuxi,China). The dough was fermented for 90 min at (37±0.5)°C and 80% RH,and was later baked for 20 min at 170°C (top) and 210°C (bottom)in an electric oven (MK-C1P2A,Midea,Foshan,China).The obtained bread was cooled down to room temperature(22±2)°C on a cooling rack for 2 h.
2.4.Determination of characteristics of raw materials and mixed flour
Determination of water retention capacity (WRC)The WRC of samples was measured according to the AACC methods (approved method 56-11; AACC International 2000) with slight modifications. Due to strong water holding capacity of gluten and gelatinized starch,the weight of materials added into the suspension was changed from 5.000 g to 2.000 g,while the amount of water added was unchanged (25 g). All WRC results were corrected to the moisture content of 14 g 100 g-1.
Measurements of thermomechanical properties by Mixolab analyzerThe tests were conducted according to the method of Nyembweet al.(2018). Thermomechanical properties of different types of dough were measured using a Mixolab2 analyzer (Chopin Technologies,Villeneuve-La-Garenne,France). All measurements were performed following the Mixolab ‘Chopin+’ protocol.
2.5.Determination of dough characteristics
Dough properties and gas production during fermentationThe tests were conducted based on the method described by Verheyenet al.(2015) with some modifications. The properties of dough during fermentation were examined using a rheofermentometer F3 (Chopin Technologies,Villeneuve-La-Garenne,France).Immediately after kneading,a 250-g dough sample was placed in the fermentation basket in the proofing chamber and was then covered with an optical sensor and a 2 000-g weight. All tests were conducted at 38°C for 3 h.
Magnetic resonance imaging (MRl) measurementsThe LF-NMR spectrometer (MesoMR23-060V-I,Newmag,Shanghai,China) was employed to acquire MRI images of dough samples. The samples were cut,sealed in strips of PTFE tape,shaped into cylinders,and then immediately placed in a glass tube (external diameter=25 mm). The slices were placed in a coronal (x,y) position. The spin echo sequence was used,and its parameters were set as follows:slice width=1.9 mm; slice gap=2.0 mm; TR=1000.000 ms;TE=18.200 ms; averages=4; read size=256; and phase size=192. The pseudo color was added into the acquired images using the NMR Image Processing System V1.0. The classical color space was in JET mode,and the level and window were set at 128 and 255,respectively.
Proton relaxation measurementsThe transverse relaxation time (T2) of model dough (MD) samples,which contained different wheat protein:PF ratios but the same moisture content,was determined using the LF-NMR spectrometer as described previously. Five MD samples were prepared according to Table 1. The moisture content of each sample was controlled at 100 g 100 g-1solid materials (dry basis). The wheat protein and PF contents of MD-4 dough were controlled at 14.41 and 50 g 100 g-1solid materials (dry basis),respectively,which were equal to those of P50 and P50-II mentioned earlier. The rest of the solid material portion was filled with commercial wheat starch. Under this basis,the content of wheat protein was decreased or increased by 8 g 100 g-1solid materials (dry basis),causing the proportion of PF to simultaneously increase or decrease at the same rate. T2 values of common dough samples including WF,P30,P50 and P50-II(produced without SI) were also examined.
The dough samples were cut and weighed to 2.0 g,and were then immediately placed in a 25-mm tube as described previously. T2 was acquired using the Carr-Purcell-Meiboom-Gill (CPMG) pulse sequence,the parameters of which were set as follows:TW=2000.000 ms; TE=0.250 ms;NECH=1600; NS=4; RFD=0.080 ms; RG1=20.0 db;P1=7.00 μs; DRG1=3; and PRG=1. All tests were conducted at 25°C.
2.6.Measurements of bread characteristics
Measurement of specific volumeVolume (mL) of bread was measured using the standard millet displacement method. The specific volume (mL g-1) is a ratio of volume(mL) and mass (g).
Analysis of texture by a total texture analyzer (TPA)The texture of bread was examined using a texture analyzer (TAXT plus,Stable Micro Systems,UK) equipped with a plate probe (P/36R). The bread was cut into slices,each with a 1-cm thickness. The pre-test speed was 1.00 mm s-1,and the test and post-test speeds were 1.70 mm s-1. The applied deformation was 40%,and the delay time between the two compressions was 5.00 s. All tests were carried out after the samples were cooled down for 2 h.
2.7.Statistical analysis
The data are expressed as mean±standard deviation. All spectral data were generated using ORIGIN 9.1 (OriginLab Inc.,Northampton,USA). All statistical analyses,including one-way variance analysis and Duncan’s multiple rangetests,were performed on SPSS 23 (SPSS Inc.,Chicago,USA). The difference atP<0.05 is considered significant.Each test or measurement was carried out at least three times.
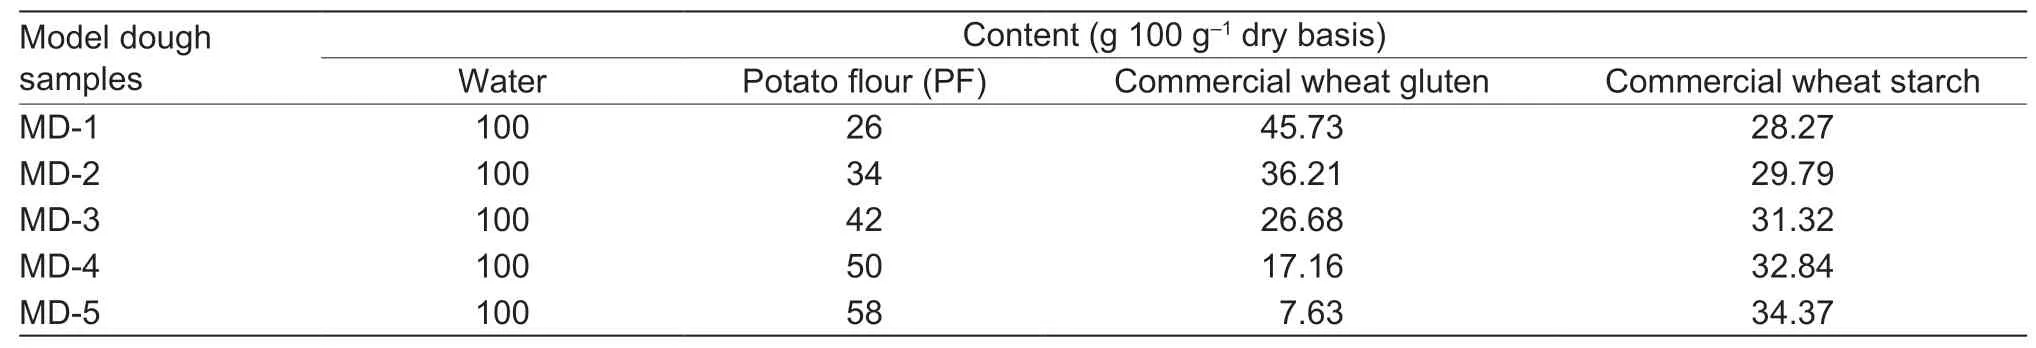
Table 1 Formulation of model dough samples used for magnetic resonance imaging (MRI)
3.Results
3.1.Characterizations of bread qualities
Bread qualities were assessed and used as indicators for the effectiveness of the two-stage dough mixing process.Fig.2-A and Table 2 show the specific volume of breads prepared by different formulations and processes. The volume of WF bread was the highest; however,it was significantly reduced by 55.16% when the proportion of PF was increased to 50 g 100 g-1mixed flour. After the twostage mixing method was applied,the volume of P50-II bread was greatly improved by 30.97% compared to that of P50 bread.
As shown in Table 2,the proportion of PF significantly affected the crumb texture. With the increase of PF,the hardness of P30 and P50 breads were increased by 36.88 and 206.13%,respectively,compared with that of WF;however,their cohesiveness values were slightly reduced.The bread hardness shown in Fig.2-B varied during different storage periods. The hardness of WF bread was the lowest after 2 days of storage,but was increased to higher than those of P30 and P50-II breads after a longer storage time.In addition,after PF was added,springiness of P50 bread decreased by 56.83% and its chewiness increased by 17.69%,whereas its cohesiveness and resilience were only slightly decreased compared with those of WF dough. WF or P30 bread had slightly higher cohesiveness and resilience than P50 bread. When the new process was applied,the texture qualities of P50-II bread,including crumb softness,cohesiveness,springiness,resilience,lower gumminess,and chewiness,were obviously higher than those of P50 bread. After 4 days of storage,the hardness of P50-II bread was the lowest among all samples.
3.2.Characteristics of dough

Fig.2 Qualities of bread prepared by different formulations and processes. A,photographs of bread slices prepared from different doughs. B,hardness of bread crumbs during different storage periods. WF,bread made from wheat flour; P30,bread made from blended flour containing 30% potato flour (PF) (dry basis); P50,bread made from blended flour containing 50% PF (dry basis); P50-II,bread made from the same materials as those used for P50,but the dough was prepared by the two-stage dough mixing process.
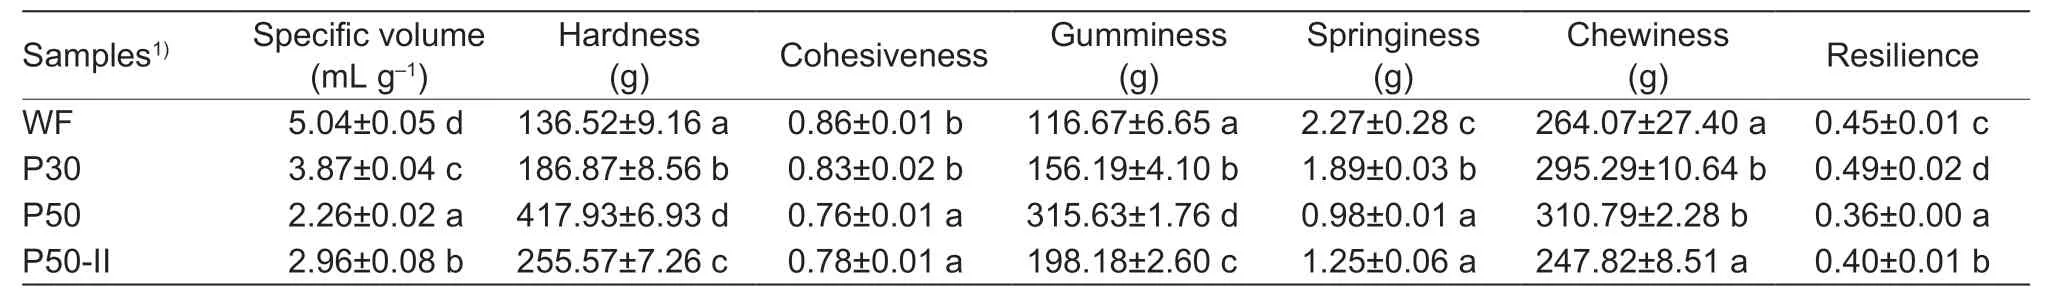
Table 2 Specific volume and textural characteristics of bread samples prepared using different formulations and processes

Table 3 Fermentation properties of dough samples prepared using different formulations and processes
The fermentation properties of dough are shown in Table 3.P50 and P50-II doughs had similar total gas production(VT). With the increase of the added amount of PF,the Hm(maximum dough height measured during the test) value of P50 dough was 66.40% lower than that of WF dough,while the Hmvalue of P50-II dough,which was prepared by the novel method,was 29.65% higher than that of P50 dough.The addition of PF also caused the dough height determined at the end of the tests (h) to decrease,while caused the(Hm-h)/Hmvalue to increase. Compared with those of P50 dough,the Hmvalue of P50-II dough increased by 42.15%,whereas its (Hm-h)/Hmvalue decreased by 57.70%.
For gas release properties,the height of maximum gas formation (H´m) of all samples was not significantly different.With the increase of PF content,the time of dough porosity appearance (Tx) and the gas retention coefficient (R) of P50 dough decreased by 43.26 and 25.46%,respectively,compared with those of WF dough. However,the two values of P50-II dough increased by 25.33 and 12.78%,respectively,compared to those of P50 dough.
3.3.State and distribution of moisture in dough
Solvent retention capacityAs shown in Fig.3-A,wheat flour and wheat gluten had higher WRC values than wheat starch,due to their higher protein content. The WRC value of PF was 4.18 times higher than that of wheat gluten as PF has a high degree of starch gelatinization (93.83%).
MRlFig.3-B shows 2D proton density images of the transverse sections of doughs. The overall colors of WF dough (Fig.3-B1) were yellow and green and appeared homogeneous. The addition of PF appeared to disrupt the homogeneity,especially of the P50 dough,as indicated by the increased number of red dots. In contrast,as illustrated in Fig.3-B,the color of P50-II dough was distinct from that of P50 dough. At the same moisture content,water was more evenly distributed in P50-II dough than in P50 dough.T2 The results on molecular mobility of water in different samples are shown in Fig.4 and Table 4. According to Fig.4-A,after PF was added,T21,T22,T23 and M23/M0 of these samples slightly increased,while their M21/M0 and M22/M0 ratios decreased,which indicated that the mobility of protons increased. The overall trend was that the density of the gluten network increased and the mobility of water decreased with increasing gluten:PF ratio.
Compared the results of three common dough samples(from WF to P50) illustrated in Fig.4-B and Table 4,it could be seen that at the same wheat protein amount,the increase of added amount of PF caused the moisture content of dough to increase significantly,as indicated by the significant increase of the total peak area of the curves (M0,Fig.4-B).The increase of added amount of PF also led to the increase of water mobility in dough,as reflected in the increase of T21,T22,T23 (relaxation time of the first,second,and the third peaks,respectively),and M23/M0 (the proportion of the third peak area to the total peak area) and the decrease of M21/M0 and M22/M0. In addition,compared with those of P50 dough,T21 and T22 of P50-II dough decreased,while its M21/M0 and M22/M0 ratios increased and T23 and M23/M0 values decreased. This observation is similar to that shown in Fig.4-A,in which the gluten:PF ratio increased.
4.Discussion
4.1.Effect of the two-stage mixing process on enhancement of bread qualities
The changes of bread qualities could directly reflect the effects of PF addition and different dough mixing methods.When the traditional dough mixing process was used,the specific volume was decreased,which could lead to the dilution and destructive effects of PF on gluten network. In contrast,when the two-stage dough mixing process was used,the specific volume of P50-II bread was significantly increased. Both the P50 and P50-II breads had the same formulation,including the same gluten content; thus,it is possible that the increase of specific volume is related to the improved gluten matrix.
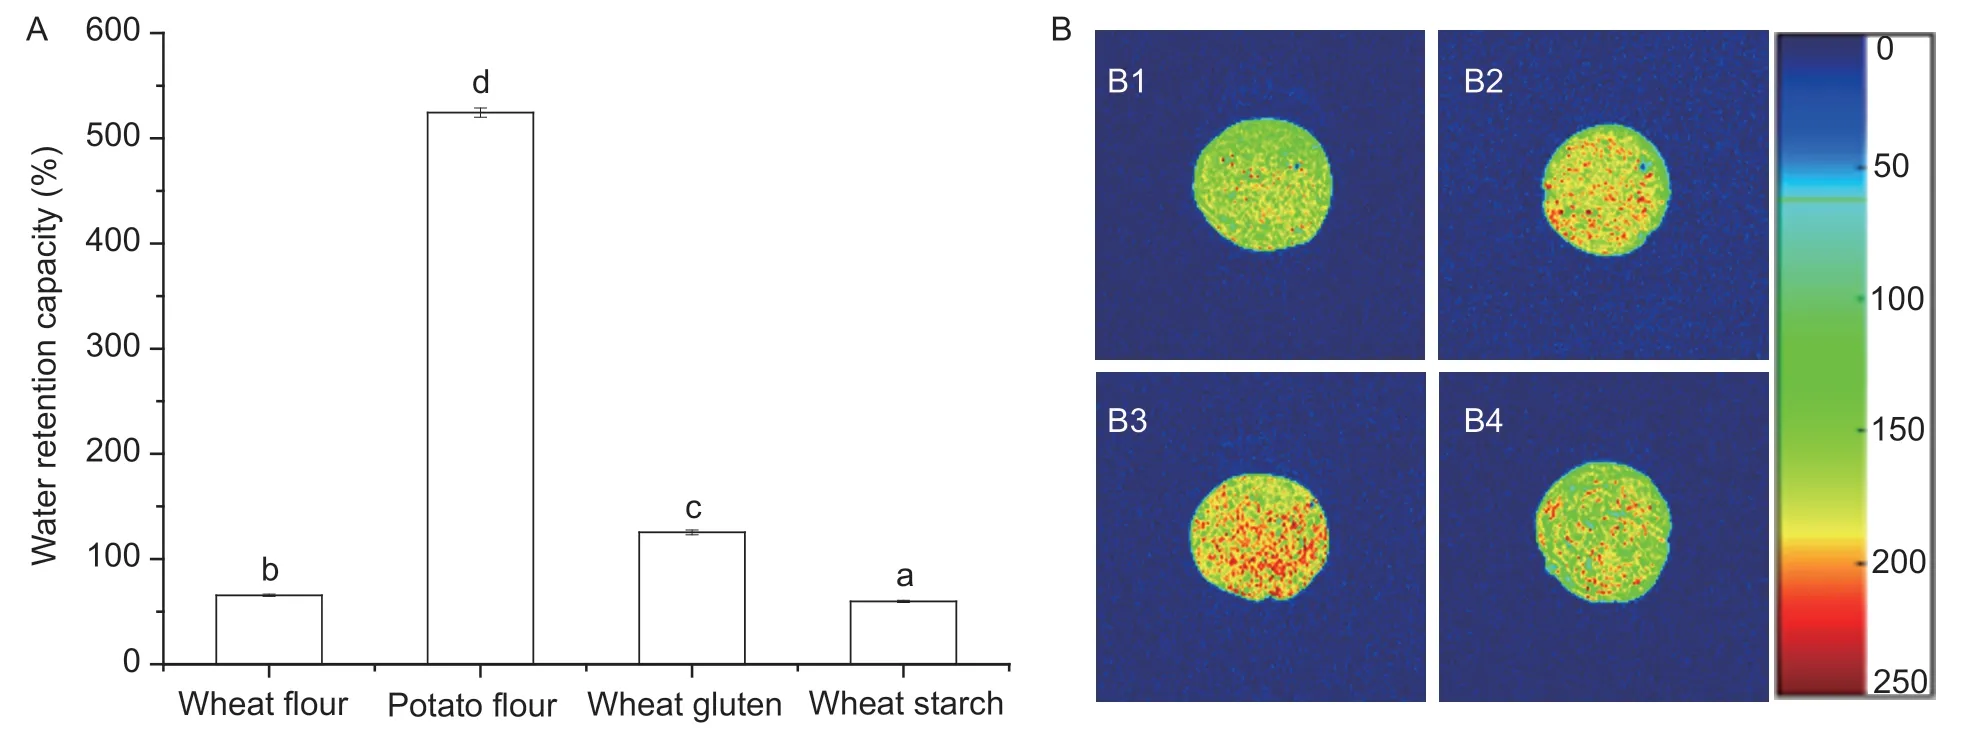
Fig.3 Water retention capacity of different materials and water distribution in different dough samples.A,water retention capacity of wheat flour,potato flour,wheat gluten,and wheat starch. B,pseudo-color images illustrating water distribution in fresh,unbuttered doughs:B1,WF dough; B2,P30 dough; B3,P50 dough; and B4,P50-II dough. The colors (blue through green and yellow to red)represent the increasing moisture contents in dough samples. Values are mean±standard deviation (n=3). Means with different letters are significantly different (P<0.05).

Fig.4 Continuous distribution of transverse relaxation time (T2) of different doughs. A,T2 of model doughs containing different wheat protein:PF ratios (which decreased sequentially from MD-1 to MD-5) but the same moisture content. B,T2 of common doughs.WF,dough made from wheat flour; P30,dough made from blended flour containing 30% PF (dry basis); P50,dough made from blended flour containing 50% PF (dry basis); P50-II,dough made from the same materials as those used for P50,but the dough was prepared by the two-stage dough mixing process.
Bread crumb texture is an important indicator that can be used to evaluate the quality of bread. Bread crumb hardness is conversely correlated to specific volume:the larger the specific volume of the bread,the lower the bread crumb hardness (or the softer the bread). The changes of bread crumb hardness during storage might be due to that wheat flour more easily retrograded than PF,as confirmed by the Mixolab results (Appendix A).Springiness decreased after PF was added,indicating that the impact of the weakening of gluten network (which has a negative impact on springiness) was more prominent than that of the formation of gelatinized potato starch matrix(which has a positive impact on springiness). A slight increase of chewiness indicated that bread made from PF at a higher amount was slightly rubbery. In addition,WF and P30 bread had slightly higher cohesiveness and resilience than P50 bread,indicating that they might be less susceptible to crumbling,which is the properties that are more favorable to consumers (HanAet al.2019).These results are consistent with those reported by Liuet al.(2016). Texture qualities of P50-II bread made using the new mixing method were obviously improved due to improved moisture distribution in the dough. The results on storage stability indicated that higher proportion of PF and more complete hydration of gluten could lead to higher storage stability of bread.
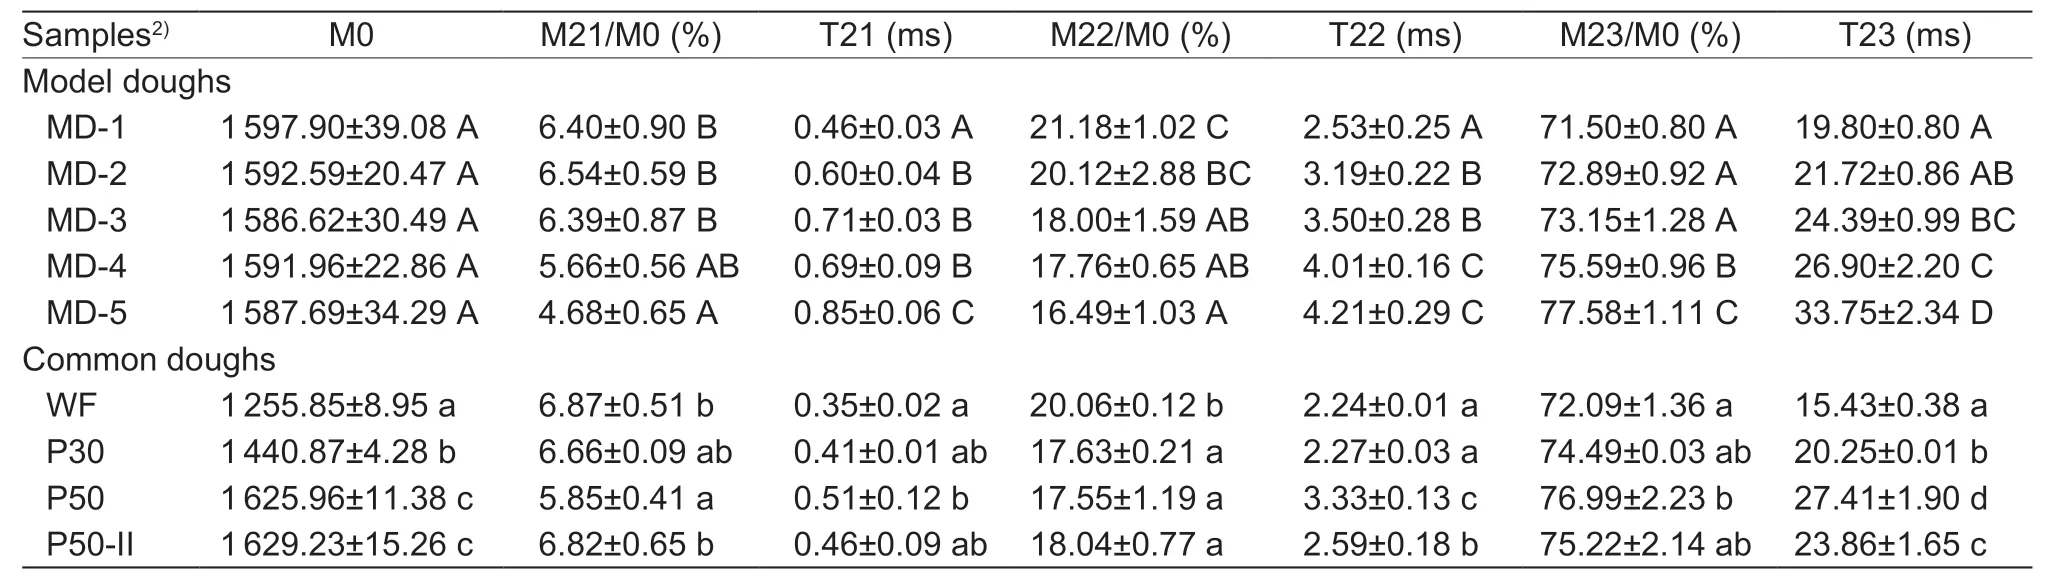
Table 4 Transverse relaxation time (T2) and inversion spectra areas of model doughs and four common doughs1)
4.2.Effect of the two-stage mixing process on enhancement of dough matrix
Dough development is a result of both yeast gassing power and gluten network integrity (Gaoet al.2017). The VTvalues of P50 and P50-II doughs were similar,indicating that both doughs have similar yeast gassing capacity. Therefore,it appears that the properties of dough could solely be represented by gluten network integrity. The Hmand H´mvalues can indirectly indicate the gas holding capacity (Kimet al.2008) of dough and the specific volume of bread.Besides,a lower (Hm-h)/Hmvalue or a higher R value is an indicator that the dough has high stability (Xuet al.2018).Our mixing method caused P50-II dough to have a stronger and more stable gluten network. In other words,this novel process could improve the gluten network of the dough so that it could retain more gas and have a higher volume,which in turn cause the bread to have a higher volume.
4.3.Effect of the two-stage mixing process on competitive water absorption between PF and gluten
To understand the effects of PF on gluten hydration,WRC of both materials and their components were determined.The results showed that the WRC of PF was higher than that of wheat gluten. This could be due to the uptake of water by the broken hydrogen bonds in the crystalline regions and non-starch polysaccharides of PF (Ahmedet al.2015)caused by the heat treatment process (Han Het al.2019).Thus,we speculated that competitive water absorption between the two components might occur during mixing.
MRI was applied to measure the proton density (Xinet al.2018) of dough samples and to validate the competitive absorption of water between wheat gluten and PF.Homogeneity of color was used to indicate the uniformness of moisture distribution in the food system (Kovrlijaand Rondeau-Mouro 2017). According to the WRC results,the main material that absorbed water in WF dough was gluten. When a protein sufficiently absorbs water,the network should be well-formed and the water distribution should be uniform. The addition of PF caused the ununiform distribution of water,which had high WRC,may absorb more water,causing aggregates and small clumps to form during mixing. During the early stages of mixing,PF can interrupt the formation of bonds that stabilize the gluten network and decrease the available water in the dough (Niuet al.2018),in turn causing the protein hydration to be inhibited(Nawrockaet al.2017). The new mixing method could help gluten in the P50-II dough to be fully hydrated before PF was added. As a result,water molecules that were bound tightly to gluten through hydration could not be easily withdrawn from PF. Overall,the results show that the two-stage mixing process could weaken the competitive water absorption.
4.4.Effect of the two-stage mixing process on proton mobility of gelatinized starch-gluten matrix
Water in dough systems could be divided into three groups(the population appears on the far right in Fig.4 is not discussed). A higher relaxation time indicates that water in the dough is more mobile and active (LiuQet al.2019).The first two groups include the bound water and the immobilized water (Hopkinset al.2019):rigid CH protons in gluten chains of these groups may interact with each other(Zhuet al.2012),or protons of water may be exchanged with CH protons of starch (Nivelleet al.2019). The third group is the diffusive water; in this group,water protons may be exchanged with intermediate-mobility protons of gluten including some mobile CH protons and gluten functional groups (Wanget al.2004,2014),or the mobile OH protons of starch may form strong interactions with water (Bosmanset al.2012; Kiumarsiet al.2019). We observed that the T2 value increased with increasing PF:wheat gluten ratio,indicating that at the same moisture content,the degree of tightness of the combination of water and PF was weaker than that of the combination of water and gluten. This was also confirmed by the increase of M23/M0 and the decrease of M21/M0 and M22/M0 values. These observations indicate that the more fully hydrated the protein in the dough,the lower the motility of water in the dough. For this reason,the P50 and P50-II doughs were different. These results are consistent with those described in Section 3.1,which further confirm that the two-stage dough mixing process could allow gluten to better retain water.
Additionally,some previous reports have pointed out that gelatinization could increase the mobility of a large portion of rigid CH protons and OH protons of starch (Bosmanset al.2012; Hageret al.2014). A damaged structure of starch could lead to a faster exchange of water protons with starch protons (Bosmanset al.2012). Furthermore,higher degrees of crystallinity could lead to higher amount of water that is tightly bound to starch granules (Bosmanset al.2013,2016).Therefore,it could be inferred from the results depicted in Fig.4-B and Table 4 that with the same gluten content but with gradually increasing PF content,the ratio of gelatinized potato starch to crystalline wheat starch increased,causing the proportion of immobilized proton in dough to decrease.At the same time,the amount of water tightly bound to gluten decreased while the amount of mobile water protons bound to PF increased due to its high water retention capacity.Taken together,with a certain water content,the mobility of protons in gelatinized starch is greater than that in gluten matrix. That is,water that has been absorbed by gluten in the first mixing stage could hardly be absorbed by gelatinized starch in the second stage.
Collectively,the novel process could greatly improve the volume and water distribution of the dough. The novel two-stage dough mixing process could allow gluten to better retain water,which in turn improved the gluten network.This could be due to the following two reasons:(1) the novel method may lead to a complete gluten hydration,generating the network structure that is more robust and stable; and (2) the novel method may reduce the amount of water absorbed by PF,which can then lead to a smaller rehydration expansion volume,and in turn reduce the steric hindrance of PF to gluten network. Therefore,properly adjusting moisture distribution in dough could lead to dough with better properties and bread with higher qualities.
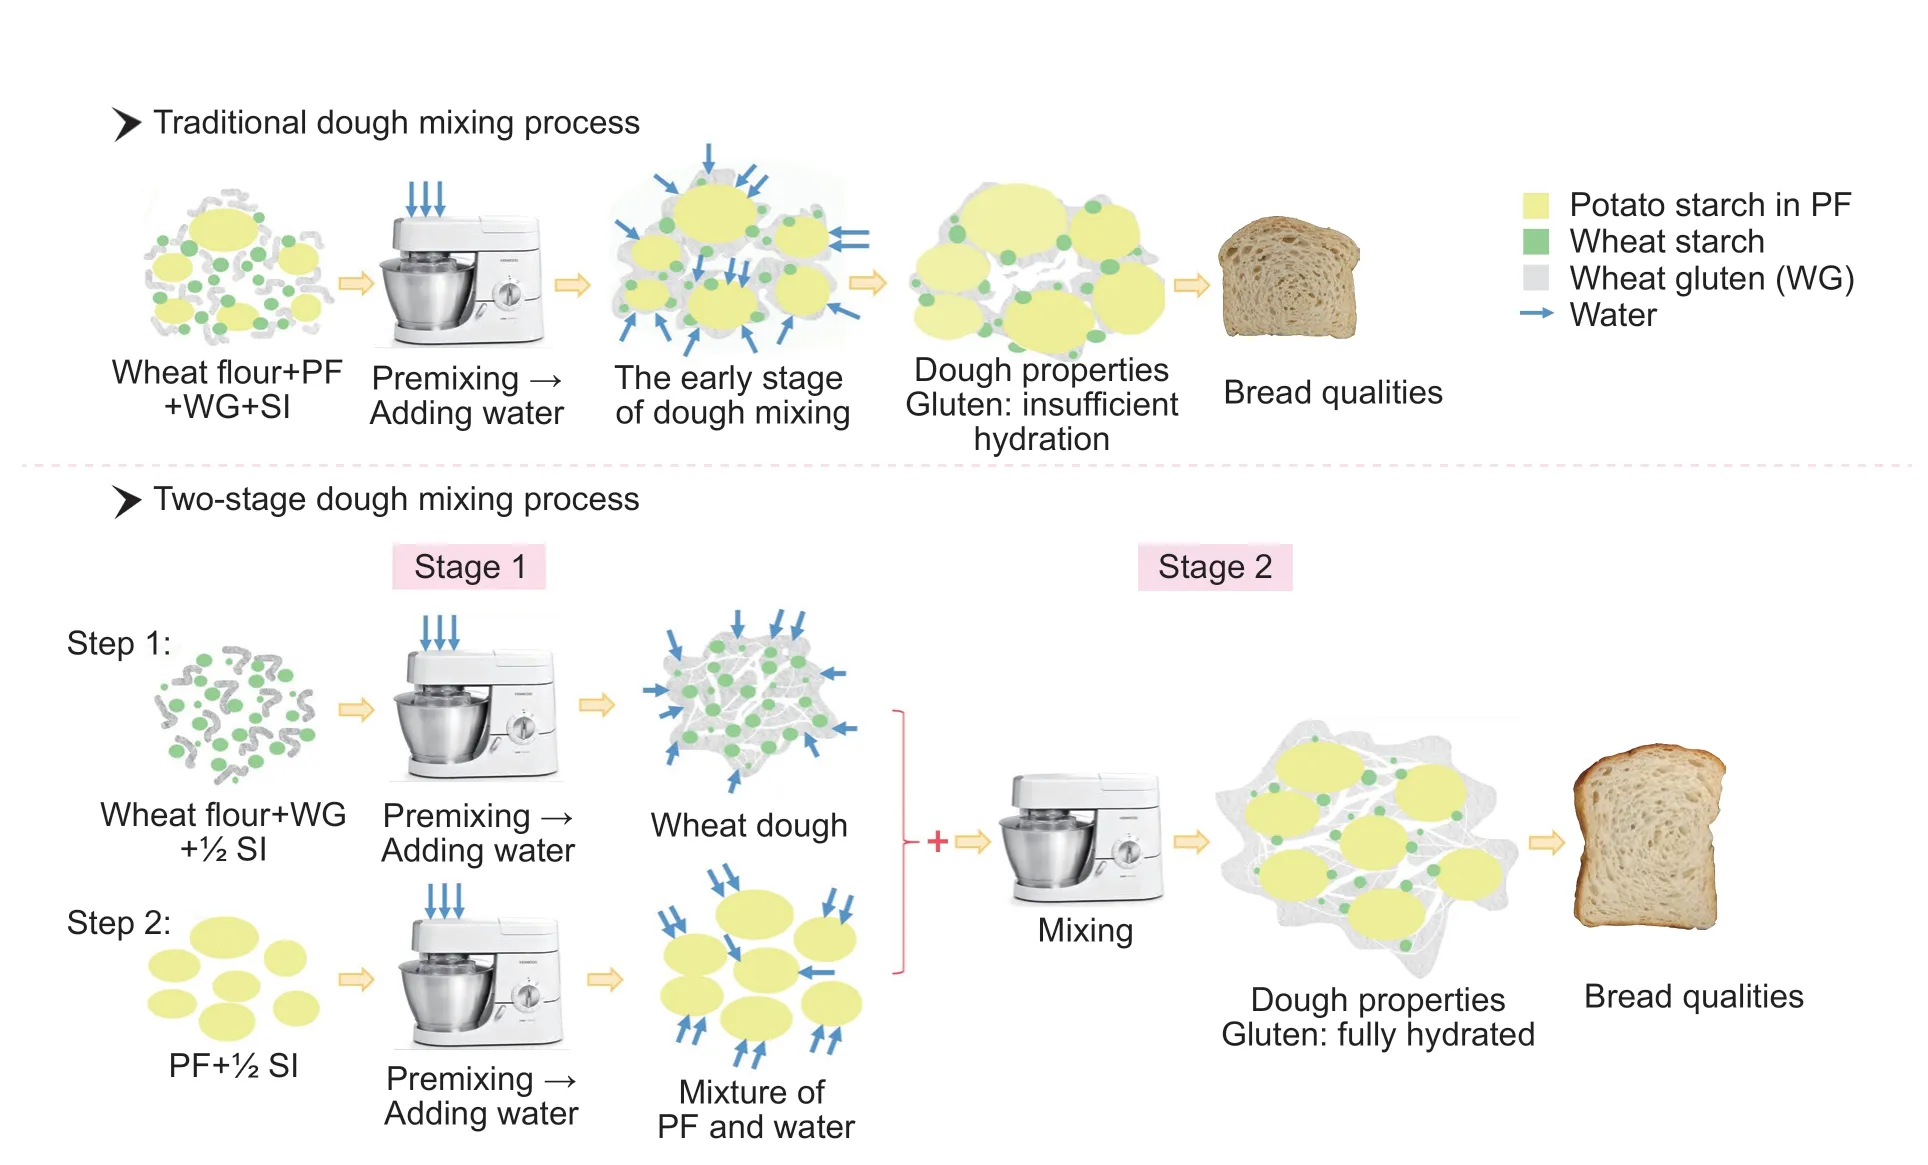
Fig.5 Mechanisms and effects of competitive water absorption between gluten and gelatinized starch in potato flour (PF) of different dough mixing processes. SI,supplementary ingredients.
The mechanism of water distribution between PF and gluten and its effects on gluten network and bread qualities are summarized in Fig.5. With the traditional dough mixing process,a strong competitive water absorption between the two components can obstruct the gluten hydration,thus a well-interconnected network matrix cannot be developed,causing the structure of the P50 dough to become fragile.With the two-stage dough mixing process,gluten is sufficiently hydrated (in stage 1) so that the network is more properly formed. By this way,the negative effects of PF in stage 2 are restrained,and a more rigid gluten network is formed; as a result,the robustness of P50-II dough structure is increased,and the qualities of bread are improved.
5.Conclusion
Effects of competitive water absorption between gelatinized starch and gluten during traditional dough mixing process can result in undesirable specific volume and crumb texture of bread that is made from PF-wheat flour. The two-stage dough mixing process was therefore innovated to overcome such problem. We found that the novel mixing process could significantly improve the overall quality of gluten matrix,thus enhancing the qualities of bread. With this method,gluten could be sufficiently hydrated in stage 1,causing the water absorption by PF to be restrained in stage 2. Additionally,the well-interconnected gluten network developed in stage 1 could not be easily dehydrated by PF in stage 2,as indicated by the increased proton mobility of PF compared to that of gluten. Overall,to further promote the reform of the agricultural industry and improve the dietary pattern of people in China or in the world,the two-stage dough mixing process developed in this work should be promoted and applied to produce staple foods from other types of grains and whole flours.
Acknowledgements
This work was supported by the National Natural Science Foundation of China (31701527),the National Key Research and Development Program of China (2017YFD0400401),the Policy Guidance Program of Jiangsu Province,China(SZ-SQ2017021) and the Jiangsu Province “Collaborative Innovation Center of Food Safety and Quality Control”industry development program,China.
Appendixassociated with this paper can be available on http://www.ChinaAgriSci.com/V2/En/appendix.htm
杂志排行
Journal of Integrative Agriculture的其它文章
- The dynamic impact of income and income distribution on food consumption among adults in rural China
- Driving factors of direct greenhouse gas emissions from China’s pig industry from 1976 to 2016
- ATP regulates the phosphorylation and degradation of myofibrillar proteins in ground ovine muscle
- lmpact of climate change on maize yield in China from 1979 to 2016
- Estimating daily actual evapotranspiration of a rice-wheat rotation system in typical farmland in the Huai River Basin using a two-step model and two one-step models
- Optimization of water and nitrogen management for surge-root irrigated apple trees in the Loess Plateau of China