lmpact of climate change on maize yield in China from 1979 to 2016
2021-12-14WUJianzhaiZHANGJingGEZhangmingXlNGLiweiHANShuqingSHENChenKONGFantao
WU Jian-zhai,ZHANG Jing,GE Zhang-ming,XlNG Li-wei,HAN Shu-qing,SHEN Chen,KONG Fan-tao
1 Agricultural Information Institute,Chinese Academy of Agricultural Sciences/Key Laboratory of Agricultural Big Data,Ministry of Agriculture and Rural Affairs,Beijing 100081,P.R.China
2 Institute of Special Animal and Plant Sciences,Chinese Academy of Agricultural Sciences,Jilin 130112,P.R.China
Abstract Climate change severely impacts agricultural production,which jeopardizes food security. China is the second largest maize producer in the world and also the largest consumer of maize. Analyzing the impact of climate change on maize yields can provide effective guidance to national and international economics and politics. Panel models are unable to determine the group-wise heteroscedasticity,cross-sectional correlation and autocorrelation of datasets,therefore we adopted the feasible generalized least square (FGLS) model to evaluate the impact of climate change on maize yields in China from 1979-2016 and got the following results:(1) During the 1979-2016 period,increases in temperature negatively impacted the maize yield of China. For every 1°C increase in temperature,the maize yield was reduced by 5.19 kg 667 m-2 (1.7%).Precipitation increased only marginally during this time,and therefore its impact on the maize yield was negligible. For every 1 mm increase in precipitation,the maize yield increased by an insignificant amount of 0.043 kg 667 m-2 (0.014%).(2) The impacts of climate change on maize yield differ spatially,with more significant impacts experienced in southern China. In this region,a 1°C increase in temperature resulted in a 7.49 kg 667 m-2 decrease in the maize yield,while the impact of temperature on the maize yield in northern China was insignificant. For every 1 mm increase in precipitation,the maize yield increased by 0.013 kg 667 m-2 in southern China and 0.066 kg 667 m-2 in northern China. (3) The resilience of the maize crop to climate change is strong. The marginal effect of temperature in both southern and northern China during the 1990-2016 period was smaller than that for the 1979-2016 period.
Keywords:climate change,maize yield,FGLS model,China
1.lntroduction
Agriculture is particularly sensitive to climate change (IPCC,2014). Climate change can greatly affect crop yields (Rayet al.2015),thereby influencing the supply of agricultural products,jeopardizing global food security,and leading to potentially serious socioeconomic consequences (Meerburget al.2009). The UN Intergovernmental Panel on Climate Change (IPCC) report states that extreme weather events are expected to occur globally,with greater frequency and severity in the temperate and tropical regions (Pachauriet al.2014). High temperatures,variable rainfall,floods,droughts,and cyclones associated with climate change increase the fragility associated with crop production and cause a significant decrease in global food production (Knoxet al.2012; Lobellet al.2013). In particular,as developing countries experience greater pressures associated with food security due to the limited use of adaptive technology and relatively weak supporting infrastructure,agricultural production in these regions is likely to be significantly affected by climate change (Wanget al.2010; Lobellet al.2011). Scientific knowledge regarding the impacts of climate change on crop yields can help farmers adjust their contingency strategies at the micro-level,reduce income risks,and support macro-level management decisions(Alberset al.2017). These measures are prerequisites to ensuring global food security and are necessary for providing information related to the development of adaptive strategies(Schmidhuber and Tubiello 2007). Therefore,understanding the effects of climate change on agricultural production has become a priority for governments,international institutes,and scientific research. Maize is an important staple food for human beings and a key feedstuff for animals; in addition,maize serves as a basic raw material for the manufacturing of thousands of industrial products worldwide.
In the past few decades,maize has become the largest product in the global cereal trade (FAO 2017). The stable production of maize is crucial for global food security and the development of many economies.
Previous studies have indicated the susceptibility of maize to climate change. Knoxet al.(2012) predicted a 5 and 16% reduction in African and South Asian maize yields,respectively,by 2050. In addition,global temperatures and solar radiation have been identified as the most important variables that influence maize yields in the southern,eastern,and northern regions of France (Ceglaret al.2016). In particular,negative correlations between maize yields and average seasonal temperatures have been observed for most of the major maize producers,including the United States,China,Brazil,and Africa,as well as for global aggregate production (Taoet al.2008; Sakuraiet al.2011). Empirical studies using daily weather data have identified the principal factor responsible for this negative correlation,which is the sensitivity of maize to extreme heat (defined here as consecutive days with temperatures greater than 30°C),in both temperate and tropical systems(Lobellet al.2013).
China is the second largest maize producer and the largest maize importer in the world (FAO 2017). The demand for corn for use as animal feed is increasing rapidly due to the increasing consumption of livestock products caused by the upgrading of civilian dietary structures. Therefore,maize production in China plays a key role in global supply and demand. A more comprehensive understanding of the effects of climate change on maize yield in China is therefore vital to both national and international economics and politics. It has also attracted tremendous scientific interest and has become the focus of many studies (Holstet al.2013; Taoet al.2016).
Crop simulation models and statistical models have been commonly used to investigate the effects of climate change on crop yields. Crop models are mainly based on specific physiological and ecological data,and simulations are used to evaluate the relationships between crop yields and climate change variables (Shiet al.2013). As experiments are carried out in specific locations,extensive sets of data are needed for large-scale simulations and data related to crop growth and development,soils,and agricultural economic management practices are required. Therefore,it is difficult to generate conclusive results at a regional scale (Folberthet al.2012). In addition,temperature effect simulations are problematic because temperatures,precipitation,and irrigation have different interactive effects at distinct temperature intervals (Schaubergeret al.2017). Conversely,the use of statistical models is a technical solution that has been increasingly adopted to evaluate the effects of climate variables on crop yields at a given spatial scale (Schlenker and Lobell 2010; Lobellet al.2011; Alberset al.2017). Several studies have shown that statistical models have a high explanatory power and are more effective for accurately evaluating data at a given spatial scale than approaches using simulation models(Lobell and Burke 2010; Leeet al.2013). In particular,panel data models allow for more robust analyses,and the errors associated with this model are small (Schlenker and Lobell 2010; Shi and Tao 2014). Statistical models have become an effective tool for studying the relationship between climate change and crops yields and are the preferred choice for analyzing the effects of climate change on maize crops in China over multiple years (Weiet al.2014; Zhou and Turvey 2014; Taoet al.2016; Chenet al.2017). However,traditional panel models such as pooled Ordinary Least Squares(OLS),fix effect models and random effect models make strong assumptions. They need to satisfy the assumptions that there is no group-wise heteroscedasticity,crosssectional correlation,and autocorrelation within panels of the stochastic disturbance term. Because the panel period required in climate change research is often long (exceeds 10 periods) to capture the historical trend,specific data requirements and existing studies using traditional panel models to estimate the impact of climate change on maize have failed to solve group-wise heteroscedasticity,crosssectional correlation,and autocorrelation within panels of the stochastic disturbance term,which has led to estimation bias (Wooldridge 2010). Therefore,it is necessary to use more effective models to overcome these limitations.
In this study,we applied a feasible generalized least square (FGLS) model to study the impacts of climate change on maize yields in China from 1979 to 2016. The specific objectives of this study were to:(1) find a more suitable model to solve group-wise heteroscedasticity,crosssectional correlation and autocorrelation within panels of the stochastic disturbance term; (2) investigate the influence of climate changes on maize yield and its spatial difference;and (3) identify the influence mechanism and provide policy recommendations for better adaption to climate change.
2.Data and methods
2.1.Study area
Maize is planted in China during spring and summer. As natural resource endowments vary significantly in different areas,four planting seasons were established for the 19 province-level units (called provinces below,including provinces,autonomous regions,and municipalities) included in study area (Fig.1). The planting season was from late April to late September for Shanxi,Inner Mongolia,as well as Liaoning,Jilin,and Heilongjiang. For Hebei,Jiangsu,Anhui,Shandong,Henan,and Hubei,it was from late May to late September. Guangxi,as well as Sichuan,Guizhou,and Yunnan,and Chongqing had their planting season from late May to mid-September,while Shaanxi and Gansu,as well as Ningxia and Xinjiang had their planting season from mid-April to mid-September (Liuet al.2019).
2.2.Data source and descriptive statistics
It is crucial to select the most serious factors affecting the maize yield,since an incorrect selection of factors may lead to estimation bias (Reidsmaet al.2007; Miaoet al.2015).According to previous studies (Shi and Tao 2014; Taoet al.2016; Chenet al.2020),the explained variable is the maize yield,and the explanatory variables mainly include inputs,regions,as well as meteorological variables such as temperature,rainfall,illumination,and radiation.
Maize yield data from 1979 to 2016 for the provinces analyzed in our study area were obtained from theChina StatisticalYearbook(National Bureau of Statistics of China 1979-2016). After 1997,Chongqing merged with Sichuan;therefore,the data obtained were averaged by the proportion of yield by province. After considering the adjustments based on provinces,19 data units were finalized in the model.
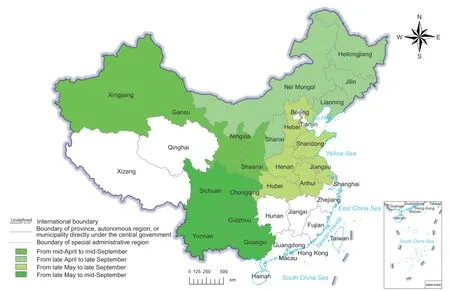
Fig.1 Map of the study area showing the 19 province-level units (including provinces,autonomous regions,and municipalities)included in the scope of our research. The four planting seasons for these regions are indicated by four shades of green.
Five input factors were used in this study for the 1979-2016 period,namely:fertilizers,seeds,pesticides,agricultural machinery power (defined as the investment of agricultural machinery,such as rental fees for agricultural machinery and machinery fuel consumption costs),and other inputs (defined as the aggregate of the remaining inputs,such as irrigation,manure,or animal power,i.e.,other animal inputs). These data were obtained from theChina AgriculturalProductCost-BenefitCompilation(National Development and Reform Commission 1979-2016).
The meteorological factors considered for the model were temperature and precipitation,and data for these factors were provided by the National Meteorological Information Center. The data were recorded daily from a total of 2 481 weather stations. The accuracy of statistical models depends on the spatial scale of the input data and the necessary scale of the output data (Lobell and Burke 2010). Therefore,all climate data sets were interpolated using kriging interpolation in a 4 km×4 km grid,rather than averaging data from the sites in the area. Average daily temperature and annual total precipitation were captured during the phenological period. The climate data were then aggregated to the provincial level with weights based on the harvested maize area (Monfredaet al.2008; Shi and Tao 2014).
Table 1 shows the descriptive statistics of the data. The results indicated a large difference between maize yield and precipitation. Therefore,it was necessary to control the heterogeneity of the different regions in our study.
The large data set was checked by running a stationarity test to ensure that the estimates were accurate,and then was interpreted using a regression method for the panel data. Data stationarity was examined using the proposed Levin-Lin-Chu (LLC) test (Levinet al.2002) and the Im-Pesaran-Shin (IPS) unit root test (Imet al.2003). The result of the LLC and IPS tests showed that all the variables were stationary.
2.3.Model specifications
The pooled OLS approach and fixed effect or random effect panel regression have been widely adopted in previous studies to evaluate the effects of climate change on crop yields (Youet al.2009; Weiet al.2014; Ceglaret al.2016).The stochastic disturbance regression term of OLS and traditional panel regression must be conformed to sphericaldisturbance perturbation assumptions. If there are groupwise heteroscedasticity,cross-sectional correlation,and autocorrelation within panels in the stochastic disturbance term,the use of the FGLS model would be preferable for the estimation of parameters by adjusting the stochastic disturbance term (Greene 2018). We conducted our study according to the flowchart in Fig.2.
In this study,the group-wise heteroscedasticity,crosssectional correlation,and autocorrelation were tested within the panels in the stochastic disturbance term. The group-wise heteroscedasticity was tested using the Wald test proposed by Greene (2018),the autocorrelation within the panels was tested using the Wald test proposed by Wooldridge (2010),and the cross-sectional correlation was tested using the Breusch-Pagan Lagrange multiplier (LM)proposed by Greene (2018) and Pesaran’s test proposed by Pesaran (2004). Table 2 shows the results of the Wald test,LM test and Pesaran’s test,which indicated the existence of group-wise heteroscedasticity,cross-sectional correlation,and autocorrelation within the panels,provided that OLS and traditional panel regression were used to analyze our data. Hence,the FGLS model was used to estimate the parameters by adjusting the stochastic disturbance term to achieve more efficient estimators.

whereydenotes the explained variable,which is maize yield in this study,andXis the vector of explanatory variables,which includes inputs,regions,and meteorological variables.X´ is the transpose ofX. The matrix ∑ is written in terms of the Kronecker product (eq.(2)):

wheremis the number of observations,andTiis the period of observation. The estimated variance matrix is obtained by substituting the estimator,,in place of Ω (eq.(3)):

Table 1 Descriptive statistics of the data obtained for the 1979-2016 period
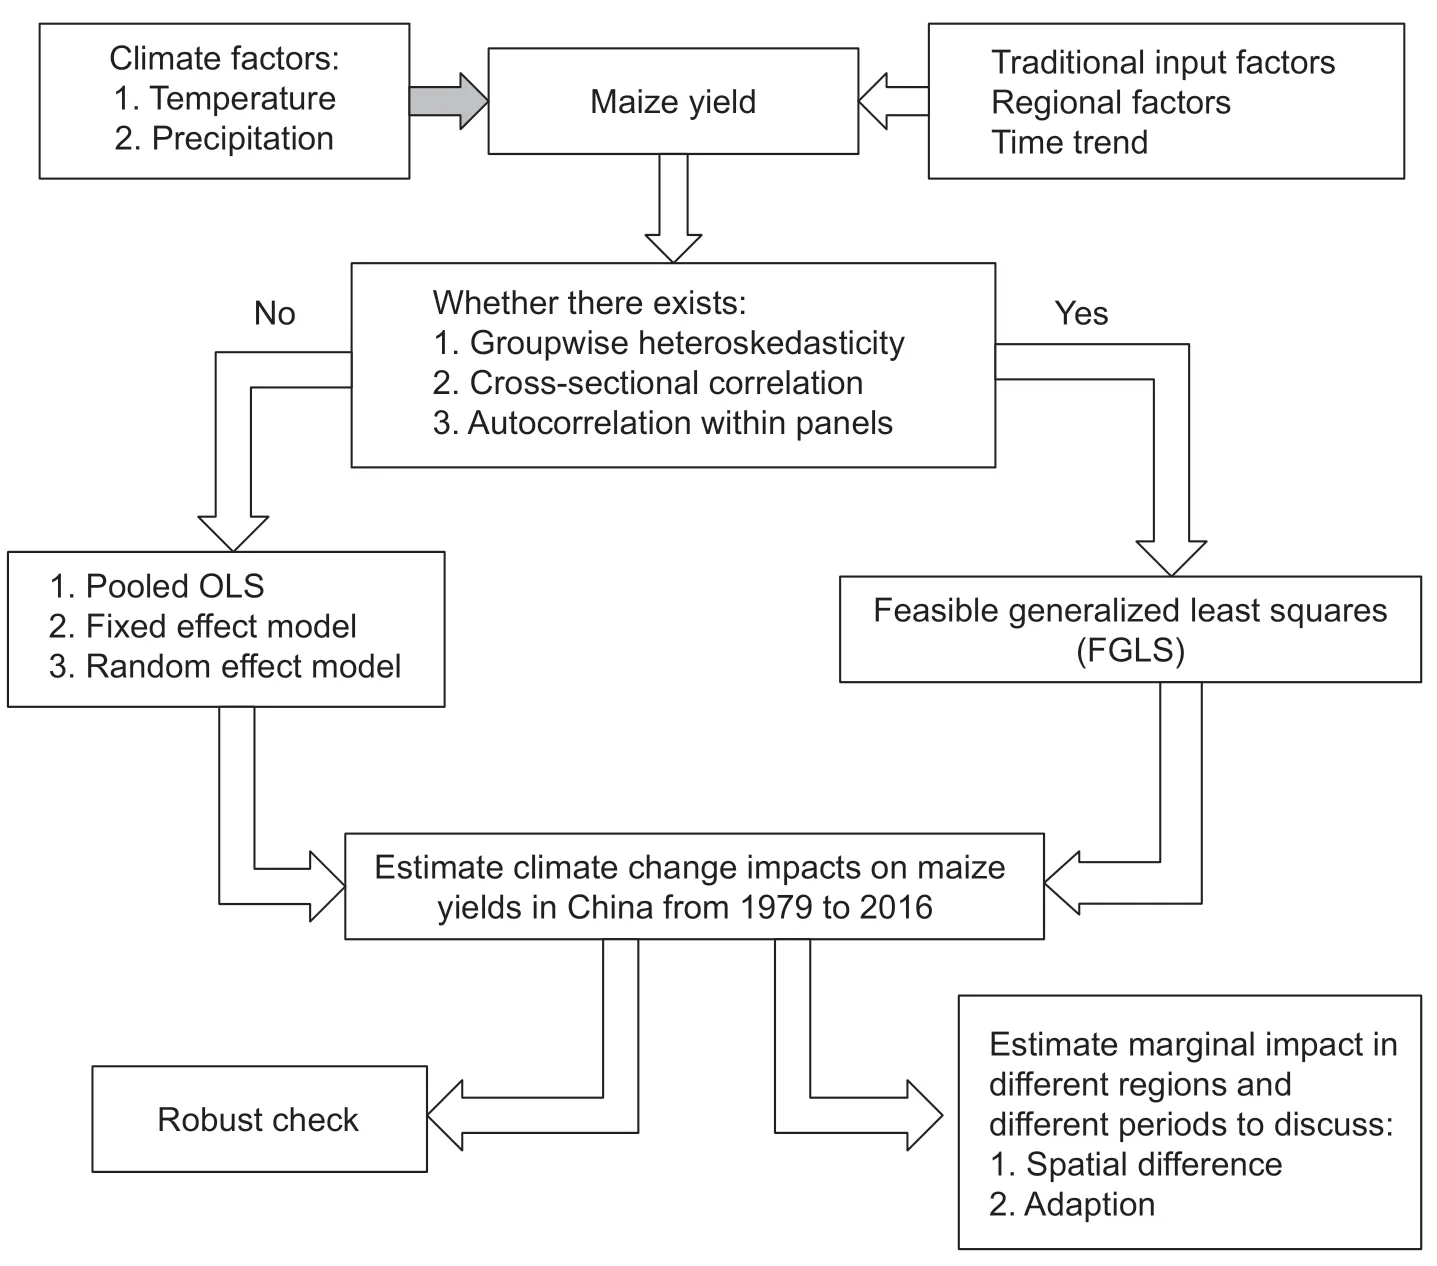
Fig.2 Flowchart of the methodology followed in this study.

Table 2 Test on group-wise heteroscedasticity,cross-sectional correlation and autocorrelation within the panels

Finally,panel-data models were fitted using FGLS. A Cobb-Douglas form of maize yield function was specified as eq.(4). These coefficients were estimated using eq.(1).

where ln is natural log,tdenotes observations from the years 1979 to 2016,idenotes theith province,and yieldi,trefers to the maize yield for the Chinese provinceiat timet(from 1979 to 2016). Thetemperaturei,tandprecipitationi,trepresent temperature and precipitation,the two major climatic factors affecting maize growth. The five control variables indicate the conventional inputs per hectare of sown maize,including seeds,fertilizer,pesticide,machinery,and other inputs. Taking the existence of time fixed effects into consideration,trendindicates the time trend (1 to 38).In the model,regional fixed effects were controlled based on the provinces,andDpwas used as the dummy variable for the 19 major maize-producing provinces.
To facilitate understanding,we estimated our coefficients using eq.(5),which can be used to evaluate the marginal effect of changing climatic factors on maize yield rates:

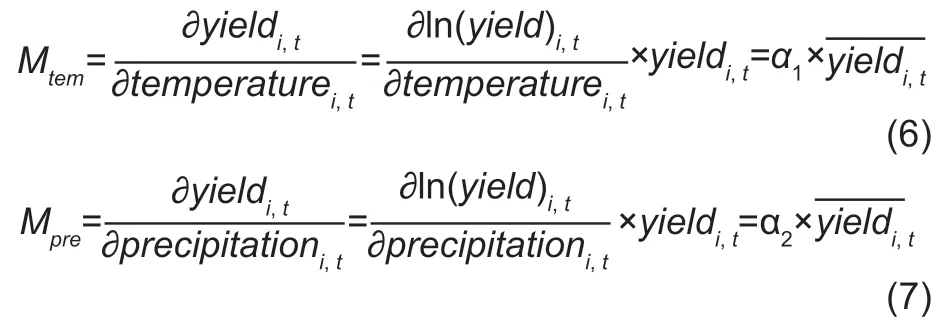
The partial derivative of both sides of eq.(5) with respect to climatic factors was determined to calculate the marginal effect of temperature and precipitation on crop yield. From this calculation,we established that the rate of change in maize yields was caused by a temperature and precipitation increase of one unit,as shown in eqs.(6) and (7):
3.Results and discussion
3.1.lmpacts of climate change on the maize yields
We used the FGLS method to adjust the group-wise heteroscedasticity,cross-sectional correlation and autocorrelation within the long panels in the stochastic disturbance term. Table 3 shows the estimation results of model (1) including the input factors and model (2)including the input and climatic factors,which both used the Cobb-Douglas logarithmic model. Most of the estimated coefficients related to input and climatic factors were proved to be statistically significant.
Model (1) indicated that,with the exception of the other inputs category,all the coefficients of the input factors were significant at the 1% level. Utilizing the climatic factors calculated by harvesting the area-weighted averages allowed us to focus on the climatic factors affecting the maize belt (Shi and Tao 2014; Youet al.2014). Therefore,we mainly analyzed the estimators in model (2),whose climatic factors were calculated by harvesting area-weighted averages at the provincial level.
According to our estimation,the maize yield in China is extremely sensitive to temperature and precipitation changes. By controlling the traditional input factors,we established that for every 1% increase in temperature,the maize yield decreased by 0.398%. Precipitation showed a positive correlation with crop yield,and every 1% increase in precipitation increased the maize yield by 0.105%. It was also observed that the elasticity in precipitation was lower than in temperature. This is due to the use of groundwater irrigation in many maize-producing areas in China.
From eq.(5),we determined coefficient values of α1=-0.017 and α2=0.00014. As the average yield was 305.2 kg 667 m-2in study area for the 1979-2016 period,an average temperature increase of 1°C during the growing seasons led to a maize yield reduction of 5.19 kg 667 m-2,and an average precipitation increase of 1 mm resulted in a maize yield increase of 0.043 kg 667 m-2.
The long-term trend line of national average temperatures in China shows that the temperature increased by 1.15°Cfrom 1979 to 2016,which corresponds to a 5.36%temperature increase for that time period (Fig.3-A).Based on the results of our model,the elastic coefficient of the maize yield with regard to temperature was -0.398.Temperature changes resulted in a 2.13% decrease in the maize yield. On the contrary,the average precipitation level was steady (Fig.3-B) with an increase of less than 0.1%,which had a negligible effect on the maize yield.
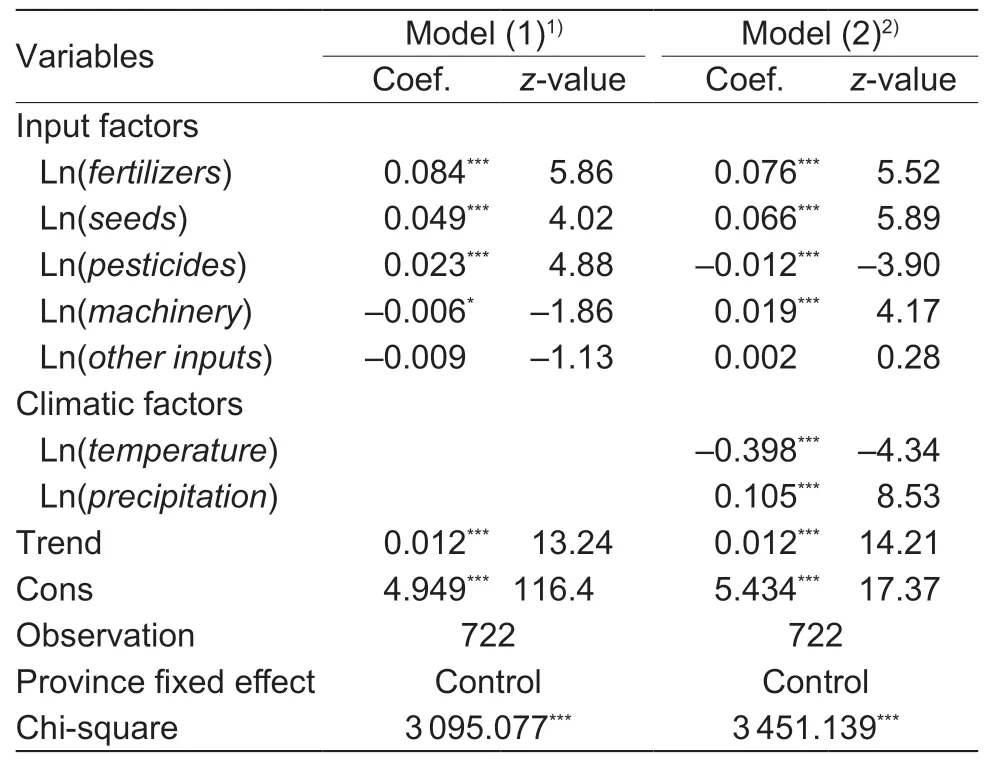
Table 3 The feasible generalized least square (FGLS) model estimation results showing the impact of input and climatic factors on maize yield
As for the long-period panel data,FGLS could be used to solve the group-wise heteroscedasticity,cross-sectional correlation and autocorrelation within the panel,to ensure a more accurate result. The results of this paper showed that the impact of the temperature rise on the maize yield at a national level was negative. Our results agreed with previous studies (Weiet al.2014; Zhou and Turvey 2014;Chenet al.2016; Liuet al.2020). The temperature elasticity value obtained for our results was between the values reported by Zhou and Turvey (2014) and Weiet al.(2014),while the value obtained for precipitation elasticity was very similar to the results reported by Zhou and Turvey (2014).However,compared with the results of Xinet al.(2013),the temperature elasticity showed the opposite trend,which may be caused by the difference in input data sources for the two studies. Maize is heat tolerant. Although water is important for maize yield,irrigation is an effective means of adaptation (Kanget al.2017). Improving irrigation weakens the sensitivity of corn to climate change (Zhou and Turvey 2014),so the impact of increasing precipitation on maize yield was less significant than that of temperature in our study.

Fig.3 Temperature and rainfall trends in China from 1979 to 2016. The dotted line indicates the trend line.
The probability of a future increase in temperature in China is highly likely as the effects of climate change continue to intensify (Cuiet al.2018). More significant annual fluctuations in rainfall are expected,and the frequency and extent of agricultural droughts will increase.Farmers will need to implement a series of adaptation measures,such as controlling and adjusting input materials,changing the sowing time,optimizing middle-late maturing varieties,improving irrigation systems,etc.,to help reduce the potential adverse effects of future climate change on agricultural crop yields.
With regard to the input factors,namely fertilizers,pesticides,and seeds,a positive correlation was observed at the 1% level of significance. An unexpected negative correlation existed between agricultural machinery and maize yield,which was close to zero. A possible reason for this correlation is the reduced price of maize compared to wheat in China. According to theChina Agricultural Product Cost-Benefit Compilationof 2017 (National Development and Reform Commission 1979-2016),the expense of wheat machinery in 2016 was 133.16 CNY,while the expense of maize machinery was only 114.43 CNY. Therefore,this result is insignificant for this study.
3.2.Spatial difference and adaption
Spatial differenceTo explore the impact of climate change on different regions,we used the FGLS model (eq.(4)) to estimate the impact of climate change on maize yield in two different geographical regions (southern China and northern China),respectively. The two geographical regions were divided by the Qinling-Huaihe-Line. The Qinling-Huaihe-Line is the north-south geographic segmental line of China,which consists of the Qinling Mountain and the Huaihe River. It also donates the 0°C isotherm in January and the annual 800 mm isohyets,so the climate for maize growth is completely different on either side of the line (Lianget al.2014). The southern area includes the Henan,Hubei,Yunnan,Sichuan,Guizhou,Jiangsu,and Anhui provinces as well as and the Guangxi Zhuang Autonomous Region.The northern area includes the Shandong,Shanxi,Hebei,Shanxi,Gansu,Liaoning,Jilin,and Heilongjiang provinces as well as the Autonomous Regions of Ningxia Hui,Xinjiang Uyghur,and Inner Mongolia.
In Table 4,model (3) and model (5) indicated a significant spatial difference for the impact of climate change on maize yield from 1979 to 2016. For every 1% increase in temperature,the maize yield decreased by 0.549% in southern China from 1979 to 2016. In northern China,the decrease in maize yield during this period was 0.207% with a smallerz-value,and the coefficient was not statistically significant. Precipitation increase of 1% from 1979-2016 caused a 0.053 and 0.133% increase in the maize yield in southern and northern China,respectively.
Using eqs.(6) and (7),we also calculated the subprovincial and sub-temporal marginal effect of climate change factors on maize yield (Fig.4). An average temperature increases of 1°C during the growing season reduced the maize yield by 7.49 kg 667 m-2,while a 1 mm increase in precipitation resulted in a 0.013 kg 667 m-2increase in the maize yield in southern China from 1979 to 2016. The coefficient of temperature in northern China was insignificant from 1979 to 2016,but for a 1 mm increase in precipitation,the maize yield increased by 0.066 kg 667 m-2.
Our results indicate that the rising temperature had varying impacts on maize yields in different provinces in China. Southern China experienced a more negative impact on maize yield compared to northern China,which is consistent with the observations made by Yanget al.(2017).Northern China are located at relatively high latitudes and the average temperatures are lower. Consequently,there is a higher demand for increased temperatures in these regions to maximize maize crop yields. This is becausecurrent temperatures are not high enough for optimal photosynthesis in these areas. In the lower latitude areas,the filling stage is shorter and there are increased levels of plant respiration as well as elevated night temperatures. As a result,the period for dry matter accumulation is shortened and increasing temperatures in the southern region disrupts the maize growth (Chenet al.2020). Therefore,the negative impact of temperature rise in the northern area is less significant than in the southern regions. The statistical results from 1990 to 2016 are positive in northern China,and are related to the geographical difference that exists between the northern and southern regions of the country.This observation is consistent with Chenet al.(2011) and Zhang and Huang (2013).

Table 4 Sub-regional and sub-temporal results estimated by FGLS model in different ares and time periods in China

Fig.4 Sub-provincial and sub-temporal marginal effect of temperature and precipitation on maize yield. *,0.10 level of statistical significance; **,0.05 level of statistical significance; ***,0.01 level of statistical significance. All climate factors were calculated by harvesting area-weighted averages at the provincial level.
Precipitation was lower in the northern areas and as a result,water resources were lacking. Precipitation was significant at the 1% level and had a positive impact on maize yields. In terms of increasing precipitation,the positive impact in the northern regions was more significant than in the southern regions. This may be due to the reduced rainfall experienced in northern China compared to southern China,where frequent drought is an important factor influencing agricultural development. Previous research also showed that increasing precipitation positively impacted the maize yield in northern China (Liuet al.2020).
Adaption to climate changeWe attempted to explore whether maize farming was able to adapt to rising temperatures over time. Hence,the marginal effect from 1990 to 2016 was also estimated using model (4) and model (6),as shown in Table 4. For southern China,the coefficients of temperature and precipitation from 1990 to 2016 were smaller than from 1979 to 2016. The coefficient of temperature from 1979 to 2016 and from 1990 to 2016 in northern China was insignificant,but the coefficient from 1990 to 2016 became positive. As for precipitation,it remained almost constant during the observed time period. Further,we explored the impact on different periods (Fig.4). From 1990 to 2016,the average temperature in southern China increased by 1°C,and the maize yield decreased by 4.95 kg 667 m-2. For every 1 mm increase in precipitation in southern China,the maize yield increased by 0.008 kg 667 m-2. In northern China,no significant impact of temperature on the maize yield was observed,however,every 1 mm increase in precipitation resulted in a 0.072 kg 667 m-2increase in the maize yield.
Several researchers have suggested that maize farming can adapt to temperature changes (Butler and Huybers 2013; Taoet al.2016). Our results showed that the margin effect of rising temperature from 1990 to 2016 is smaller than that from 1979 to 2016,which implies that both southern China and northern China are able to adapt to the effects of expected climate change. Examples of adaptation techniques that can be implemented are the introduction of temperature-resistant maize crops and the use of different irrigation techniques.
The impact of precipitation during the two analyzed time periods decreased in the southern regions. Although there was more rainfall in the south during these periods,the reduction of the coefficient showed that adaptive strategies have already been implemented. Agriculture in northern China is more dependent on rainfall and this region experiences more serious agricultural drought than the southern regions (Yanget al.2020). No obvious adaptive improvement measures have been implemented in northern China to combat the negative effects of climate change,and the impact remains the same.
3.3.Robust check
To validate the results obtained from FGLS,alternative estimation methods following eq.(5) were used,including a pooled OLS,fixed effect regression model and random effect regression,which cannot solve groupwise heteroscedasticity,cross-sectional correlation,or autocorrelation within panels (Table 5). For robustness,we displayed the results and compared them with those obtained from FGLS.
The validation of our results indicated the existence of a relationship between climatic factors and the maize yield.Because there existed group-wise heteroscedasticity,crosssectional correlation,and autocorrelation within the panels estimated by traditional regression,the result of the FGLS model provided more accurate estimations than traditional regression models.
4.Conclusion
Our study explored the impacts of climate change on maize yields in China using the FGLS model. The results showed that during the 1979-2016 period in China,temperature negatively impacted the maize yield,and precipitation was found to have a positive but overall negligible impact. In addition to contributing information towards the conception of agricultural adaptive strategies,the findings of this study will facilitate a better understanding of the impacts of climate change on maize yields,and provide a reference for reducing the yield fluctuations and ensuring crop safety in China. These predicted results can help rural farmers toplan and adapt to cope with the impacts of climate change in the future.
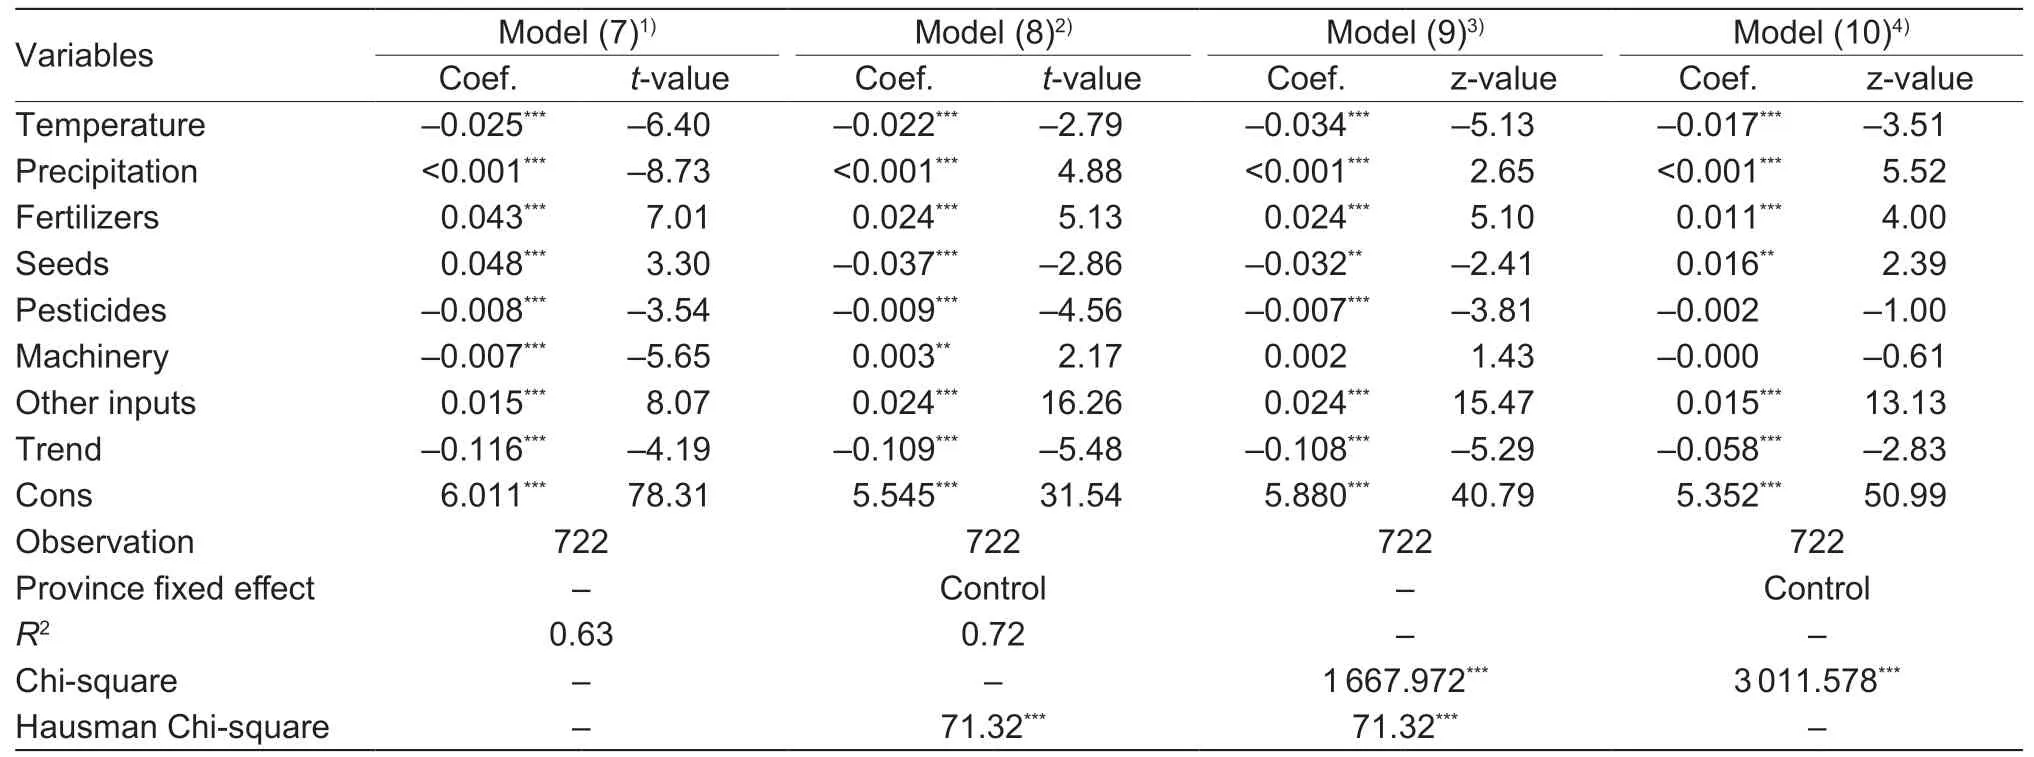
Table 5 The impacts of climatic and input factors on maize yield estimated using different models
Acknowledgements
This research was funded by the National Natural Science Foundation of China (71703159),the Central Public-interest Scientific Institution Basal Research Fund,China (YBYWAII-2019-08,YBYW-AII-2020-08 and JBYW-AII-2020-52)and the Agricultural Science and Technology Innovation Program of Chinese Academy of Agricultural Sciences(CAAS-ZDRW202012).
杂志排行
Journal of Integrative Agriculture的其它文章
- The dynamic impact of income and income distribution on food consumption among adults in rural China
- Driving factors of direct greenhouse gas emissions from China’s pig industry from 1976 to 2016
- ATP regulates the phosphorylation and degradation of myofibrillar proteins in ground ovine muscle
- Use of two-stage dough mixing process in improving water distribution of dough and qualities of bread made from wheatpotato flour
- Estimating daily actual evapotranspiration of a rice-wheat rotation system in typical farmland in the Huai River Basin using a two-step model and two one-step models
- Optimization of water and nitrogen management for surge-root irrigated apple trees in the Loess Plateau of China
