Estimating daily actual evapotranspiration of a rice-wheat rotation system in typical farmland in the Huai River Basin using a two-step model and two one-step models
2021-12-14LlMengCHURonghaoAbuRezaMdTowfiqullSLAMJlANGYuelinSHENShuanghe
Ll Meng ,CHU Rong-hao,Abu Reza Md.Towfiqul lSLAM,JlANG Yue-linSHEN Shuang-he
1 School of Resources and Environment,Anhui Agricultural University,Hefei 230036,P.R.China
2 Hefei Scientific Observing and Experimental Station of Agro-Environment,Ministry of Agriculture and Rural Affairs,P.R.China
3 Anhui Public Meteorological Service Center,Anhui Meteorological Bureau,Hefei 230031,P.R.China
4 Department of Disaster Management,Begum Rokeya University,Rangpur 5400,Bangladesh
5 Key Laboratory of Meteorological Disaster,Ministry of Education (KLME)/Joint International Research Laboratory of Climate and Environment Change (ILCEC)/Collaborative Innovation Center on Forecast and Evaluation of Meteorological Disasters (CICFEMD)/Jiangsu Key Laboratory of Agricultural Meteorology,College of Applied Meteorology,Nanjing University of Information Science & Technology,Nanjing 210044,P.R.China
Abstract The objective of this study is to evaluate the performance of three models for estimating daily evapotranspiration (ET) by employing flux observation data from three years (2007,2008 and 2009) during the growing seasons of winter wheat and rice crops cultivated in a farmland ecosystem (Shouxian County) located in the Huai River Basin (HRB),China. The first model is a two-step model (PM-Kc); the other two are one-step models (e.g.,Rana-Katerji (R-K) and advection-aridity (AA)).The results showed that the energy closure degrees of eddy covariance (EC) data during winter wheat and rice-growing seasons were reasonable in the HRB,with values ranging from 0.84 to 0.91 and R2 of approximately 0.80. Daily ET of winter wheat showed a slow decreasing trend followed by a rapid increase,while that of rice presented a decreasing trend after an increase. After calibrating the crop coefficient (Kc),the PM-Kc model performed better than the model using the Kc recommended by the Food and Agricultural Organization (FAO). The calibrated key parameters of the R-K model and AA model showed better universality. After calibration,the simulation performance of the PM-Kc model was satisfactory.Both the R-K model and AA model underestimated the daily ET of winter wheat and rice. Compared with that of the R-K model,the simulation result of the AA model was better,especially in the simulation of daily ET of rice. Overall,this research highlighted the consistency of the PM-Kc model to estimate the water demand for rice and wheat crops in the HRB and in similar climatic regions in the world.
Keywords:daily evapotranspiration,crop coefficient,crop water demand,rice-wheat rotation system,Huai River Basin
1.lntroduction
The farmland ecosystem is a major subsystem of the agricultural ecosystem,which is not only restricted by natural conditions but also affected by human activities. Water is an important environmental factor for crop growth. The water cycle,including precipitation,runoff and evapotranspiration,is closely related to the water conditions of farmland.Evapotranspiration (ET) is the main form of water transfer in the soil-plant-atmosphere system and is an important part of the water cycle and energy balance in the farmland ecosystem. Most agricultural water will be returned to the atmosphere through the ET process (Yanget al.2014). Therefore,accurate measurement of ET is of great importance in water resource planning and management practices,field irrigation and the environmental assessment of agricultural regions (Tabariet al.2012; Wenet al.2015).
Currently,many advanced instruments have been applied to directly measure or indirectly estimate ET at the field scale,such as the eddy covariance (EC) system,Bowen ratio equipment (BRE),large aperture scintillometer (LAS)and weighing lysimeter (WL). Previous studies also showed that these high-precision instruments can obtain reliable ET data after calibration and correction (Zhanget al.2008;Chavezet al.2009; Dinget al.2010; Yanget al.2011; Uddinet al.2013),which can be applied to quantify regional-scale ET (Twineet al.2000). The aforementioned methods do not affect crop growth,can measure crop ET continuously and have been widely used in various ecosystems. However,many restrictions exist,such as high requirements for labour,material resources,time and money; missing data caused by the weather and instrument problems; and a cumbersome data processing process. Therefore,it is particularly desirable to adopt empirical models to estimate the field ET.
The Penman-Monteith formula is recognized as a reliable model. Doorenbos and Pruitt (1977) first defined reference crop ET (ETref) as the ET of a wide grassland with 8-15-cm high uniform normal growth,completely covering the ground and with adequate water supply. Allenet al.(1998) further elaborated on the concept of ETref,which was defined as the ET of an ideal crop with a fixed surface resistance of 70 s m-1,an albedo of 0.23 and a height of 12 cm. In practical application,the ETrefcan be multiplied by the corresponding crop coefficient (Kc) to obtain the actual ET of a certain crop. Due to this model operating in two steps,some scholars defined this method as a two-step model or PM-Kcmodel. However,this method requires higher-precision meteorological data and accurate crop coefficients,which limits its application on a regional scale. Katerjiet al.(1983) proposed a simple canopy resistance model that,after local calibration,can estimate crop canopy resistance accurately,which is a relatively complex and critical parameter in the simulation of actual evapotranspiration (ETa) by the Penman-Monteith model.Ranaet al.(1993) verified the model on grassland and obtained good results. Ranaet al.(1997) applied this canopy resistance model to the simulation of the actual ET of soybeans under water stress and found that this model could obtain reasonable simulation results under different water conditions and at different time scales. Then,Rana and Katerji (2009) combined the Penman-Monteith formula with this simple canopy resistance model and obtained a new actual ET model with high robustness,abbreviated as the R-K model.Moreover,based on the feedback mechanism between ETaand potential ET (ETp),Bouchet(1963) initially proposed the complementary relationship(CR) theory,which has been widely applied to estimate ETa. The CR theory simplifies the estimation method of ETaand makes it possible to estimate ETawith fewer observed meteorological variables. Based on many advantages of CR theory,three main models have been developed,namely,the AA (advection-aridity) model (Brutsaert and Stricker 1979),GG (Granger-Gray) model (Granger and Gray 1989) and CRAE (complementary relationship areal evapotranspiration) model (Morton 1983). Among these models,the AA model has certain advantages,requiring less input of meteorological parameters and using a relatively simple algorithm. Compared with the GG and CRAE models,this model can obtain more accurate ETaestimation results not only on a regional scale (Wanget al.2011; Gaoet al.2012) but also on a field-scale (Liuet al.2012; Chuet al.2019). Compared to the PM-Kcmodel,the R-K and AA models can be regarded as one-step models.
In previous studies,some scholars had used the above three models to simulate the ET of different crops. Shiet al.(2008) adopted the Katerji-Perrier (KP) model to estimate the ET of forest in the Changbai Mountains in northeastern China and demonstrated that the KP method was preferred to estimate half-hourly ET. The applicability and stability of the Penman-Monteith equation and R-K model for predicting the ET from winter wheat and summer maize fields were analysed in the North China Plain. It was indicated that the revised R-K model performed better than the FAO-PM model (Wanget al.2016,2017). Liuet al.(2012) reported that the AA model performed better than the KP model both for maize and for canola crops in southeastern Australia.Wanget al.(2018) argued that the two-step model performed better than the one-step model in calculating daily ET in a semi-humid and drought-prone region of northern China.Among the above studies,it is evident that the performance of the FAO-PM model is not as good as that of other models.Whether this evidence can be confirmed in eastern China is rarely explored. In addition,due to the limited data,the calibration and validation of key parameters in each model also deserve further investigation.
The Huai River Basin (HRB) is an important agricultural and grain production base in eastern China,and the farmland water cycle plays an important role in limited water resource practices in this region. In addition,agricultural drought often occurs in this region,and the problem of water supply and demand is prominent in drought years,greatly challenging agricultural production (Gaoet al.2019). Winter wheat and rice crops are staple food grains in the HRB;therefore,it is crucial to reveal the characteristics of ET and predict it accurately,especially for the rational utilization of water resources and the study of field irrigation. Currently,in addition to the large-scale estimation and quantitative study of surface ET (Liet al.2018a,b,c; Chuet al.2019),it is also necessary to further analyse the ET characteristics of typical farmland ecosystems in the HRB and determine a suitable empirical ET model for the farmland scale. However,little is known about this. Hence,this research fills the knowledge gaps in the HRB in eastern China.
As mentioned above,we mainly pose the following scientific questions:1) Is the energy closure of the ricewheat rotation system in the HRB reasonable? 2) In the two-step model,does theKcrecommended by the FAO apply to the HRB and can the key parameters of the two onestep models be calibrated? 3) How do the three calibrated models perform in the simulation of field ET in the HRB?Thus,the objectives of this study are:(1) to evaluate the energy closure of EC data in the rice-wheat rotation system of the HRB; (2) to examine the variations in the daily ET of winter wheat and rice; (3) to calibrate and verify the key parameters of the three typical models (PM-Kcmodel,R-K model,and AA model) by employing three years of flux observation data among two growing seasons of winter wheat and rice crops; and (4) to evaluate the performances of the three models and determine the best ET estimation model suitable for the rice-wheat rotation system of the HRB. It is anticipated that the outcomes of the study will provide reasonable reference and scientific guidance for farmland water management and irrigation scheduling in the HRB.
2.Materials and methods
2.1.Study area and data sources
Shouxian County (116°46´E,32°33´N),located on the south bank of the middle reach of the Huai River,China,has a farmland ecosystem in a sub-humid region. The planting system of Shouxian is mainly rice-wheat rotation with annual double cropping. The Shouxian National Climatology Observatory is one of the five major climate observatories in China (Tianet al.2011). This observatory was selected by the China Meteorological Administration as a field scientific experiment base for typical farmland ecological meteorology in the HRB. This base has carried out long time-series continuous observation of water,heat and carbon flux,meteorological elements and crop biomass in the near-surface layer of typical ecological areas of rice and wheat rotation since 2007. A flux tower located here has a total height of 32 m. The underlying surface is an open,flat and even farmland with no pollution source or high-rise buildings around. In this study,flux data,gradient data and conventional meteorological element observation data from the national climatology observatory in Shouxian County,Anhui Province,from 2007 to 2009 were selected to estimate the ET of the farmland ecosystem of winter wheat and rice in this region. Specific data processing processes can be found in the literature of Tianet al.(2011).
2.2.Energy balance evaluation and field ET calculation
The balance equation of each energy component of the ecosystem obtained by the eddy covariance and the net radiation balance observation system can be expressed as follows:

whereLEis the latent heat flux;His the sensible heat flux,and the sum of these two parameters can be abbreviated as turbulent flux;Rnis the net radiation flux;Gis the soil heat flux;Sis the canopy heat storage; andQis the sum of additional energy source sinks. Since theQvalue is small and usually negligible,Rn-G-Scan be abbreviated as effective energy. When the difference between turbulent flux and effective energy is 0,the state is called energy balance.SinceSis generally less than 5% ofRn,the influence ofSon the effective energy can be ignored (Tong and Tian 2009;Tianet al.2011). Then,the above energy balance equation can be abbreviated as:

In this study,the energy balance ratio was adopted to calculate the capacity closure degree of the rice-wheat rotation system,namely,the ratio between the turbulent flux(LE+H) and the effective energy (Rn-G) directly observed by the eddy covariance instrument. The specific formula is:
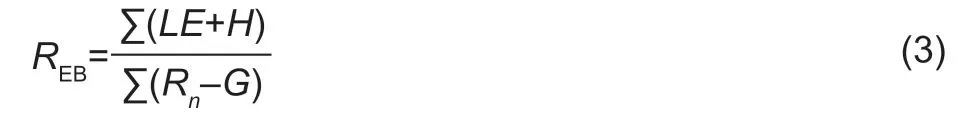
where units of the above variables are W m-2.
The data frequency measured by the above eddy covariance system is 10 Hz,the half-hour mean data set of the latent heat flux (LE,W m-2) was processed by removing outliers and interpolating missing data,and the corresponding ET data (mm h-1) was obtained after unit conversion (Maet al.2015). The specific conversion formula is as follows:

whereLEis the latent heat flux (W m-2),λis the latent heat of vaporization (2.45 MJ kg-1),and the final daily ET (mm d-1) is obtained by summing the ET per half hour.
2.3.PM-Kc model
Under the standard planting condition,the actual ET can be obtained by multiplying the reference evapotranspiration by the crop coefficient developed by Allenet al.(1998):

where ETais the actual ET of crops (mm d-1),Kcis the crop coefficient,and ETrefis the reference crop ET (mm d-1).Among them,Kcneeds to be calibrated according to actual local planting conditions.
2.4.R-K model
The Penman-Monteith model is a combined model based on dynamics theory and energy balance in which the influence of meteorological conditions and the characteristics of the crop canopy are all taken into consideration. Therefore,it is widely used in the estimation of crop ET. One of its most widely used forms is as follows (Allenet al.1998):

whereλis the latent heat of vaporization of water (2.45 MJ kg-1),Δ is the slope of curve (kPa °C-1) when the saturated water vapor pressure is at air temperatureTa(°C),andRnis the net radiation flux on the crop surface (W m-2),Gis soil surface heat flux (W m-2),ρis air density (kg m-3),cpis specific heat capacity of air constant pressure (1.013×10³J kg-1°C-1),esandeaare saturated water vapor pressure and actual water vapor pressure (kPa),respectively,rais aerodynamic resistance (s m-1),andrcis crop canopy resistance (s m-1).
radescribes the interaction between the crop canopy and atmospheric interface during water vapor transport,which is a function of wind speed and vegetation height (Ranaet al.2001):

whereuzis the wind speed ofzmeters (m s-1),zis the height measured by wind speed (wherez=2 m),d,z0andhare zero plane displacement,roughness length of controlling momentum transfer and crop canopy height,respectively.The relationship between them is:d=0.67h,z0=0.1h,andkis Von Karman constant with a value of 0.4.
Canopy resistance is a virtual physical quantity,which represents the comprehensive effect of stomatal impedance of leaves in different layers,soil moisture status and canopy aerodynamics characteristics on the whole canopy ET(Zhaoet al.2015). Katerjiet al.(1983) stated that canopy resistance was not constant but variable and proposed a model for canopy resistance:

whereaandbare empirical parameters determined by observation and experimental data,r*is critical resistance(s m-1),and the specific calculation formula is as follows:

Based on eqs.(6),(8) and (9),the actual ET calculation model of crops can be obtained:

The daily ET of crops can be obtained by summing up the ET of crops in a half hour. The actual ET of crops can be calculated through the above formula. The empirical parametersaandbshould be calibrated by experiment before use (Liuet al.2012).
2.5.AA model
The complementary relationship theory proposed by Bouchet (1963) can be expressed as the following formula:

where ETpis the potential ET,ETwis the ET under a humid environment,ETais the actual ET,andmis an empirical parameter. Brutsaert and Stricker (1979) defined ETpand ETwand pronounced that the excess of ETpand the insufficiency of ETawere indicators for air aridity,which is related to regional advection. Thus,this method is called the “advection-aridity (AA)” model. In the AA model,the calculation formulas of ETpand ETware as follows (Xu and Singh 2005):
whereΔis the saturation vapor pressure slope (kPa °C-1)of the average air temperature (Ta,°C) with 2 m above the ground,Rnis the net radiation flux (W m-2),Gis the soil heat flux (W m-2),γis the psychrometric constant (kPa °C-1),λis the latent heat of vaporization (J kg-1),es-eais the saturated vapor pressure deficit (kPa),nis the empirical parameter,ETradis the radiation term in ETp,and f(u2) is a function of the mean wind speed at 2-m height (Xu and Singh 2005).The specific calculation formula is as follows:

By substituting eqs.(12)-(14) into eq.(11),the expression of the AA model can be obtained as follows:

The empirical parametersmandnshould be calibrated by experimental data.
2.6.Determination of the empirical coefficients in R-K and AA models
Based on the ET data and the meteorological data observed in the growing season of winter wheat and rice fields from 2007 to 2009,the optimal empirical parametersaandbin the R-K model andmandnin the AA model suitable for each growing season of winter wheat and rice were determined by a non-linear fitted method using 1stOpt Software (http://www.7d-soft.com/).
2.7.Model performance evaluation
In this study,three statistical methods,namely the root mean square error (RMSE),mean absolute error (MAE)and Nash-Sutcliffe (NS) coefficient,were used to evaluate performance of three typical models (Mallikarjunaet al.2014; Samaraset al.2014),as follows:

3.Results
3.1.Energy closure analysis of EC data
To evaluate the energy closure of winter wheat and rice fields in the typical farmland ecosystem in the HRB,the outliers of the data were removed. Combined with eq.(3),the energy closure of the corresponding crop in the growing season was calculated (Table 1). As seen from Table 1,the energyclosure of winter wheat in two growing seasons was 0.91 and 0.87,andR2values for both seasons were 0.78; however,the energy closure of rice in two growing seasons was 0.84 and 0.85,slightly lower than that of winter wheat,andR2was 0.80 and 0.81,respectively. The above phenomenon indicates that the energy closure degree of winter wheat and rice in the growing season fluctuates slightly,and the overall closure degree is suitable.

Table 1 Energy closure (REB),determination coefficient (R2)and sample size (n) in winter wheat and rice growing seasons
3.2.Variation in daily ET
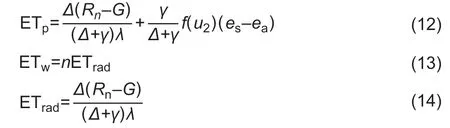
The unit conversion was carried out for 48 daily 30-min latent heat fluxes in the growing season of winter wheat and rice from 2007 to 2009 using eq.(4),and then daily ET was obtained by summing them. As shown in Fig.1-A and B,the daily ET of winter wheat showed a slow decrease before a rapid increase. Precipitation is mainly concentrated during the middle and late growth of winter wheat,and the ETaand ETrefhave similar trends. In the early growth stage of winter wheat,the ETrefis generally larger than the ETa. As shown in Fig.1-C and D,the daily ET of rice presented a trend of increasing first and then decreasing with fluctuation,and precipitation is mainly concentrated during the early and middle stages of rice growth. Similar to winter wheat,the ETaand ETrefhave similar trends,but the difference in the rice-growing season is indistinguishable.
3.3.Calibration of model parameters
Determination of crop coefficients in the PM-Kc modelEq.(5) was used to calculate the daily crop coefficients of each growing season. As shown in Fig.2-A and B,the daily crop coefficients of winter wheat showed a trend of“first decreasing,then increasing and decreasing”. To further determine and calibrate the crop coefficient (Kc) of the winter wheat growing season,the growth period of winter wheat was divided into five stages,namely,initial stage (seedingtillering),wintering stage (tillering-reviving),development stage (reviving-jointing),middle stage (jointing-milk-ripe)and late growth stage (milk-ripe-maturity). As shown in Table 2,the crop coefficients of winter wheat from 2007 to 2008 were similar in the initial and wintering stages,with values of 0.62 and 0.65,respectively. Then,theKcgradually increased,reaching 0.83 and 1.03 at the development stage and the middle stage,respectively,and changed slightly at the middle development stage; finally,Kcdecreased to 0.90 in the late growth stage. During the winter wheat growing season in 2008 to 2009,the overall trend ofKcwas similar to that from 2007 to 2008. The average crop coefficient was only 0.49 during the wintering stage but higher in the development stage with a value of 0.95,thenKcreached the maximum value of 0.99 in the middle stage and decreased to 0.85 in the late growth stage.
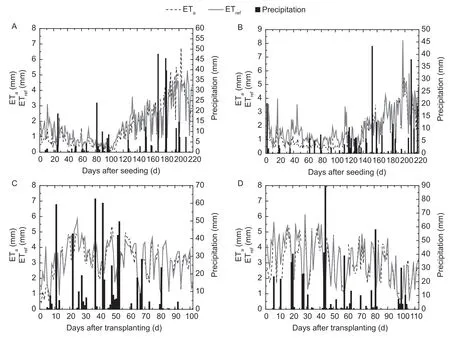
Fig.1 Variation characteristics of actual evapotranspiration (ETa),reference evapotranspiration (ETref) and precipitation during winter wheat (A,2007-2008; B,2008-2009) and rice (C,2008; D,2009) growing seasons.
As shown in Fig.2-C and D,different from that of winter wheat,theKcof rice did not have a significant tendency to vary during the growing season. To determine and calibrate theKcin the rice-growing season in this region,the rice-growing period was generally divided into four stages,namely,the initial stage (transplanting-tillering),development stage(tillering-jointing),middle stage (jointing-milk-ripe) and late growth stage (milk-ripe-maturity). As shown in Table 2,the averageKcvalues of rice at each growth stage in 2008 and 2009 were 0.64,0.92,0.98,0.98 and 0.78,0.92,1.03,1.01,respectively. The difference in the meanKcof rice among each growth stage is small. In the initial growth stage,the meanKcof rice in 2008 was smaller than that in 2009.
Determination of the empirical coefficients in R-K modelAs shown in Table 3,for winter wheat,the values ofaandbin the R-K model fitted from the observation data of winter wheat in two seasons were 1.266 and 0.514,and 1.360 and 0.628,respectively;R2values were 0.792 and 0.762,respectively,and the RMSE values were similar at 1.662×10⁻⁵and 1.641×10⁻⁵mm s-1,respectively. For rice,the value of empirical coefficientbwas higher than that of the winter wheat,withaandbvalues of 1.166 and 1.255 and 1.240 and 1.104,andR2values of 0.800 and 0.798,respectively. The RMSE value is slightly higher than that of the winter wheat,with 2.206×10⁻⁵and 2.298×10⁻⁵mm s-1,respectively. In general,the difference in parametersaandbbetween winter wheat and rice fields calibrated through two-year observation data is small,which can also better explain the universality of the parametersaandbof the R-K model in this region. Fig.3-A and B and Fig.3-C and D show the scatter fitting diagram of the observed instantaneous ET (ETobs) and the simulated value from the calibrated R-K model (ETR-K) in winter wheat and rice fields,respectively.The instantaneous ET value of farmland simulated by the calibrated R-K model is evenly distributed near the 1:1 line,and the overall performance of this model is good.

Fig.2 Variation characteristics of crop coefficient (Kc) in winter wheat (A,2007-2008; B,2008-2009) and rice (C,2008; D,2009)growing seasons.

Table 2 Crop coefficient (Kc) of winter wheat and rice in each growth stage from 2007 to 2009

Table 3 Calibration of empirical coefficients in R-K model (a and b) and AA model (m and n) in winter wheat and rice growing seasons and corresponding determination coefficient (R2) and root mean square error (RMSE)

Fig.3 Comparison between the observed instantaneous evapotranspiration (ETobs) and the simulated evapotranspiration by the calibrated R-K model (ETR-K) in winter wheat (A,2007-2008; B,2008-2009) and rice (C,2008; D,2009) growing seasons.
Determination of the empirical coefficients in the AAmodel As shown in Table 3,for winter wheat,the optimal parametersmandnin the AA model obtained by the observation data from two growing seasons were -1.721,0.243 and -1.783,0.204;R2was 0.805 and 0.784,and the RMSE was 1.530×10⁻⁵and 1.496×10⁻⁵mm s-1,respectively.For rice,the optimal parametersmandnwere -0.648,1.668 and -0.608 and 1.589,R2was 0.817 and 0.829,and RMSE was 1.985×10⁻⁵and 1.957×10⁻⁵mm s-1,respectively.Similar to the R-K model,the optimal parametersmandnapproached each other. Themvalue was negative in the growth period of winter wheat and rice,while thenvalue was positive. The absolute value of parametermin the growing season of winter wheat was higher than that of rice,while the absolute value of parameternwas much smaller.Fig.4-A and B and Fig.4-C and D show the comparison between the observed instantaneous evapotranspiration(ETobs) and the simulated values of the calibrated AA model(ETAA),respectively,in winter wheat and rice fields during two growing seasons. It is evident that the instantaneous ET of farmland simulated by the calibrated AA model is mostly evenly distributed near the 1:1 line,and the performance is as good as that of the R-K model.
3.4.Simulation of daily ET
Simulated daily ET by the PM-Kc modelThe daily ET calculated based on theKccalibrated in Table 2 was ETcal. The ETFAOwas daily ET calculated using theKcrecommended by the FAO. TheKcvalues at three stages(namely,initial,middle and late growth stages) of winter wheat recommended by the FAO are 0.70,1.15 and 0.40,respectively,while those of rice are 1.05,1.20 and 0.90,respectively. After exchanging theKcof two growing seasons,the calculated daily ET was ETVer. Then,we compared ETcal,ETFAOand ETVerwith the observed daily ET(ETobs) obtained by the eddy covariance system. As shown in Fig.5-A and B,simulation performances of ETcaland ETVerare good,and the slope of the fitted trend line andR2value are both approximately 0.9,which also demonstrated the universality of the calibratedKcin this region. Compared with the above two estimation results,the of ETFAOsimulation was relatively poor,and theR2values were only 0.699 and 0.598.The simulation performances of ETcal,ETFAOand ETVerin the rice-growing season (Fig.5-C and D) are similar to those of winter wheat. The calibratedKcalso has a good effect on the rice ET simulation and the universality is confirmed again.

Fig.4 Comparison between the observed instantaneous evapotranspiration (ETobs) and the simulated evapotranspiration by the calibrated AA model (ETAA) in winter wheat (A,2007-2008; B,2008-2009) and rice (C,2008; D,2009) growing seasons.
To further evaluate the applicability of the above three calibratedKcvalues,three statistical measures,namely,the RMSE,MAE and Nash-Sutcliffe (NS) were employed in this study. As shown in Table 4,when using the PM-Kcmodel to simulate the daily ET of the winter wheat and ricegrowing seasons,the simulation effects of ETcaland ETVerwere both better than that of ETFAO,and the RMSE and MAE values were both smaller than that of ETFAO. However,the effect of the calibrated riceKcin simulating its daily ET was worse than that of the calibrated winter wheatKc. Although theR2values of ETFAOin Fig.5-C and D were relatively high,the NS values were only 0.189 and 0.305 during the rice-growing seasons in 2008 and 2009,respectively. The aforementioned results implied that theKcrecommended by the FAO was not suitable for use in this region.
Simulated daily ET by the R-K modelSimilar to the validation method of the PM-Kcmodel,the daily ET calculated by calibrated empirical coefficientsaandbin the R-K model in Table 3 was ETR-K; ETR-K_Verwas the daily ET obtained by exchanging the empirical coefficients of two growing seasons. Then,we compared ETR-Kand ETR-K_Verwith the observed values obtained by the eddy covariance system (ETobs). As shown in Fig.6-A and B,the overall differences between ETR-Kand ETR-K_Verduring the growing season of winter wheat are small,indicating that the calibrated parametersaandbhave a good universality in this region. The slopes of the fitted linear trend lines between the above two ET (ETR-Kand ETR-K_Ver) and ETobsvalues are both approximately 0.7 and theR2value is close to 0.9.However,in the simulation of daily evapotranspiration in the rice-growing season (Fig.6-C and D),the slopes of the fitted linear trend lines of ETR-Kand ETR-K_Verare approximately 0.71 and 0.77,respectively,and theR2value is slightly less than 0.8. In general,both ETR-Kand ETR-K_Verunderestimated the daily actual ET. Combined with Table 4,it is shown that the R-K model has a poor performance when simulating the daily ET of rice compared with that of winter wheat,with values of RMSE and MAE of approximately 0.75 and 0.65,and the NS value is only approximately 0.55.

Fig.5 Comparison between the observed daily evapotranspiration (ETobs) and the simulated values (ETcal,ETFAO and ETVer) during winter wheat (A,2007-2008; B,2008-2009) and rice (C,2008; D,2009) growing seasons.

Table 4 Performance evaluations of simulated values by three typical models (PM-Kc,R-K and AA models) through the root mean square error (RMSE),mean absolute error (MAE) and Nash-Sutcliffe (NS) coefficient1)
Simulated daily ET by the AA modelSimilar to the validation method of the R-K model,the calibrated empirical coefficientsmandnin the AA model in Table 3 during the winter wheat and rice-growing seasons in 2007-2009 were used to calculate the corresponding daily ET (ETAA). We also obtained the daily ET (ETAA_Ver) by exchanging the empirical coefficients of the two growing seasons; then,the performances of ETAAand ETAA_Verwere analysed by comparison with the observed values obtained by the eddy covariance system (ETobs). As shown in Fig.7-A and B,the differences between the values of ETAAand that of ETAA_Verin the winter wheat growing season are small,manifesting that the calibrated parametersmandnalso have good universality in this region. The slopes of the fitted linear trend lines of ETAAand ETAA_Verare approximately 0.7,and theR2value is close to 0.85. However,in the simulation of daily ET in the rice-growing season (Fig.7-C and D),the slopes of the fitted linear trend lines of ETR-Kand ETR-K_Verare approximately 0.7 and 0.79,respectively,and theR2values are close to 0.75 and 0.71,respectively. Similar to the results of the R-K model,the underestimation phenomenon still exists. It is evident from Table 4 that the error of daily ET between ETAAand ETAA_Veris mostly equivalent and the simulation of rice is slightly worse than that of winter wheat. However,compared with the R-K model,the overall simulation results of the AA model are better,especially in the rice-growing season.
Fig.6 Comparison between the observed daily evapotranspiration (ETobs) and the simulated values (ETR-K and ETR-K_Ver) by the R-K model during winter wheat (A,2007-2008; B,2008-2009) and rice (C,2008; D,2009) growing seasons.
4.Discussion
The objective of this study is to evaluate the performance of three operational models and determine the best ET estimation model for the HRB. The results implied that theKcvalues of winter wheat and rice recommended by the FAO were unsuitable for use in this region,which indicated the necessity for calibrating theseKcvalues here. Meanwhile,the calibratedKcvalues of winter wheat and rice in this study also have good universality. In general,both the R-K model and AA model significantly underestimated the daily ET of winter wheat and rice rotations,and the PM-Kcmodel was recommended as the best model among these three models. Similar outcomes have been reported by other researchers (Katerjiet al.2010; Ranaet al.2011; Zhaoet al.2015; Jianget al.2019). Gaoet al.(2013) utilized the multisource model to determine daily ET for maize and soybean in the maize-soybean rotation. Their outcomes showed that the calibrated model results were consistent with observation. Zhaoet al.(2013) estimated daily ET in winter wheat and summer maize crop rotation and found that the slope of the fitted trend line between simulated and observed ET for summer maize was approximately 1,and the simulated ET was higher in the late-season stage. The calculated ET for winter wheat was considerably higher than the observed ET.

Fig.7 Comparison between the observed daily evapotranspiration (ETobs) and the simulated values (ETAA and ETAA_Ver) by the AA model during winter wheat (A,2007-2008; B,2008-2009) and rice (C,2008; D,2009) growing seasons.
In the determination of daily ET,Rana and Katerji (2008)found in the field under the Mediterranean climate that the R-K model revealed good robustness when estimating the daily ET of tomato crops. This finding was echoed with other studies (Katerjiet al.1983; Ranaet al.2005;Shuttleworth and Wallace 2009). The R-K model may give a reasonable result for limited water resource practices;it may be robust and insensitive to climatic variability,which often rarely occurs in the farmland of the HRB in eastern China. The earlier studies showed that the R-K and AA models were more precise and applicable than the PM-Kcmodel (Xu and Singh 2005; Rana and Katerji 2008). However,the R-K model is not suitable for variable weather. Moreover,the R-K model required the specific parameterization of the canopy resistance. Compared with the PM-Kcand R-K models,the AA model has some advantages:less input of climatic variables is needed and a simpler algorithm is used reasonably. However,this model does not consider well the characteristics of the specific crops and the underlying conditions of the region in the estimation of crop ET. All these reasons could provide reasonable explanations for the PM-Kcmodel performing the best in our study. On the other hand,Shuttleworth and Wallace (2009) also found good performance of the PM-Kcmodel in a semiarid region.
In addition,Wanget al.(2018) also reported that the two-step model performs better than the one-step model when simulating the maize actual ET in a semi-humid and drought-prone region of China. However,the researcher also claimed that,to some extent,the one-step model has application prospects,but it still needs to be rigorously tested through field experiments before application. If the influence of the growth stage on the coefficient is considered,the one-step model may have a better performance,which needs to be further verified in the future.
Although this study has calibrated the key parameters of the three models for the typical rice-wheat rotation system in the HRB,some uncertainties still exist and need further research. First,the winter wheat and rice rotations may have an impact on seasonal variability. The seasonal impact on the canopy resistance was ignored in the R-K model.The seasonal impact may also bring changes toaandbcoefficient values in eq.(10). Thus,the underestimation of the R-K and AA models may be explained by the uncertainty of theaandbcoefficients,as well as themandncoefficients. This uncertainty was exhibited for similar crops such as soybean (Ranaet al.1997) and sweet sorghum(Ranaet al.2001). In Table 3,the calibrated coefficientsaandbfor winter wheat and rice are all positive,which is consistent with the study of Wanget al.(2018). The specificavalue was larger than thebvalue for winter wheat.The result is inconsistent with that of Wanget al.(2018).However,Liuet al.(2012) indicated that the calibratedbvalue is negative for maize in southeastern Australia,and theaandbvalues for canola were much lower than that in our study. In Table 3,the calibratedmandnvalues for rice were similar to those of maize reported by Liuet al.(2012),while themandnvalues for winter wheat were different.All these phenomena manifested that the above model parameters have obvious regional and species differences.The climatic conditions may also have a great influence on the empirical coefficients (Wanget al.2017). Moreover,Liuet al.(2012) also reported that the calibrated AA model performed better than the Katerji and Perrier (KP) model,which is similar to the results of our study.
Despite this study being conducted over three years of rice-wheat rotation experiments,more experimental data are still needed to calibrate and verify the models for predicting crop ET. In this study,we calibrated theKcof winter wheat and rice at each growth stage. However,the coefficient values in the R-K and AA models were calibrated according to the whole growth period. Subsequent studies could calibrate the empirical coefficients of the above two models in specific growth stages to explore whether the above methods could be improved. Although we have evaluated the energy closure degree of EC data in the winter wheat and rice-growing seasons and found the overall closure degree is reasonable,some uncertainties still existed in the EC technology,including the underestimation of latent heat flux,dissatisfactory energy closure and so on (Wang and Dickinson 2012). In future research,further processing and correction of EC data are needed. If conditions permit,Bowen ratio equipment is recommended,which can effectively correct the underestimation of latent heat flux. Ultimately,the outcomes of our study provide a reasonable basis and systematic guideline for estimating crop water demand and farmland water practice in the HRB.
5.Conclusion
This study shows that the energy closure of the observed data by the eddy covariance system in the growing season of winter wheat and rice during the period 2007 to 2009 was reasonable. Thus,the data can be applied to estimate and simulate the daily field ET in the HRB. The daily ET of winter wheat decreased slowly and then increased rapidly,and the precipitation was mainly concentrated in the middle and late growth stages; however,the daily ET of rice increased first and then decreased,with the precipitation mainly concentrated in the early and middle stages. For winter wheat and rice,the changing trends of ETaand ETrefare mostly consistent. The ETrefis generally larger than the ETain the early growth stage of winter wheat,but their difference is not evident in the rice-growing season.Both the R-K model and AA model significantly underestimated the daily ET of winter wheat and rice rotations,and the PM-Kcmodel was recommended as the best model among these three models. Finally,it is recommended that the PM-Kc(two-step) model can be applied for estimating the daily ET of rice and wheat cultivated in a farmland ecosystem located in the sub-humid climatic region in the HRB and in other similar climatic regions worldwide.
Acknowledgements
This research was supported by the National Natural Science Foundation of China (41905100),the Anhui Provincial Natural Science Foundation,China (1908085QD171),the Anhui Agricultural University Science Foundation for Young Scholars,China (2018zd07),the Anhui Agricultural University Introduction and Stabilization of Talent Fund,China (yj2018-57),the National Key Research and Development Program of China (2018YFD0300905) and the Postgraduate Research and Practice Innovation Program of Jiangsu Province,China (KYCX17_0885).
杂志排行

Journal of Integrative Agriculture的其它文章
- The dynamic impact of income and income distribution on food consumption among adults in rural China
- Driving factors of direct greenhouse gas emissions from China’s pig industry from 1976 to 2016
- ATP regulates the phosphorylation and degradation of myofibrillar proteins in ground ovine muscle
- Use of two-stage dough mixing process in improving water distribution of dough and qualities of bread made from wheatpotato flour
- lmpact of climate change on maize yield in China from 1979 to 2016
- Optimization of water and nitrogen management for surge-root irrigated apple trees in the Loess Plateau of China