Switches in transcriptome functions during seven skeletal muscle development stages from fetus to kid in Capra hircus
2021-12-14LlNGYinghuiZHENGQiJlNGJingSUlMenghuaZHULuLlYunshengZHANGYunhaiLlUYaFANGFuguiZHANGXiaorong
LlNG Ying-hui ,ZHENG Qi ,JlNG Jing ,SUl Meng-hua ,ZHU Lu ,Ll Yun-sheng ,ZHANG Yunhai ,LlU Ya ,FANG Fu-gui ,ZHANG Xiao-rong
1 College of Animal Science and Technology,Anhui Agricultural University,Hefei 230036,P.R.China
2 School of Natural and Environmental Sciences,Newcastle University,Newcastle upon Tyne,NE1 7RU,UK
3 Anhui Province Key Laboratory of Local Livestock and Poultry Genetic Resource Conservation and Bio-Breeding,Anhui Agricultural University,Hefei 230036,P.R.China
Abstract Skeletal muscle accounts for about 40% of mammalian body weight,the development of which is a dynamic,complex and precisely regulated process that is critical for meat production.We here described the transcriptome expression profile in 21 goat samples collected at 7 growth stages from fetus to kid,including fetal 45 (F45),65 (F65),90 (F90),120 (F120),and 135 (F135) days,and birth 1 (B1) day and 90 (B90) days kids. Paraffin sections combined with RNA-seq data of the 7 stages divided the transcriptomic functions of skeletal muscle into 4 states:before F90,F120,F135 and B1,and B90.And the dynamic expression of all 4 793 differentially expressed genes (DEGs) was identified. Furthermore,DEGs were clustered by weighted gene correlation network analysis into 4 modules (turquoise,grey,blue and brown) that corresponded to these 4 states. Functional and pathway analysis indicated that the active genes in the stages before F90 (turquoise)were closely related to skeletal muscle proliferation. The DEGs in the F120-related module (grey) were found to participate in the regulation of skeletal muscle structure and skeletal muscle development by regulating tRNA. The brown module(F135 and B1) regulated fatty acid biological processes to maintain the normal development of muscle cells. The DEGs of B90 high correlation module (blue) were involved the strengthening and power of skeletal muscle through the regulation of actin filaments and tropomyosin. Our current data thus revealed the internal functional conversion of the goat skeletal muscle in the growth from fetus to kid. The results provided a theoretical basis for analyzing the involvement of mRNA in skeletal muscle development.
Keywords:mRNA,goat (Capra hircus),transcriptome,skeletal muscle
1.lntroduction
Goat (Capra hircus) is an important class of commercial animal that produces a variety of products for human consumption,including meat,milk,skin,and cashmere(Guanet al.2016). On the commercial side,thelongissimus dorsimuscle is the largest part of the spinal ridge in the goat and has commercial significance in the production of fresh and cured meat (Oviloet al.2014). In addition,goat skeletal muscle had become an essential material for studying mammalian-specific cell differentiation and proliferation(Janaet al.2016). The fetal stage in mammals is the main period of muscle formation whereby skeletal muscle begins with the mesoderm,from which the myoblasts first migrate to the limbs and trunk and proliferate rapidly (Endo 2015).When the myoblasts reach a given number,they differentiate into muscle cells and fuse into multinucleated muscle fibers which remain at a constant number after birth (Wanget al.2010; Endo 2015; Ganassiet al.2018). The growth of skeletal muscle after birth in mammals depends mainly on the circumference and length of the muscle fibers,also known as muscle fiber hypertrophy (Al-Shanti and Stewart 2009; Murachet al.2018). Hence,the fetal stage at which secondary myogenesis occurs is critical for skeletal muscle development. In this regard,changes in gene expression profiles during prenatal and postnatal skeletal muscle development in goat are an essential consideration for future developments in commercial meat production.
The mechanisms underlying myoblasts production are regulated by the temporal expression of a series genes. The transcriptional program of undifferentiated muscle stem cell function relies on paired box transcription factors,including paired box 3 (PAX3) and paired box 7 (PAX7)(Buckingham and Relaix 2007). Myogenic regulatory factors (MRFs),including basic helix-loop-helix (bHLH) factors myogenic differentiation 1 (MYOD1),myogenic factor 5 (MYF5),myogenic factor 6 (MYF6)and myogenin(MYOG),have positive effects on promoting the differentiation and fusion of satellite cells into myogenic muscles. In mouse embryos,the first sign of myogenesis is the activation of the myogenic factorMYF5in the cells. Soon after dermomyotome formation,cells in the dorsomedial lip begin to expressMYF5and to down-regulatePAX3(Chal and Pourquie 2017). With the upregulation ofMYF5,MYOD1is also upregulated,which is required for myogenesis (Haldaret al.2008). These previous findings have collectively revealed some of the critical molecular mechanisms in skeletal muscle development but only the functions of single genes or pathways have been so far identified.
In summary,the transcriptome plays an indispensable role in regulating the development of goat skeletal muscle,but its expression and functional changes in multiple skeletal muscle developmental stages from fetus to kid are not clear. The development of high-throughput sequencing,however,means that the entire transcriptome of skeletal muscle development and growth can be elucidated (Terryet al.2018; Llano-Diezet al.2019; Yanget al.2019). We herein hypothesized that the role of the transcriptome in the skeletal muscle of goat would be different at different stages from fetus to kid. In order to test the above hypothesis,the RNA-seq was used to analyze the switches of transcriptome functions in 7 skeletal muscle development stages of goat skeletal muscle from fetus to kid. Detailed clarification of the transcription during development from fetus to kid reveals the regulatory factors for muscle growth,further helping researchers to better explore the goals of molecular breeding.
2.Materials and methods
2.1.Ethics approval and consent to participate
This study was carried out following the principles of the Basel Declaration and Recommendations of theGuide for the Care and Use of Laboratory Animals(NRC 2011). The protocol was approved by the ethics committee of Anhui Agricultural University,China,under permit No.AHAUAE2017-07 (May 12 2017).
2.2.Collection of goat skeletal muscle tissue
The experimental animal used in this study was the Anhui White goat (AWG) that was maintained with a unified management system. Twenty-five female AWGs (3-4 years old,35-40 kg) were uniformly estrus and mated. Among them,the 23 successfully mated females were artificially fed in accordance with “Feeding Standard of Meat-Producing Sheep and Goat” (NY/T816-2004 2006) in the pen. During this period,the goat house was kept dry and clean,and the ambient temperature was controlled at 14-25°C. At each sampling stage,we randomly selected 3 of them and obtained their children for sampling. Only 1 fetus (each animal represents 1 repetition) was selected for each female goat,that is,there were 3 biological repeats in each stage.When sampling,muscle anesthesia was performed with Jingsongling (Shandong Zibo Veterinary Medicine Co.,Ltd.,Shandong,China) at 2 mg kg-1before caesarean section. After complete anesthesia,the arterial blood was exsanguinated for euthanasia (this method complies with the Chinese Society of Laboratory Animals,No.T/CALAS 31-2017). Caesarean sections were performed on the pregnant AWGs at 45 days (F45),65 days (F65),90 days(F90),120 days (F120),and 135 days (F135) to obtain the corresponding fetuses. In addition,kids born naturally were obtained at 1 day (B1) and 90 days (B90). This meant that we obtained 7 groups of skeletal muscles. The skeletal muscles of each group were from 3 fetuses (or kids),and their mothers were different. Samples were obtained from all of these stages in 3 biological replicates for a total of 21 samples. After washing 3 times with PBS containing penicillin and streptomycin,thelongissimus dorsimuscles were collected at 7 stages and divided into 2 groups. One group was immediately frozen in liquid nitrogen until RNA extraction needed,and the other was sectioned into muscle blocks (1 cm×1 cm×1.5 cm) and stored in muscle-specific fixation solution (Servicebio,Wuhan,China) to generate paraffin sections.
2.3.Paraffin sections,hematoxylin and eosin staining,and analysis
The fixed skeletal muscle blocks were embedded in paraffin using a conventional method and these blocks were continuously cut into 5-μm sections. A conventional hematoxylin and eosin (H&E) staining method was then used for the sections,in which hematoxylin was stained for 4 min,and 0.5% eosin for 3 min. Four stained sections were selected for each sample,and tissue structures of these samples were observed under Olympus BX51 (Tokyo,Japan)microscope with a 40× objective lens and a 10× eyepiece.Images were acquired with Image Pro®6.0 (Image Pro®,Media Cybernetics Inc.,USA). Ten non-overlapping and non-missing fields of view were selected for each slice,and the acquired images were used to calculate the muscle fiber diameter.
2.4.Library generation and data analysis
Total RNA was isolated from the 21 samples using a TRIzol Kit (Invitrogen,Carlsbad,CA,USA). RNA with an OD260/D280absorbance of between 1.8 and 2.0 and with structural integrity verified by gel electrophoresis was used for further experiments. RNA integrity was assessed using the RNA Nano 6000 Assay Kit for the Bioanalyzer 2100 System(Agilent Technologies,Santa Clara,CA).
RNA libraries construction and sequencing were performed by Novogene Co.,Ltd.(Beijing,China). Briefly,3 μg of RNA per sample was used as the input material.Ribosomal RNA was removed by Epicentre Ribo-zero™rRNA Removal Kit (Epicentre,Madison,Wisconsin),and rRNA-free residues were cleaned up using ethanol precipitation. Libraries were subsequently generated from the rRNA-depleted RNA using an NEBNext®Ultra™Directional RNA Library Prep Kit for Illumina®(NEB,Ipswich,MA) in accordance with the manufacturer’s recommendations. Library fragments were purified for 150 to 200 bp cDNA fragments with the AMPure XP System(Beckman Coulter,Beverly,MA). A 3-μL aliquot of USER Enzyme (NEB) was next used with size-selected and adaptor-ligated cDNAs. And PCR was then performed with Phusion High-Fidelity DNA polymerase,universal PCR primers and an index (X) primer. Amplified products were purified using an AMPure XP System (Beckman Coulter,Beverly,MA) and library quality was assessed on the Agilent Bioanalyzer 2100 System (Agilent Technologies,Santa Clara,CA).
Raw reads in a fastq format were first processed through in-house perl scripts (ng-qc). The ng-qc parameter:-L 20,-p 0.5 (-L,lowest quality value,-p parameter of low-quality reads. -L 20,-p 0.5 was the low-quality base ratio allowed by the specified reads. This means that the number of bases of quality value ≤-L parameter (20)/reads length ≥0.5 represented low-quality reads). And,the ng-qc Software would be removed by sequence matching after entering the adapter sequence. Clean reads were obtained by removing reads from the raw data that contained adapters,reads with an undetermined base content greater than 10% and lowquality reads. All of the downstream analyses were based on clean reads. TheC.hircusreference genome and gene model annotation files for this study can be accessed at NCBI genomics (accession number of sequence read archive(SRA) for this genome is PRJNA340281,and the name is“Capra hircusbreed:San Clemente Raw sequence reads”).
2.5.Data analysis
An index of the reference genome was built using bowtie2 v2.2.8 and paired-end clean reads were aligned to the reference genome using HISAT2 v2.0.4 (Langmeadet al.2009). The mapped reads of each sample were assembled using StringTie (v1.3.1) (Perteaet al.2016). FPKM meant fragments per kilo-base of exon per million fragments mapped which was calculated based on the length of the fragments and read counts mapped to this fragment.Cuffdiff (v2.1.1) (Trapnellet al.2010) was used to calculate the FPKMs of coding genes in each sample. At the same time,differential expression analysis was performed on the 2 groups using Cuffdiff (v2.1.1). Transcripts with aP-value<0.05 were assigned as differentially expressed.Principle component analysis (PCA) was conducted using R package and heat map/cluster analysis using the Morpheusfree online platform (https://software.broadinstitute.org/morpheus/). The types and distribution of alternative splicing(AS) events were determined using rMATS Software (Shenet al.2014),which supported the AS detection by RNA-seq data with biological replicates.
2.6.Weighted gene correlation network analysis(WGCNA)
WGCNA was used to identify synergistically changing gene sets and candidate biomarker genes based on the interconnectivity of the gene sets and the association between them and the phenotype. WGCNA was performed with R package (Langfelder and Horvath 2008). First,the algorithm assumed that the gene network obeyed a scale-free distribution and defined the gene co-expression correlation matrix and the adjacency function formed by gene network. The coefficient of variation in different nodes and genes was then calculated. And genes with coefficient of variation lower than 0.5 were filtered. A hierarchical clustering tree was next constructed based on the coefficient of variation. Different branches of the clustering tree represented different gene modules.
2.7.Trend analysis:Short time-series expression miner cluster (STEM)
After WGCNA clustering,STEM’s default pattern was used to identify and cluster the expression of genes in each module to better understand the role of positively related genes in each period. By assessing the degree of association between gene expression trends and changes in sample traits,gene groups unrelated to sample changes were isolated. Additionally,the STEM Software extracts and color-codes the trends in mainstream gene expression,and thereby ranks important gene expression trends in the order of importance from small to large (Ernst and Bar-Joseph 2006). Genes with aP-value<0.05 identified by STEM were considered to be enriched.
2.8.Enrichment analysis of function and pathway
Functional enrichment analysis for differentially expressed genes (DEGs) was conducted using the GOseq R package(Younget al.2010). KOBAS Software was used to test the statistical enrichment of DEGs in the Kyoto Encyclopedia of Genes and Genomes (KEGG) pathways (Maoet al.2005).Gene Ontology (GO) and KEGG terms with aP-value<0.05 were considered significantly enriched.
2.9.Quantitative RT-PCR validation (qRT-PCR)
DEGs that had an association with muscle development were selected for qRT-PCR analysis using a GoTaq qPCR Master Mix (A6002; Promega,Madison,WI) and Real-Time Thermal Cycler 5100 (Thermo,Waltham,MA). The same total RNA samples used in the sequencing analysis were used as the template in these amplification reactions. All of the primer pairs were designed using Primer-BLAST in NCBI and synthesized by the Shanghai General Biotech Co.,Ltd.(Table 1). TheGAPDHhousekeeping gene was amplified as a control. The target sequence quantity was normalized to the reference sequence and calculated by 2-ΔΔCt.
2.10.Data statistical analyses
Data of muscle fiber diameters at different stages andqRT-PCR results of different genes were analyzed using one-way ANOVA in SPSS version 21.0. Duncan’s multiple comparisons were performed for testing significant differences between mean values at different stages. Data values were presented as a mean±SE and considered statistically significant with aP-value<0.05. Each goat served as an experimental unit.

Table 1 Primer pairs used for qRT-PCR
3.Results
3.1.Characteristics of goat skeletal muscle at different developmental stages
To better understand the changes in skeletal muscle characteristics during the development from goat fetuses to post-birth kids,we generated H&E stained sections of thelongissimus dorsimuscle over 7 growth stages. During the F45 period,thismuscle was reticular and the cells were gradually forming (Fig.1-A). At the F65 stage,empty tubular primary muscle fibers were observed,and some secondary muscle fibers were formed around the primary muscle fibers (Fig.1-B). At this same time,the muscle cells were continuously fused. Primary muscle fibers were reduced at F90 but still present (Fig.1-C). Secondary muscle fibers were observed in the F120,F135,B1 and B90 sections,and the primary fibers had completely disappeared (Fig.1-D-G).These results indicated that primary muscle fibers had completed the fusion process and fully formed between F90 and F120.
The skeletal muscle fiber diameters were measured at each of the 7 stages. A significant difference (P<0.05) was found between F120 and F135,and another significant difference (P<0.05) was found between B1 and B90(Table 2). F120 had the finest muscle fibers of all the stages,which may be due to subsequent muscle cell fusion leading to a larger diameter in the early muscle cells (Table 2).These results demonstrated that genes for skeletal muscle hypertrophy were gradually functioning between F120 and F135,and between B1 and B90.
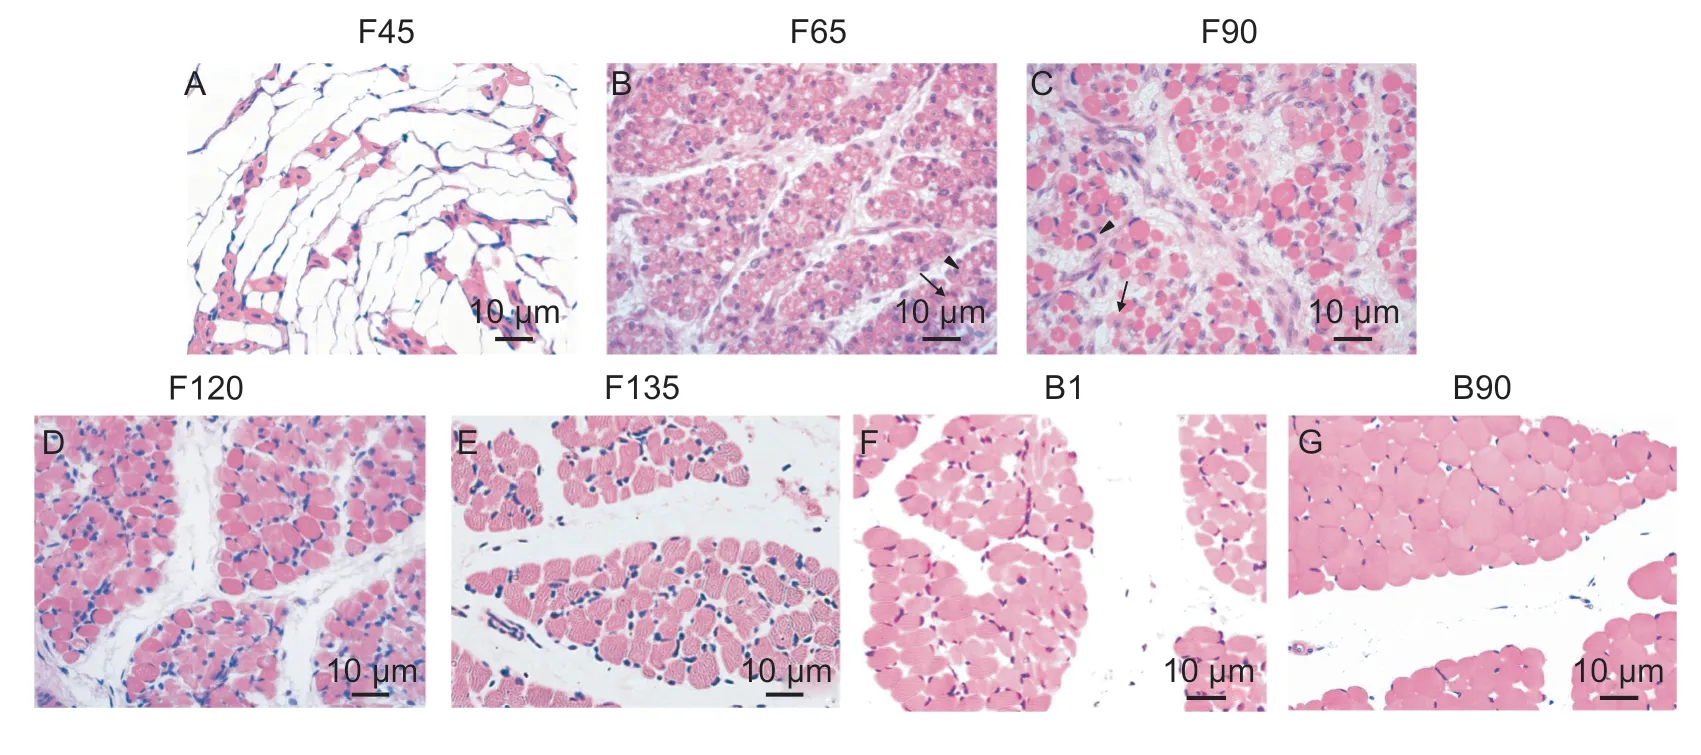
Fig.1 Goat skeletal muscle morphological changes over 7 developmental stages. A-G,Paraffin sections representing the seven stages (n=3) of goat skeletal muscle development (40×10 fold). Triangles represent the primary muscle fibers; arrows represent the secondary muscle fibers. F45,F65,F90,F120 and F135 represent fetuses of 45,65,90,120 and 135 days,respectively; B1 and B90 represent kids 1 day and 90 days after birth.

Table 2 Muscle fiber diameters at 7 stages of goat development1)
3.2.Overview of skeletal muscle transcriptome data in AWGs
To investigate the transcriptomic changes in goat skeletal muscle during development from fetus to kid,we conducted RNA-seq of the21dorsal longissimussamples at the 7 AWG developmental stages under examination. The Illumina Hiseq 4000 Platform was used for this analysis and after filtering,89 638 828-134 883 288 clean reads were obtained per sample,accounting for 94.41-98.44% of the raw reads (Appendix A). Ultimately,91.89 to 97.30% of the clean reads in the library were mapped to the genome and 40 859 expressed mRNAs were identified (Appendix B).
3.3.AS in goat skeletal muscle
To account for biological variability,AS was evaluated in 2 consecutive comparison groups at the 7 development stages examined in AWGs. In these analyses,5 major AS types were considered,including skipped exons (SE),alternative 5´ splice sites (A5SS),alternative 3´ splice sites(A3SS),mutually exclusive exons (MXEs) and retained introns (RI). Among all comparison groups,SE was the most abundant AS event,accounting for 75.53-76.11% of the total(Fig.2). The probability of other events from the highest to lowest was MXE (9.65-10.26%),A5SS (4.25-4.46%),A3SS (7.62-8.38%),RI (1.89-2.14%) (Fig.2). In addition,SE was the AS event that produced the most differences(Fig.2). Interestingly,no differential expression AS events(Diff.exp events) occurred from the F45 to F90 stage,which confirmed the similarity of these 3 stages.
3.4.Dynamic pattern of DEGs

Fig.2 Types and distribution of 5 major alternative splicing (AS) events detected during goat skeletal muscle development.Identified AS events and their frequencies,and differential AS events. SE,skipped exon AS events; RI,retained intron AS events;A5SS,alternative 5´ splice site AS events; A3SS,alternative 3´ splice site AS events; MXEs,mutually exclusive exon AS events;Diff.exp events,differential expression AS events; Freq,frequency.
To investigate the role of transcriptome regulation in skeletal muscle,we next performed transcriptome expression profiling analysis of the skeletal muscle samples over the 7 stages. This allowed an evaluation of any dynamic change in this transcriptome during the growth from fetus to kid. A total of 4 793 DEGs (P<0.05,|fold change (FC)|>2) were thereby identified across the 7 stages of AWGs’ skeletal muscle development (Fig.3-A; Appendix C). Unbiased hieratical clustering analysis of these DEGs in 21 samples showed that the same samples clustered together,and the largest segmentation occurred between F90 and F120.The samples from the stages before F90 and after F120 were also clustered together (Fig.3-B). PCA showed that 3 samples at the same stage were clustered together and accurately captured the developmental order from F45 to B90 (Fig.3-C). At the same time,it can be seen from the PC1 (50.8%) that the clusters from F45 to F90,F135 and B1 were closer. And there was a large gap between F90 to F120 and F120 to F135. These results were consistent with the morphological changes in the skeletal muscle sections.There were 209 DEGs identified between the F90 and F120 comparison groups,of which 95 were up-regulated and 114 were down-regulated (Fig.3-A). In addition,the B1 and B90 comparison revealed the most DEGs among all of the consecutive paired comparisons,indicating that the regulation of muscle development genes also changes significantly before and after birth (Fig.3-A).
Another interesting phenomenon was that there were more down-regulated genes than up-regulated genes between the pre-F120 stage and all other stages,but that more up-regulated genes were evidenced after the F135 stage (Fig.3-A). To further clarify this phenomenon,functional analyses were performed on the specific DEGs in the comparison groups between the pre-F120 and other stage,and the comparison groups after F135. Interestingly,only DEGs up-regulated before F120 were enriched in 20 GO terms,which were mainly related to metabolic and synthetic processes (Appendix D),such as,“phosphorus metabolic process”,“single-organism metabolic process”,“lipid biosynthetic process” and others. The functions of a large number of genes that were down-regulated before F120 are related to binding,cell proliferation,and enzyme(Appendix D). For example,terms related to binding include “binding”,“protein binding” and others. And terms related to cell proliferation include “regulation of cell cycle”,“DNA-templated transcription,initiation” and others,and related to enzymes include “DNA-directed RNA polymerase II,holoenzyme”,“sulfotransferase activity” and others.Function analysis of specifically up-regulated genes after F135 were only enriched in the “binding” term,and downregulated genes were only enriched in the “cellular lipid metabolic process” term (Appendix D).
3.5.qRT-PCR validation of DEGs
To verify the reliability of our transcriptomic data,we analyzed genes known to be involved in skeletal muscle development,includingPAX7,MYOG,MYF5,MYF6,MEF2CandMYOF(Fig.4).PAX7andMYOGhad the highest expression before F120 andMYF5andMYOFwere gradually down-regulated at all stages (Fig.4-A-D). TheMYF6expression peak was during F135,and that ofMEF2Cwas at F90 (Fig.4-E and F). The results of qRT-PCR were consistent with the expression trends calculated using the RNA-seq data.

Fig.3 Dynamic analysis of all differentially expressed genes (DEGs). A,number of DEGs in goat skeletal muscle that satisfies an |Fold change (FC)|>2 and P-value<0.05. Yellow,number of up-regulated genes; green,number of down-regulated genes;blue,total number of DEGs between 2 stages. B,unbiased hieratical clustering heat maps of DEGs identified in the 21 samples.Red,relatively high expression; green,relatively low expression. C,principal component analysis (PCA) analysis of DEGs in 21 samples of goat skeletal muscle at 7 development stages. The same color represents the same stage. F45,F65,F90,F120 and F135 represent fetuses of 45,65,90,120 and 135 days,respectively; B1 and B90 represent kids of 1 day and 90 days after birth.
3.6.Transformation of DEGs during goat skeletal muscle development
To fully demonstrate the functional changes that occur at the different stages of goat skeletal muscle development,WGCNA was used to cluster the expression patterns of 2 936 filtered DEGs (coefficient of variation below 0.5)into 4 modules,and denoted them using different colors in Appendix E. These modules included the turquoise module that was positively related to the stage before F90,the gray module that was positively associated only with F120,the brown module which was related to F135 and B1,and the blue module that had a positive relationship of B90 (Fig.5; Appendix F). All of the same phases shown similar correlations,which also indicated the reliability of the data. The stage which had a positive correlation was consistent with the stage observed in skeletal muscle sections. These results allowed us to divide the 7 skeletal muscle development stages into 4 developmental states,i.e.,before F90,F120,B1 and B135,and B90.
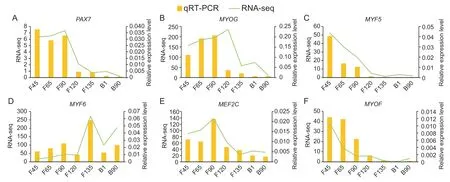
Fig.4 Quantitative RT-PCR validation (qRT-PCR) of goat muscle development-related differentially expressed genes (DEGs).A-F,qRT-PCR verified the expression of goat skeletal muscle development-related mRNA in RNA-seq data. F45,F65,F90,F120 and F135 represent fetuses of 45,65,90,120 and 135 days,respectively; B1 and B90 represent kids of 1 day and 90 days after birth. The identification of each gene has 3 biological repeats (n=3).
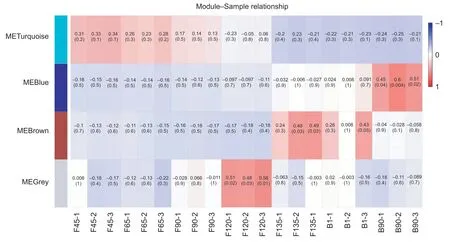
Fig.5 Correlation between modules and samples. A,hierarchical clustering heat map of all identified differentially expressed genes (DEGs) by sample. The number in parentheses is the P-value,which represents the significant correlation between the gene module and the sample. Red,relatively positive correlation; blue,relatively negative correlation. F45,F65,F90,F120 and F135 represent fetuses of 45,65,90,120 and 135 days,respectively; B1 and B90 represent kids of 1 day and 90 days after birth.
3.7.The DEGs that function before F90 regulate skeletal muscle cell proliferation,metabolism,and skeleton formation

Fig.6 Functional predictions for the turquoise module. A,trend analysis of the turquoise module. Color intensity denotes enrichment. B,heat map of 25 muscle-related GO (Gene Ontology) enrichment terms across 5 trends (turquoise module). The color bar represents -log10(P-value). This means that the smaller the P-value,the redder the color.
The characteristics of the turquoise module DEGs were mainly related to the stages from F45 to F90 of skeletal muscle development and negatively correlated with the later stages. All DEGs in the turquoise module clustered into 12 expression patterns,and profile 0 (T-P0),8 (T-P8),11 (T-P11),13 (T-P13),and 14 (T-P14) were significantly enriched (P<0.05) in the turquoise module (Fig.6-A). T-P0(640 DEGs) contained the most genes and showed a decreased expression from F45 to B90. Functional analysis of this cluster showed that it was enriched in 372 GO terms,including “cell cycle”,“DNA-templated transcription,initiation”,“regulation of cell cycle” and others related to cell proliferation (Fig.6-B; Appendix G). In addition,pathway analysis revealed that these DEGs were also associated with skeletal muscle proliferation,including“cell cycle”,“p53 signaling pathway”,“DNA replication” and others (Appendix G). These results demonstrated that the genes in T-P0 are closely related to muscle proliferation.T-P14 (411 DEGs),which showed increased expression from F45 to B90,was found to be enriched in metabolismrelated functions,such as “ATP metabolic process”,“purine nucleoside monophosphate metabolic process” and others(Fig.6; Appendix G). Pathway analysis of T-P14 also found these genes to be related to metabolism (Appendix G). In addition,the T-P13 cluster (245 DEGs) peaking at F120 was found to be involved in “muscle organ development”,“muscle structure development”,“septin cytoskeleton”,among others. These genes thus had an association with skeletal muscle development,proliferation,and the cytoskeleton (Fig.6-B; Appendix G). In addition,function analysis of T-P14 found be enriched in “maintenance of protein location in cell”,“maintenance of protein location”and other GO terms that were mainly associated with protein regulation in skeletal muscle cells,and pathways were enriched in “cell cycle”,“protein processing in endoplasmic reticulum” and others (Fig.6-B; Appendix G).Moreover,T-P8,which contained 411 DEGs,was enriched in 129 functions,including “regulation of cell cycle”,“DNAtemplated transcription,initiation”,and “Notch signaling pathway” (Fig.6-B; Appendix G). Pathway analysis of this profile uncovered terms related to muscle development,such as “calcium signaling pathway”,“oxytocin signaling pathway” and “cGMP-PKG signaling pathway” (Appendix H).
3.8.F120 DEGs participate in skeletal muscle structure formation
The module with the fewest DEGs was grey,which was only positively related to F120. Since this grey module contained the fewest DEGs (54),we performed direct function and pathway analysis of this module. The function analysis revealed that the F120 genes were relevant to skeletal muscle structures,such as “troponin complex”,“striated muscle thin filament”,and “myofibril” and others(Fig.7; Appendix I). This stage was also found to be closely associated with tRNA as the functional analysis showed enrichment for terms (Fig.7; Appendix I). Furthermore,the identification of the “adipokine signaling pathway” term by pathway analysis also suggested that there were adipocytes distributed in thelongissimus dorsimuscle at the F120 stage(Appendix J).
3.9.B1 and F135 DEGs are involved in metabolism and biosynthesis in skeletal muscle cells
There were 169 DEGs clustered in the brown module,which were mainly enriched in two expression patterns:profile 9(brown-P9) and P14 (brown-P14) (Fig.8-A). The DEGs(72) in brown-P14 were up-regulated from F45 to B90 and enriched in both metabolic and biosynthetic processes,such as “small molecule metabolic process”,“single-organism biosynthetic process” and others (Fig.8-B; Appendix K).Pathway enrichment confirmed these findings from the functional enrichment analysis. In addition,brown-P14 was found to be enriched in fatty acid related pathways,including“fatty acid degradation”,“fatty acid metabolism” and “fatty acid biosynthesis”,which provide energy to skeletal muscle cells (Appendix L). Moreover,browm-P9 genes were involved in regulating enzyme activity and the composition of various organelles (Fig.8-B; Appendix K). In addition,the participation of these DEGs in “cell cycle arrest” indicated that skeletal muscle cell proliferation kept decreasing during goat development. Furthermore,brown-P9 was shown to be enriched in skeletal muscle related pathways,such as “nicotinate and nicotinamide metabolism” and “HIF-1 signaling pathway” (Appendix L).
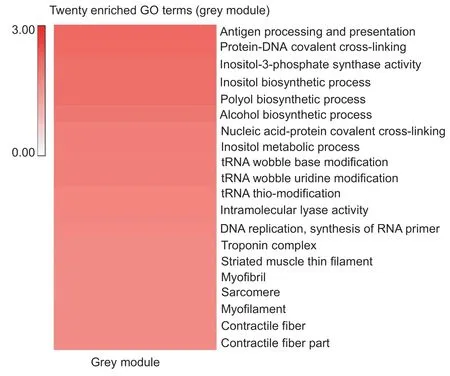
Fig.7 Functional predictions for the grey module. A,heat map of 20 muscle-related GO enrichment terms in the grey module.The color bar represents -log10(P-value). This means that the smaller the P-value,the redder the color.
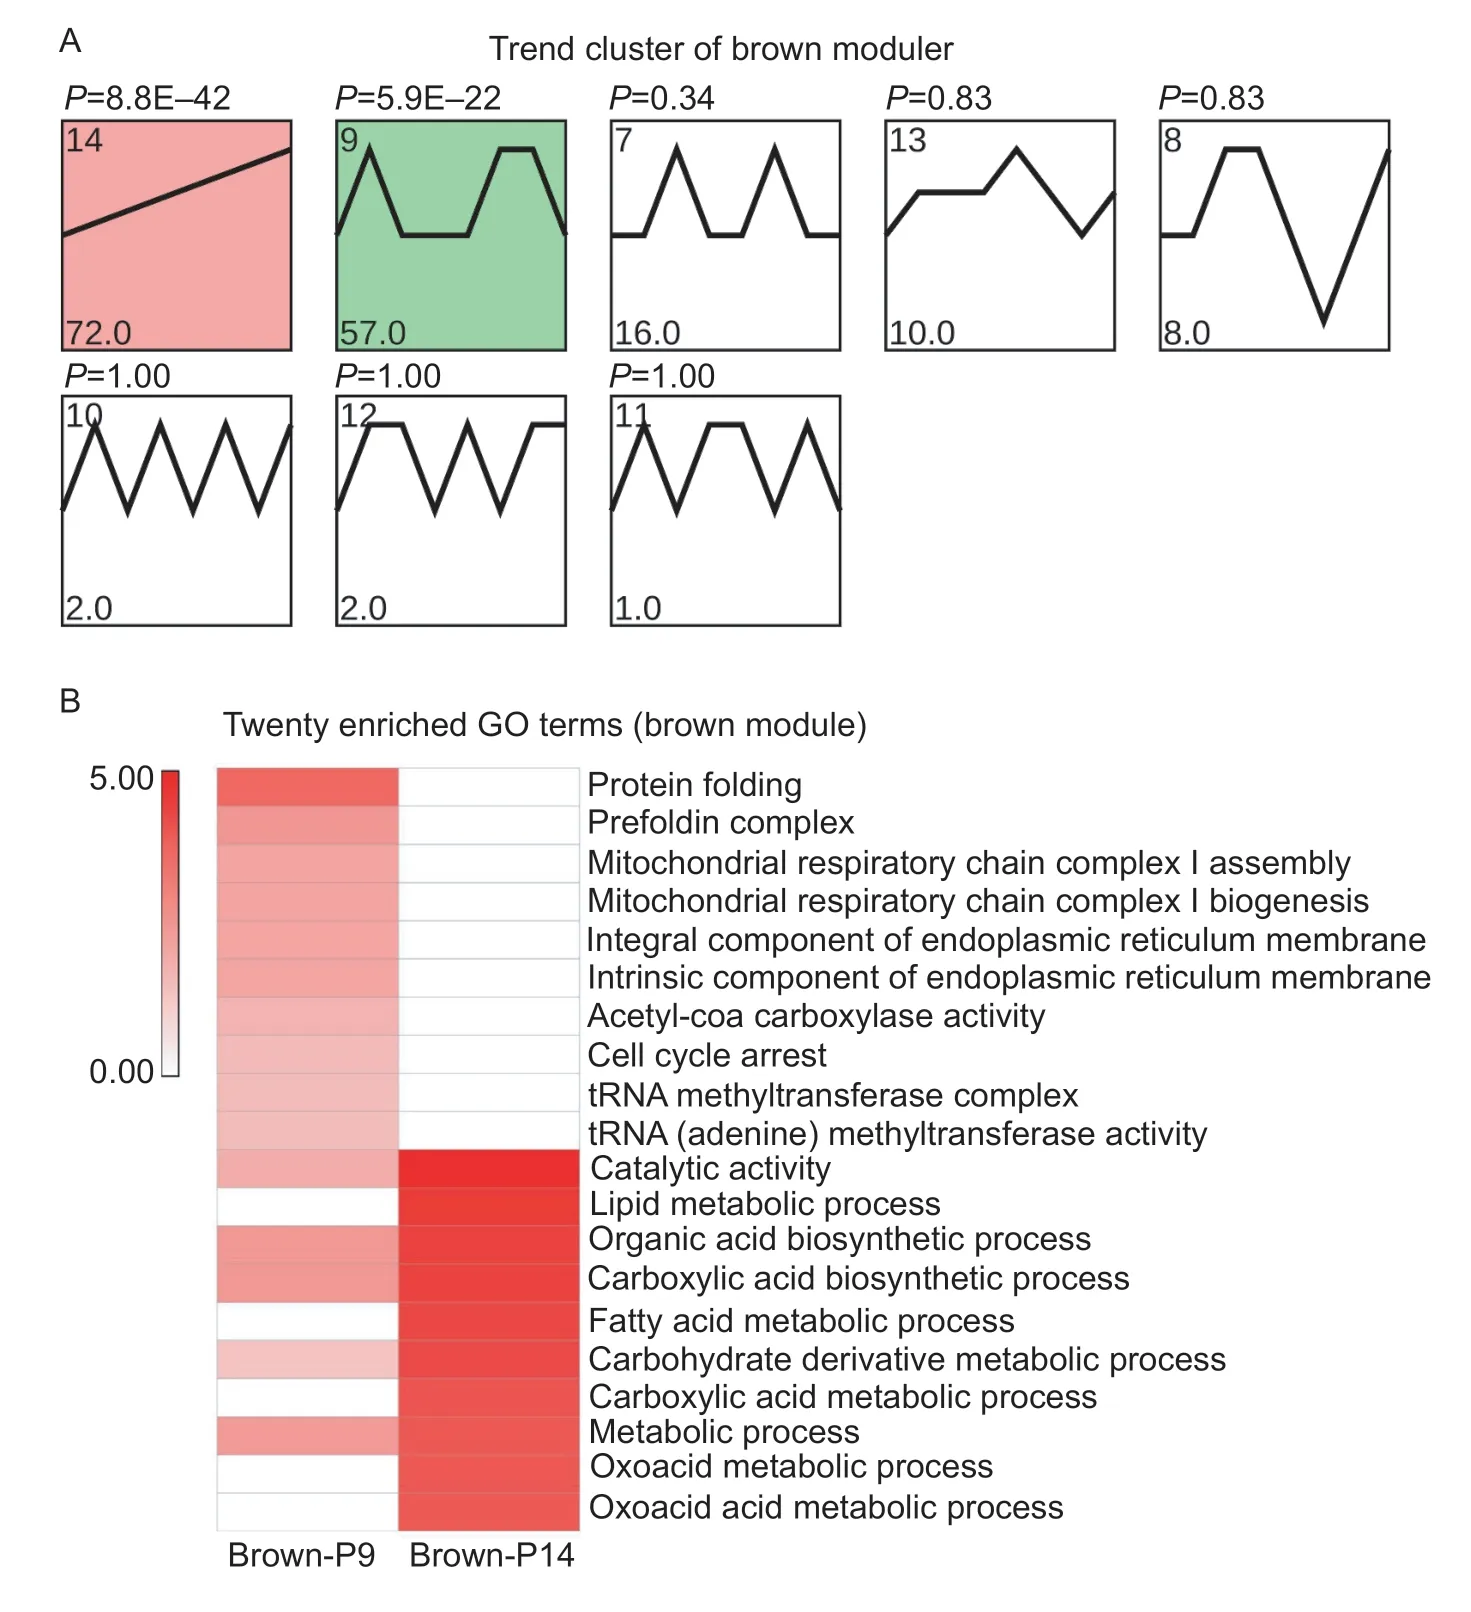
Fig.8 Functional predictions for the brown module. A,trend analysis of the brown module. Color intensity denotes enrichment.B,heat map of 20 muscle-related GO enrichment terms for two trends (brown module). The color bar represents -log10(P-value). This means that the smaller the P-value,the redder the color.
3.10.The DEGs in B90 regulate actin formation and provide energy for skeletal muscle activity
The blue module DEGs only showed a high correlation with B90 (P<0.05). These genes were enriched in profile 14 (blue-P14),and up-regulated from F45 to B90(Fig.9-A). Functional analysis indicated that blue-P14 was mainly related to the regulation of actin,such as “actin filament depolymerization”,“regulation of actin filament depolymerization” and others (Fig.9-B; Appendix M).Pathway analysis of blue-P14 further clarified that these DEGs were related to energy sources for skeletal muscle development,including “glycolysis/gluconeogenesis”,“pentose phosphate pathway”,“fructose and mannose metabolism” and other processes associated with carbohydrate metabolism (Appendix N). These results revealed that the B90 is highly related to regulate actin formation and provide energy to skeletal muscle.
4.Discussion
The skeletal muscle of mutton goat accounts for more than 40% of body weight,the development of which is a dynamic,complex and precisely regulated process that is critical for meat production. Therefore,exploring the transcriptome regulation of mutton goat from fetus to kid is necessary for the molecular breeding process of goat.Our hypothesis that the roles of the transcriptome in the skeletal muscles of goats would be different at different stages from fetus to kid has been confirmed by the results from the present study. Interestingly,functional analysis revealed the sequential development of stage-specific core genetic networks. Initially,early goat skeletal muscle genes(DEGs in pre-F90 stages) were mainly closely related to proliferation. Then,function process migrated from skeletal muscle regulating development by regulating tRNA in F120,to regulate the biological process of fatty acids in F135 and B1. Finally,DEGs in B90 regulated stage actin filaments and tropomyosin to provide skeletal muscle strength.Moreover,the paraffin sections and gene profiles of goat skeletal muscle in multiple stages showed that F120 was a crucial stage of muscle function transformation during fetal period. These results analyzed the role changes of the stage-specific core genetic network of goat skeletal muscle development from fetus to kid,and provided valuable resources for future research related to molecular breeding of researchers.
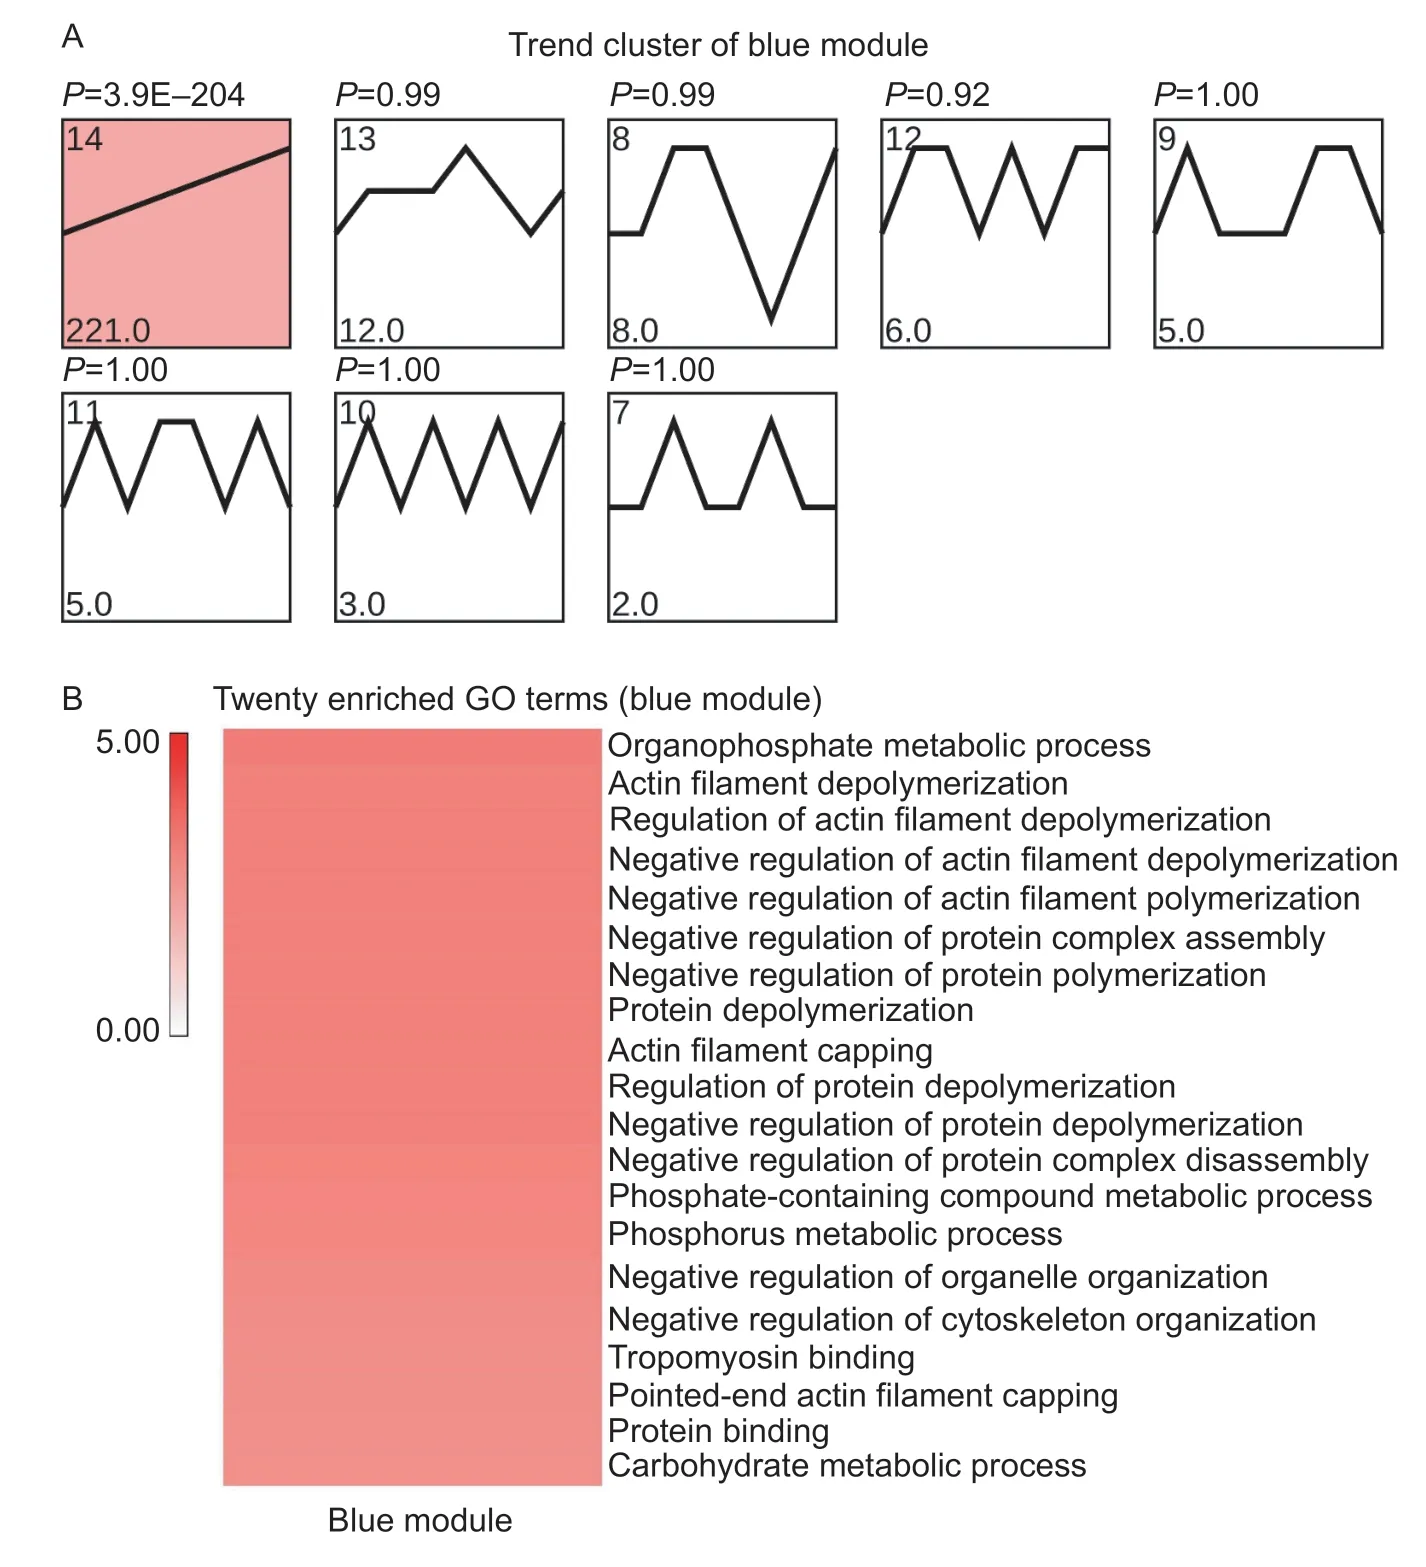
Fig.9 Functional predictions for the blue module. A,trend analysis of the blue module. Color intensity denotes enrichment. B,heat map of 20 muscle-related GO enrichment terms for one trend (blue module). The color bar represents -log10(P-value). This means that the smaller the P-value,the redder the color.
Skeletal muscle production begins with prenatal lactating progenitor cells and skeletal muscle myoblastsin vivo,the subsequent proliferation and differentiation of which causes the fusion of monocytes to form multinucleated muscle fibers(Chal and Pourquie 2017). At present,there have been many prior studies on the structural changes in skeletal muscle cells at different stages in pig (Wanket al.2006),chicken (Geseket al.2019) and sheep (Renet al.2011).The muscle fiber diameters of Ujumqin sheep have been reported to show an increase from the fetal 70,85,100,120,and 135 days stages,with significant differences (P<0.05)at all of these stages except for 70 days (Renet al.2011).Furthermore,the muscle fiber diameter oflongissimus dorsihas been found to have significant differences (P<0.05) at 1,3,6,9 and 12 months of age,but there was no significant difference (P>0.05) reported between 12 and 18 months(Siqinet al.2017). Differing from Ujumqin sheep,our current analysis revealed that the diameter of the muscle fibers in thelongissimus dorsimuscles of AWGs had a downward trend from F65 to F120. This may be due to the presence of empty tubular primary muscle fibers at the F65 and F90 stages. The fusion of monocytes also affected the muscle fiber diameter. This fusion was completed during the F120 period in the goats,and the muscle fiber diameter showed an upward trend in the subsequent stages. This may mean that F120 is a key period for the functional transformation of AWG muscle fibers.
Our present study identified 4 793 DEGsviatranscriptional dynamic analysis over 7 developmental stages of goat skeletal muscle. And we further demonstrated temporal expression patterns based on WGCNA clustering.The turquoise module was positively related to F45 to F90. Function and pathway analysis indicated that the upregulation of T-P0 DEGs at all stages was related to the proliferation of skeletal muscle cells,with functions including“regulation of cell cycle”,“DNA-templated transcription,initiation” among others,and pathways including “p53 signaling pathway”,“DNA replication” and others. The p53 signaling pathway was found to be involved in the proliferation of skeletal muscle cells. Stable p53 in skeletal muscle stem cells was reported previously to reduce mitotic disasters and significantly increased their self-renewal and regeneration potential (Liuet al.2018). The “regulation of cell cycle” GO term contains proliferation-related genes,such as ZW10 interacting kinetochore protein gene (ZWINT)(Yinget al.2018),kinesin family member C1 (KIFC1) (Tenget al.2019),lipin 1 (LPIN1) (Wanget al.2018) and others.Although some of these genes have not yet been verified in skeletal muscle,the data suggest that they may be related to early skeletal muscle cell proliferation. Moreover,T-P8 DEGs were also involved in cell proliferation including“regulation of cell cycle”,“notch signaling pathway” and others. The notch signaling pathway was shown previously to be an essential regulatory pathway in skeletal muscle proliferation and regeneration as impaired notch signaling leads to a decrease in p53 activity and mitotic catastrophe in aged muscle stem cells (Liuet al.2018).
The grey module DEGs had a strong positive relationship to the F120 stage,and the functional assessment of this module revealed that skeletal muscle structures were formed during F120. For example,troponin T2(TNNT2),which was a gene involved in “striated muscle thin filament”,“myofibril”,“sarcomere” and other muscle structure functions,had been associated also with the activation of myoblasts (Bakayet al.2002). Moreover,tRNAs and tRNA fragments have been described as modulators of skeletal muscle function (Liapiet al.2019). Matrin 3 (MATR3),LOC102175876 identified in our current grey module participated in multiple processes of tRNA regulation.
The DEGs in the brown module were found to be positively related to B1 and F135 and cluster in the brown-P14 and brown-P9 expression patterns. Our subsequent functional and pathway analyses indicated that brown-P14 DEGs were involved in fatty acid biological processes,including“fatty acid metabolic process”,“fatty acid degradation”,“fatty acid biosynthesis” and so on. Fatty acids not only served as important energy substrates for muscle cells,but also regulated muscle cell differentiation and improved meat flavor (van Hall 2015; Xuet al.2018).Carnitine palmitoyl transferase 2(CPT2)(Boufrouraet al.2018),acyl-CoA synthetase long chain family member 1(ACSL1)(Zhaoet al.2019),acyl-CoA dehydrogenase very long chain(ACADVL)(Shchelochkovet al.2009) in brown-P14 were genes involved in fatty acid oxidation in skeletal muscle,and their deficiency or mutation can cause myopathy. In addition,thecyclin dependent kinase inhibitor 1A(CDKN1A)in the “cell cycle arrest” function of brown-P9 affects cellcycle progression by inducing a premature cell-cycle exit and generating a pool of cells blocked at G0 (Davidovicet al.2013).
The blue module was only significantly positively related to the B90 stage,and was enriched in a profile (blue-P14)of genes that were up-regulated upwards at all 7 stages.Functional analysis revealed that the DEGs of blue-P14 were involved in the regulation of actin filament and tropomyosin. Actin filaments could be assembled into an agonist cytoskeleton that provided motivation for skeletal muscle cell movement (Svitkina 2018). For example,the absence oftropomodulin 4(TMOD4),which was a gene involved in “actin filament depolymerization”,caused severe muscle weakness,dyskinesias and early death in zebrafish(Bergeret al.2014). Similarly,a dysfunctionalleiomodin 3(LMOD3) which was involved in “regulation of actin filament depolymerization” also leaded to filament disorders and myopathy (Yuenet al.2014). These data will be helpful for future studies designed to explore and elucidate the mechanisms that regulate muscle development and growth in various commercial animal species on a genome-wide scale.
5.Conclusion
Here,we have profiled the transcriptome at 7 developmental stages of goat skeletal muscle development,from the fetus to post-natal kid,and used paraffin-embedded tissue sections to determine the timing of muscle cell functional transitions which divided into 4 states,including before F90,F120,F135 and B1,B90. We also performed WGCNA on the identified DEGs,and STEM analysis on the resulting modules. Our subsequent analysis indicated that the pre-F90 phase was closely related to skeletal muscle proliferation in the goat. F120 DEGs were found to participate in the regulation of skeletal muscle structures and in skeletal muscle development by regulating tRNAs.The DEGs of the F135 and B1 stages regulated fatty acid biological processes to maintain the normal development of muscle cells. The DEGs of B90 provided skeletal muscle power by regulating actin filaments and tropomyosin. The functions and pathways evident in these modules further revealed a sequential progression of stage-specific core genetic networks in goat skeletal muscle development.
Acknowledgements
This research was supported by the National Natural Science Foundation of China (31772566 and 31972629),the Anhui Key Research and Development Program,China(1804a07020128),and the Anhui Province Academic and Technology Leader Reserve Talent Project,China(2019H206). The funders had no role in study design,data collection and analysis,decision to publish,or preparation of the manuscript.
Appendicesassociated with this paper can be available on http://www.ChinaAgriSci.com/V2/En/appendix.htm
杂志排行
Journal of Integrative Agriculture的其它文章
- The dynamic impact of income and income distribution on food consumption among adults in rural China
- Driving factors of direct greenhouse gas emissions from China’s pig industry from 1976 to 2016
- ATP regulates the phosphorylation and degradation of myofibrillar proteins in ground ovine muscle
- Use of two-stage dough mixing process in improving water distribution of dough and qualities of bread made from wheatpotato flour
- lmpact of climate change on maize yield in China from 1979 to 2016
- Estimating daily actual evapotranspiration of a rice-wheat rotation system in typical farmland in the Huai River Basin using a two-step model and two one-step models