Tunnel effects on ring road traffic flow based on an urgent-gentle class traffic model
2021-09-17YonglingZhngSmirnovJinSmirnovZuojinZhu
Yongling Zhng ,M.N.Smirnov ,Jin M ,e,N.N.Smirnov ,Zuojin Zhu ,b,∗
a Faculty of Engineering Science, University of Science and Technology of China, Hefei 230026, China
b Faculty of Mechanics and Mathematics, Lomonosov Moscow State University, Moscow 119992, Russian Federation
c Moscow Center for Fundamental and Applied Mathematics, Moscow 119992, Russian Federation
d Scientific Research Institute for System Analysis, Russian Academy of Sciences, Moscow 119992, Russian Federation
e Naval Architecture and Civil Engineering, Jiangsu University of Science and Technology, Zhenjiang 215600,China
ABSTRACT To explore tunnel effects on ring road traffic flow,a macroscopic urgent-gentle class traffic model is put forward.The model identifies vehicles with urgent and gentle classes,chooses the tunnel speed limit as free flow speed to express the fundamental diagram in the tunnel,and adopts algebraic expressions to describe traffic pressure and sound speed.With two speed trajectories at the Kobotoke tunnel in Japan,the model is validated,with good agreement with observed data.Numerical results indicate that in the case of having no ramp effects,tunnel mean travel time is almost constant dependent on tunnel length.When initial density normalized by jam density is above a threshold of about 0.21,a traffic shock wave originates at the tunnel entrance and propagates backward.Such a threshold drops slightly as a result of on-ramp merging effect,the mean travel time drops as off-ramp diversion effect intensifies gradually.These findings deepen the understanding of tunnel effects on traffic flow in reality.
Keywords:Tunnel effects Travel time Density threshold Ramp effects
It is well known that freeway tunnel has bottleneck effects that cause capacity reduction as well as low acceleration rates when vehicles run away from the upstream queue.It was reported that mainstream traffic flow control strategies that use variable speed limits have the potential to improve substantially the performance of freeway networks containing sags [1] .As reported by Goñi-Ros et al.[2],there exists a potentially highly effective and innovative way to reduce congestion at sags,which could possibly be implemented using cooperative adaptive cruise control systems.
To explain the bottleneck effects,Jin [3] presented a behavioral kinematic wave model,in which a tunnel time gap increasing with distance of the tunnel inlet was introduced.The model was expected to be helpful to develop better design and control strategies to improve the performance of a sag or tunnel bottleneck.
To identify and explain prevalent tunnel congestion patterns using a data-driven approach,evaluate the effectiveness of different tunnel management strategies,and suggest suitable strategies to mitigate congestion,based on the congestion type,a methodology was presented by Tympakianakia et al.[4] highlighting the effectiveness of tunnel traffic management by identifying the reasons of congestion on a given day.
A two lane model was proposed by Tang et al.[5],in which the lane-changing model is consistent with car-following behavior on a two-lane freeway,with another multi-lane traffic flow model accounting for lane width,lane-changing and the number of lanes reported [6] .Recently,a multiclass multilane model for freeway traffic mixed with connected automated vehicles and regular human-piloted vehicles was proposed by Pan et al.[7],with some results relating to microscopic multi-lane traffic modeling reported by Jia et al.[8] .
In this letter,focusing on the tunnel effects,as differentiating vehicles to urgent and gentle classes,an urgent-gentle class traffic model (UGM) is proposed to simulate the evolution of vehicular stream on ring roads.The ring road has a tunnel having a speed limit below the free flow speed in the normal road segment.UGM combines the traffic flow model reported previously by Zhang et al.[9] with the particular description for traffic pressure [10] .The tunnel speed limit is used as free flow speed for tunnel traffic flow.
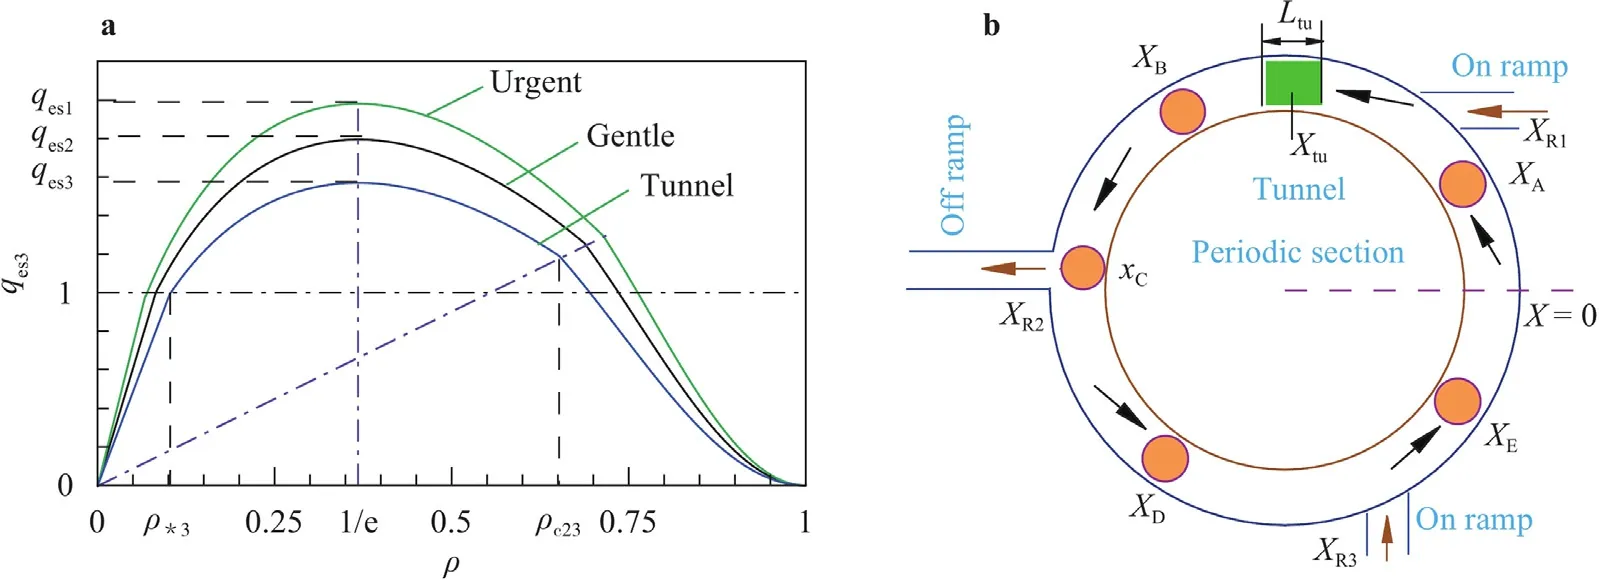
Fig.1.a Macroscopic fundamental diagram (MFD) for urgent-gentle class traffic flows.b Schematic diagram of ring traffic flow with five initial jams located at XI(I=A,B,C,D,E).In part a of this figure,ρ is measured by jam density ρm,the flow rate has the unit of q0=ρmv0,and qesj=cτ j/e·[ρ∗jvf j/ρ∗2vf2],j=1,2, and 3 respectively for the urgent and gentle vehicles in normal road segment,and the vehicles in tunnel.In part b of this figure,the tunnel is located between the initial jam position XA and XB,the mid point of the tunnel is at Xtu,and the tunnel length is denoted by Ltu.
As reported by Aw and Rascle [11],UGM uses pressure gradient to describe traffic acceleration,implying that negative speeds can possibly occur.However as pressure is expressed algebraically rather than described in a partial differential equation as in the gas-kinetic-based model [12,13],UGM is comparatively simple to implement,and as long as values of variables on the grid interface are given with care such as adopting geometric average to predict viscosity on the interface,the specific problem of traffic stoppage[14] can be well handled.
The primary aim of this paper is to explore tunnel effects on ring road traffic flow with UGM.Travel time is predicted with the grid traffic speed obtained by numerical tests on the relevant simulation platform.UGM assumes that tunnel speed limit is equal to the free flow speed in the tunnel,irrespective of vehicular class.
The roadway is assumed to be a ring with five initial jams and a tunnel,as shown schematically in Fig.1.Vehicles in the ring road are differentiated to urgent or gentle class accordingly.To simplify the traffic model,instantaneous speeds for both classes are the same.Labeling urgent density and gentle density of traffic flow byρ1andρ2respectively,taking total traffic densityρ(=ρ1+ρ2),urgent density fractions(=ρ1/ρ)and traffic flow rateq(=ρu)as mandatory variables,using ramp parameterσas reported by Zhang et al.[9],and defining traffic elasticity byγ=0.68ντ,the UGM equations can be written as

whereRsatisfies the expression [15-17]

withl0being the length scale of traffic flow,ρν1=3ργ ux,qeis equilibrium traffic flow rate obtained by the macroscopic fundamental diagrams in Fig.1,R/ρis the acceleration of traffic flow,ν=2Gτ/ρis the kinematic viscosity of traffic flows,withGandτdenoting modulus of vehicular fluid elasticity and relaxation time of traffic flow respectively.Traffic pressurepis defined by combining the approaches reported previously by Zhang et al.[9,10].
To describe ramp flow effect,it is assumed that the ramp parameterσcan be predicted by a random number generator with Gaussian normal distribution,that uses mean,variance and number seed as dummy variables.When local traffic flow rateqis zero,the source term caused by ramp flow vanishes,which is naturally true at off-ramp intersections.
Unless in the tunnel,or in normal road segment,urgent and gentle classes vehicles have different free flow speeds and braking distances,indicating that equilibrium traffic speeds for the urgent and gentle classes are also different,as shown by the fundamental diagrams in Fig.1.Let the jam density beρm,free flow speed bevf j,equilibrium traffic flow rate can be written as [9].

whereΛj=cτ j/uc2,equilibrium speeduc2at second critical densityρc2jis assumed to be a constant such as 18 km/h,and

and the subscriptjis road condition dependent such that in the normal road segment,j=1 and 2,represent the corresponding variables of the urgent and gentle vehicles respectively and,in the tunnel,j=3,denotes the relevant variables of all vehicles that must be driven under the tunnel speed limit.Therefore,in the normal road segment,using the urgent density fractions,qecan be calculated by

but in the tunnel,it is given by

To solve UGM equations numerically,a third-order Runge-Kutta method [18,19] is used to handle the time derivative term,and a fifth-order weighted essentially non-oscillatory scheme is adopted to calculate numerical flux,as reported by Zhang et al.[20].To validate the reliability and feasibility of UGM,a Navier-Stokes like model [21] extended as extended Zhang’s model (EZM) is adopted to provide alternative numerical results for comparison.Distributions of the time averaged traffic speed near the tunnel are compared with speed curves recorded at Kobotoke tunnel in Japan[22].
As shown in Table 1,the tunnel has a speed limit ofvf3=80 km/h,the free flow speed for the gentle class isvf2=100 km/h,and withvf1=120 km/h for the urgent class.The positions for three ramp intersections are given in Table 1,i.e.,XR1=20 km,XR2=60 km,andXR3=100 km.Mid point of the tunnelXtuis set as 30 km,and the total length of the ring roadLis 120 km.The second critical speeduc2is set as 18 km/h as shown in Table 1.
To explore tunnel effects on the evolution of ring road traffic flow,as schematically shown in Fig.1b,numerical tests are conducted by solving UGM equations,with the fundamental diagrams shown in Fig.1a.The length of tunnel is generally assumed to be 5 km,but the length is chosen as 1.5 km for comparison with the two speed trajectories recorded at the Kobotoke in Japan [22],or 3 km,and 1 km to determine the effects of tunnel length change.Five initial jams on the ring road are located atXI,(I=A,B,C,D,E),other traffic flow parameters are also given in Table 1.
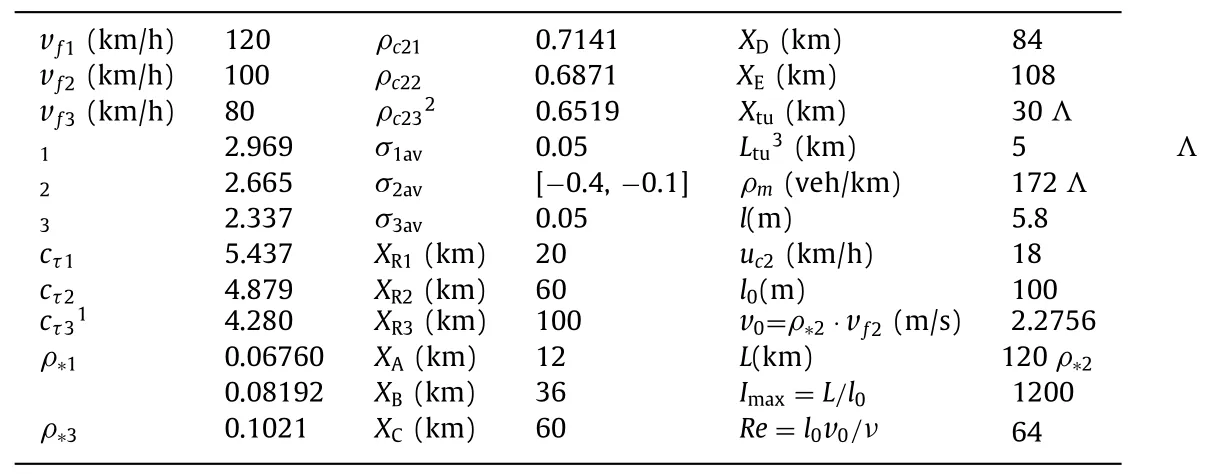
Table 1 Parameters of traffic flow on the ring road.
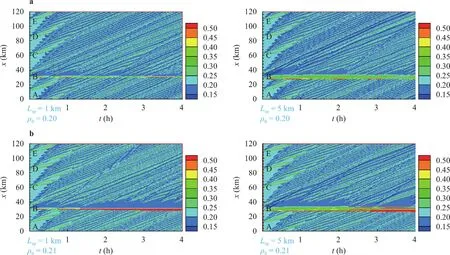
Fig.2.Spatiotemporal evolution of traffic density on the ring road without ramp effects,a ρ0=0.20,b ρ0=0.21 with Ltu=1 and 5 km for the patterns in the left and right respectively.
Initial density is assumed to be

withq(0,x)=qe(ρ(0,x)).
The primary aim of this paper is to explore tunnel effects on ring road traffic flow,using UGM to build a simulation platform,to determine whether the tunnel plays a role of traffic shock wave generation.Spatiotemporal evolution of traffic density in the case without ramp effects is useful to determine the density threshold of traffic shock formation.As the evolution has illustrated ring road traffic flow pattern,we simply refer it to traffic flow pattern for the rest of this paper.
In Fig.2,traffic flow patterns on the left and right parts respectively correspond to tunnel lengthand 5 km forρ0=0.2,0.21.Forρ0=0.21,as shown in Fig.2a,the traffic density in the tunnel is generally higher than the density in the normal road segment.The initial jams and spontaneously generated jams,or queue trajectories,terminate at tunnel entrance.However,at the downstream tunnel exit,a series of spontaneous jams form and propagate forward.Comparing the patterns on the left with those on the right,it can seen than the flow pattern depends on the tunnel lengthLtu.Forρ0=0.21,as shown in Fig.2b,a traffic shock occurs just at the tunnel entrance.Naturally,the threshold relies on the fundamental diagrams as shown in Fig.1a.
When there are ramp effects,for the cases ofρ0=0.2 traffic flow patterns are shown in Fig.3,where the left and right parts respectively correspond toσ2av=−0.1,and −0.4 atXR2,withσ1av=0.05 at ramp intersectionXR1,σ3av=0.05 at ramp intersectionXR3.It is noted spill-back of vehicles at the ramp intersectionXR2 is not permitted,the ramp flow parameterσ2is predicted by a random number generator,σ2is always negative and has an offramp diversion effect.
Forρ0=0.20,as can be seen in Fig.3,in the case ofσ2av=−0.1,in the left part,a traffic shock occurs at the tunnel entrance.This can be explained as the on-ramp of vehicles atXR1 has increased the traffic density in the normal segment upstream the tunnel entrance,implying that density threshold of shock formation is influenced by on ramp flow.While in the right part,in the case ofσ2av=−0.4,due to the larger effect of ramp diversion,the tunnel-triggered traffic shock disappears whent>3.27 h.

Fig.3.Spatiotemporal evolution of traffic density on the ring road with ramp effects for ρ0=0.2 with σ2av(a=−0.1,and b −0.4) for the patterns in the left and right respectively.

Fig.4.Distributions of a urgent density fraction s, b traffic speed u for Ltu=5 km, ρ0=0.21 at t=0.5 h.
The propagation speeds of traffic jams depends closely on the wave interactions and the fundamental diagram used in numerical tests,as explained by Daganzo [23] and reported in recent studies[24–27].
When initial density is set asρ0=0.21,and tunnel length is taken asLtu=5 km,for (i)σ1=σ2=σ3=0 in the case without ramp effects,and (ii)σ2av=−0.1,σ1av=σ3av=+0.05,and (iii)σ2av=−0.4,σ1av=σ3av=+0.05 in the case of ramp effects,the instantaneous distributions of urgent density fractionson the ring road at the timet=0.5 h are shown in Fig.4a.From Eq.(1),the equation of urgent mass fraction can be derived in the form of

indicating that propagation speed of any fraction disturbance is local traffic speedu,but not∂q/∂ρ.For the case without ramp effects:σ1=σ2=σ3=0,the black solid line shows that the fivespeaks initially located atXI,I=A,B,C,D,E,at the timet=0.5 h,move forward to the positions in Fig.4a at an average speed of vQwithin the queue [23] in the periodt∈[0,0.5h].The peak atx=19.9 km is initially located atXC=12 km,implying that its moving speed is 15.8 km/h.
On the other hand,both effects of the tunnel and ramp on the distributions of traffic speeducan be seen in Fig.4b.The tunnel is shown by the solid square with a width 5 km,due to the traffic shock formation at tunnel entrance,uis lower in the segment close to tunnel entrance.
The ramp diversion atXR2=60 km plays an important role in smoothing the segment downstream the ramp intersection.The black solid curves reflect the impact of tunnel on the traffic flow for the case without ramp effects:σ1=σ2=σ3av=0.The spatial variation of speed att=0.5 h also shows the results of the interactions of traffic waves.The green dashed curves and the blue dash-dotted curves reveal the joint effects of ramp flow and the tunnel.
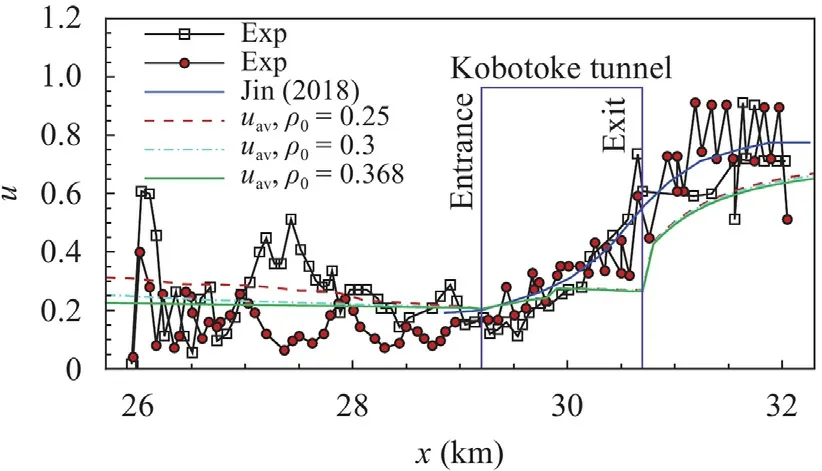
Fig.5.Comparison of time-averaged speed uav for ρ0=0.25, 0.3, and 0.368 with two speed trajectories recorded at the Kobotoke tunnel in Japan [22] and the data extracted from Ref.[3],normalized by vf2.
To compare the time averaged traffic speed with the speed trajectories recorded at the Kobotoke tunnel in Japan,the tunnel length is set asLtu=1.5 km,and the time averaged speed near the tunnel is calculated forρ0=0.25,0.3,or 0.368 in the case without ramp effects,as shown in Fig.5.The speed curves predicted by the UGM agree well with the observed data [22] as well as the calculated speed evaluated on the basis of a behavioral kinematic wave model developed by Jin [3].Indeed,this comparison is used just to indicate UGM has its practical reasonability.How much is the uncertainty of the average speed is not crucial as the traffic flow conditions are naturally different.
As every traveler expects to arrive at his destination on time,travel time is an important factor.Contrary to the study of Chang and Mahmassani [28],in which two heuristic rules were examined and proposed to describe urban commuters’ predictions of travel time as well as the adjustments of departure time in response to unacceptable arrivals in their daily commute and the method reported by Wang et al.[29],which estimated the travel time using a regression model.In this paper,the travel time through the ring road,as described previously [9,10],is calculated with the local average speed based on a pre-assigned time periodΔ0,the road length.While the tunnel mean travel time is predicted using the local average speed for every grid in the tunnel,,k∈[ktu1,ktu2],it can be written as

Fig.6.Distributions of a mean travel time Tt,av, b tunnel mean travel time Ttu,av without ramp effects.

Fig.7.Distributions of a mean travel time Tt,av, b tunnel mean travel time Ttu,av for Ltu=5 km with ramp effects.
with

wheretendis termination time of numerical simulation,l0is uniform grid length.
Without ramp effects,the distributions of mean travel timeTt,av,and tunnel mean travel timeTtu,avwith initial densityρ0are shown in Fig.6.UGM predicts a curve ofTt,avclosely with those given by red filled squares estimated by the model of Zhang[21] extended as EZM.In Fig.6a,it can be seen that whenLtu=0,tunnel vanishes,the mean travel time is shorter.Whenρ0>0.368,the decrease of tunnel lengthLtushortens the mean travel time,and the increase of tunnel length enhances mean travel time.
From Fig.6b,it can be seen that tunnel mean travel timeTtu,avincreases with the increase ofρ0whenρ0≤0.21.Otherwise,Ttu,avis almost constant and shows a time plateau that depends on tunnel lengthLtu.The longer the tunnel length,the higher the time plateau height.
As shown in Fig.7a,whenσ1avandσ2avare fixed as 0.05,σ2avchanges from–0.1 to–0.4,Tt,avdrops correspondingly as the off-ramp diversion effect intensifies gradually.While Fig.7b indicatesTtu,avis smaller for a smaller value ofσ2avwhenρ0is lower than the threshold of shock formation (∼0.2) forLtu=5 km.Asσ1av=0.05,it indicates the existence of on-ramp merging effect causes slightly a reduction of initial density threshold of traffic shock formation.
To explore tunnel effects on the evolution of ring road traffic flow,a macroscopic UGM is developed.The exploration via extensive numerical tests has the following conclusions:
1.UGM can be used to build a simulation platform for exploring properties of tunnel bottleneck.
2.Under simulation conditions of this paper,in the case without ramp effects,the tunnel generates a traffic shock when initial density normalized by jam density reaches a threshold of 0.21,over which the tunnel mean travel time is almost constant.The mean travel time through the ring road increases with the increase of tunnel length,such a variation trend becomes more obviously in over-saturated traffic situations.While in the case with ramp effect,the mean travel time drops correspondingly as off-ramp diversion effect intensifies.
3.When the normalized initial density is above the threshold of shock formation,a tunnel-triggered traffic shock occurs at the entrance and propagates in the upstream direction.The threshold of traffic shock formation drops slightly as a result of on-ramp merging effect.
Declaration of Competing Interest
For the paper titled "Tunnel effects on ring road traffic flow",there is no any conflict of interest.Between authors Dr.Zuojin Zhu on behalf of all coauthors.
Acknowledgments
This work is supported by the National Natural Science Foundation of China (Grant 11972341) and the fundamental research project of Lomonosov Moscow State University "Mathematical models for multi-phase media and wave processes in natural,technical and social systems".We thank Dr.Y.L.Li at Peking University for some useful private communications.
Supplementary materials
Supplementary material associated with this article can be found,in the online version,at doi:10.1016/j.taml.2021.100283.
杂志排行
Theoretical & Applied Mechanics Letters的其它文章
- Simplified permeable surface correction for frequency-domain Ffowcs Williams and Hawkings integrals
- Electrothermal analysis of radiofrequency tissue ablation with injectable flexible electrodes considering bio-heat transfer
- End-to-end differentiable learning of turbulence models from indirect observations
- On the capability of the curvilinear immersed boundary method in predicting near-wall turbulence of turbulent channel flows
- Theory of adaptive mechanical drive
- A 2D numerical ocean model on the Coriolis and wind stress effects using Stochastics
