A 2D numerical ocean model on the Coriolis and wind stress effects using Stochastics
2021-09-17SudhakarMatle
Sudhakar Matle
Department of Mathematcs, VIT-AP University, Amaravati-522237, India
ABSTRACT Ocean basin is modeled as a two-dimensional closed,bounded domain in which the fluid flow is governed by the complex partial differential equations in the flow function.Keeping in view that the ocean currents are non-viscous,no normal flow conditions are used at the basin boundaries.The parameters investigated here are:Coriolis parameter,wind stress coefficient,and latitude.Stochastic differential equations in time scales are solved by deterministic and stochastic methods.Deterministic results concluded that streamlines are symmetric about stagnation point (no flow) for 0 < Rp < 6. 57 .Stochastic controls are introduced to account for variability in time scales.Euler-Maruyama (direct) and Fokker-Planck equation schemes (indirect) are proposed.It is concluded that stream functions in both direct and indirect methods are of the same qualitatively and quantitatively when 0 < Rp < 79 .
Keywords:Ocean currents Stability Bi-furcation Stochastic control Time scales
A warm gulf stream [1] that flows from the equator through the Atlantic Ocean along the north-west coast of Europe causes mild climate over the north-west Europe region.Variation in strength and direction of the gulf stream would have enormous consequences on the climate [2] over the region.There are strong indications that the gulf stream did not flow as far north as it is now.At the end of the ice age,it shifted its course more towards the north within a few years.This change marked the end of the ice age in Europe and brought with it major shifts in the North American climate.This raises awareness that the gulf stream in its present form is vital for life in Europe as well as in North America.When the gulf stream is returning towards the south,the gulf stream is more complicated than expected.In order to predict it properly,numerical ocean models are developed.Literature reveals that the choice of boundary conditions [3] and methods of implementation influenced the qualitative and quantitative character of ocean currents.The direction of currents in the ocean is determined by Coriolis force and wind stress.Herrera and Morett [4] predicted that the direction of Coriolis force [5] using conservation of angular momentum qualitatively and compare it with quantitative calculation.Dijkshtra [6] proposed a model that describes ocean currents with wind stress coefficient as a parameter through a system of nonlinear differential equations [7–9] .
Ocean-atmosphere coupling is essential for a large number of climate phenomena [10] .Stochastic methods are proposed to overcome difficulties in comprehensive deterministic weather and climate models [11] .Franzke et al.[12] studied stochastic methods in weather and climate prediction [13] models and proved that stochastic parameterizations have the potential to remedy many of the current biases in these models.Vannitsem [14] developed a stochastic scheme (based on stochastic averaging) for the coupled (deterministic) ocean-atmospheric system and analyzed its variability in predicting the ocean flow generated by the coupled system [15] .Highham [16] gave a practical introduction to numerical simulations of stochastic differential equations [17] and studied convergence and stability using the Monte-Carlo approach.
The present work addresses a numerical ocean basin model subjected to closed and bounded domain with no normal flow boundary conditions.The aim of the study is to understand the Coriolis and wind stress effects on the stability of ocean flow.Variability and stability of the time scales are simulated and discussed by completely different methods,namely,the Euler-Maruyama approach and Fokker-Planck equation schemes [18] .In the end,methods are compared based on the stability of the flow.A shallow square ocean basin of length πLand depthDthat apparently moves along the longitudinal line is modeled.For two dimensional model,surface ocean currents of the basin are confined to propagate alongxandydirections only.The model to be realistic if a normal component of tangential velocity is zero and tangential velocities are non-zero at the boundaries of the basin.At the same time,ocean depthDis taken into account.Currents in the ocean are determined by the forces acting on them.One of the forces that has a major influence on the flow direction is the Coriolis force.It is an apparent force that is caused by earth rotation.This force acts on flow particles strongly those are farther from the equator.The reason for this is earth rotates faster at the equator than near the poles.When the earth rotates towards the east,a current that flows from the equator will deflect to the east while the current that goes to the equator will deflect to the west.Ifui+vj is tangential velocity vector,thenvi −uj is the normal velocity vector.The Coriolis force is denoted as F and is defined as follows.

wherefis the Coriolis parameter depends on latitudeθand is given by

whereωis the angular velocity of earth.Although flow is assumed to be two-dimensional,frictional force plays a role.This force is caused by the current flowing along the bottom subject to friction.This frictional force works in opposite direction and is given as follows.

whereμis the friction coefficient.The third force that is caused by wind power in the ocean.The speed of wind ensures that the flow is propelled in the direction of the wind.This force is given by

whereτxandτyrepresent wind stress alongxandydirections respectively.The total force on the flow is given by

Barotropic flow with constant densityρ,constant pressurepis assumed in a square basin.Since the basin is closed,conservation of mass and conservation of momentum are applied for such in compressible flow.

These are called shallow water equations because the model describes a relatively shallow ocean with a characteristic length πL≈2×10⁶m andD≈2000 m.From the equation of the mass conservation(∇·v=0),it follows that there is a vector field F such that ∇×F=v.From the scalar triple product,v is orthogonal to F.Then there exists a functionψ(x,y,t)such that F=ψk and satisfies equationsSuch a function is called the stream function.The slope of the stream function represents the direction of the velocity vector and streamlines of the flow are the lines where stream function is constant.The objective is to determine the flow function since it indicates the exact nature of the flow.The dimensionless form of Eq.(6) is obtained by taking the substitutionsx=Lx,y=Ly,u=Uu,v=Uv,t=LU−1t′ and is written as follows.

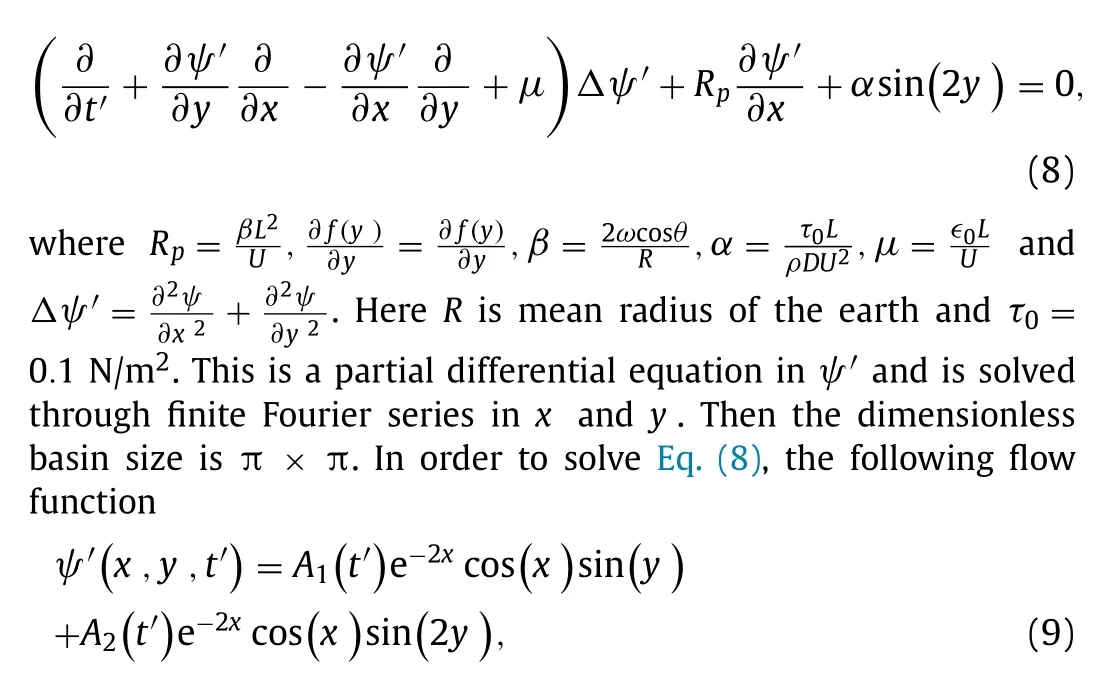
is assumed because it satisfies no normal flow boundary conditions at the coast.From Eq.(9),it is clear thatψ′=0 aty=0 andy’=π.The flow functionψ′defined in Eq.(9) behaves as the function e−2x’[m1cos(x’)+m2sin(x’)] alongxdirection.For values ofm1close to zero,ψ′≈0 atx=0 andψ’=m1e−2π≈0 atx’=π.In Eq.(9),A1(t′)andA2(t′)are unknown time scale functions to be determined.Since cosine,sine functions and e−2xare bounded,stability of the flow function depends on convergence of the time scalesA1 andA2.Substituting Eq.(9) in Eq.(8) and then solve Eq.(8) forA1 andA2 using orthogonal projection method,the following non-linear system of first order ordinary differential equations inA1 andA2 are obtained.

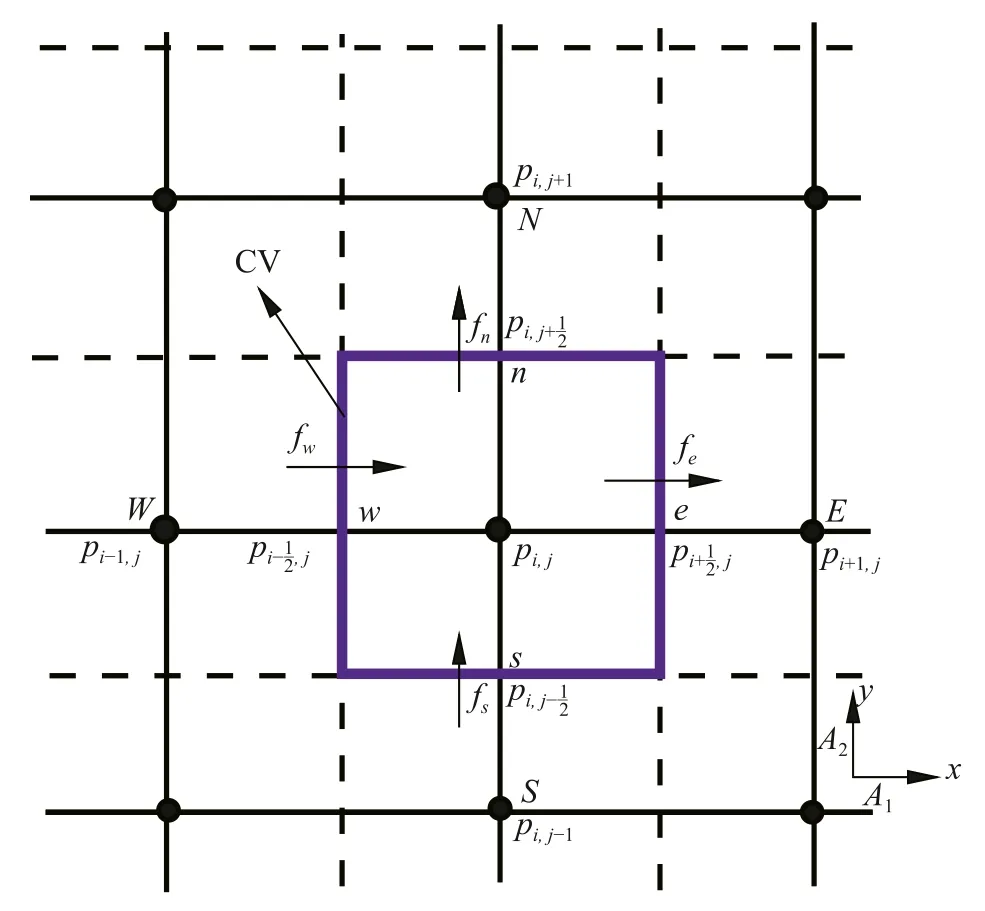
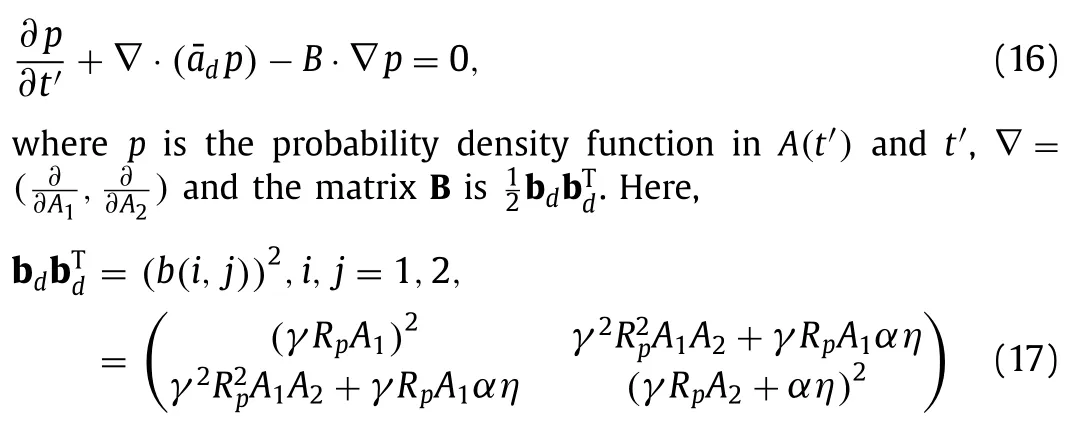
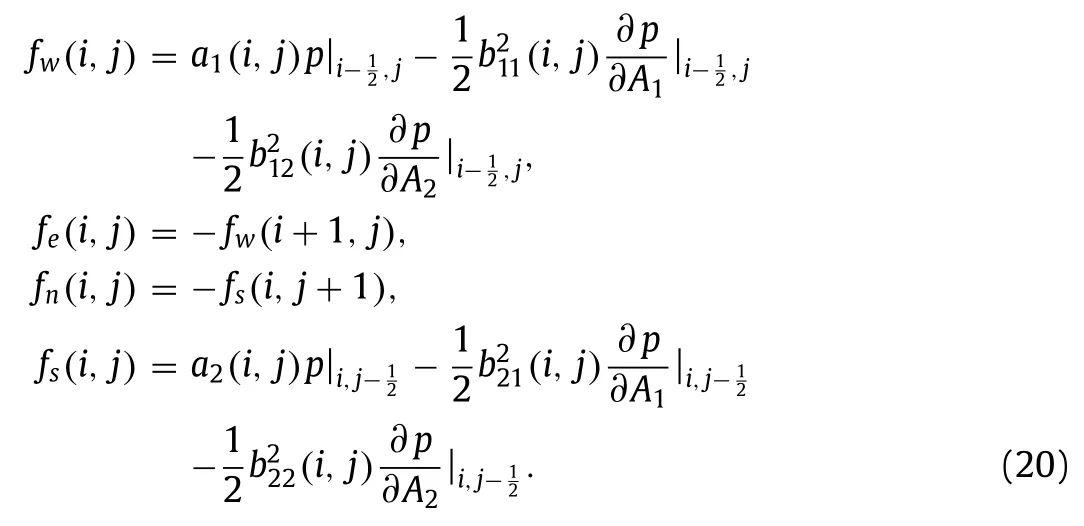
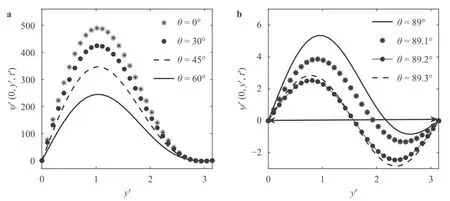
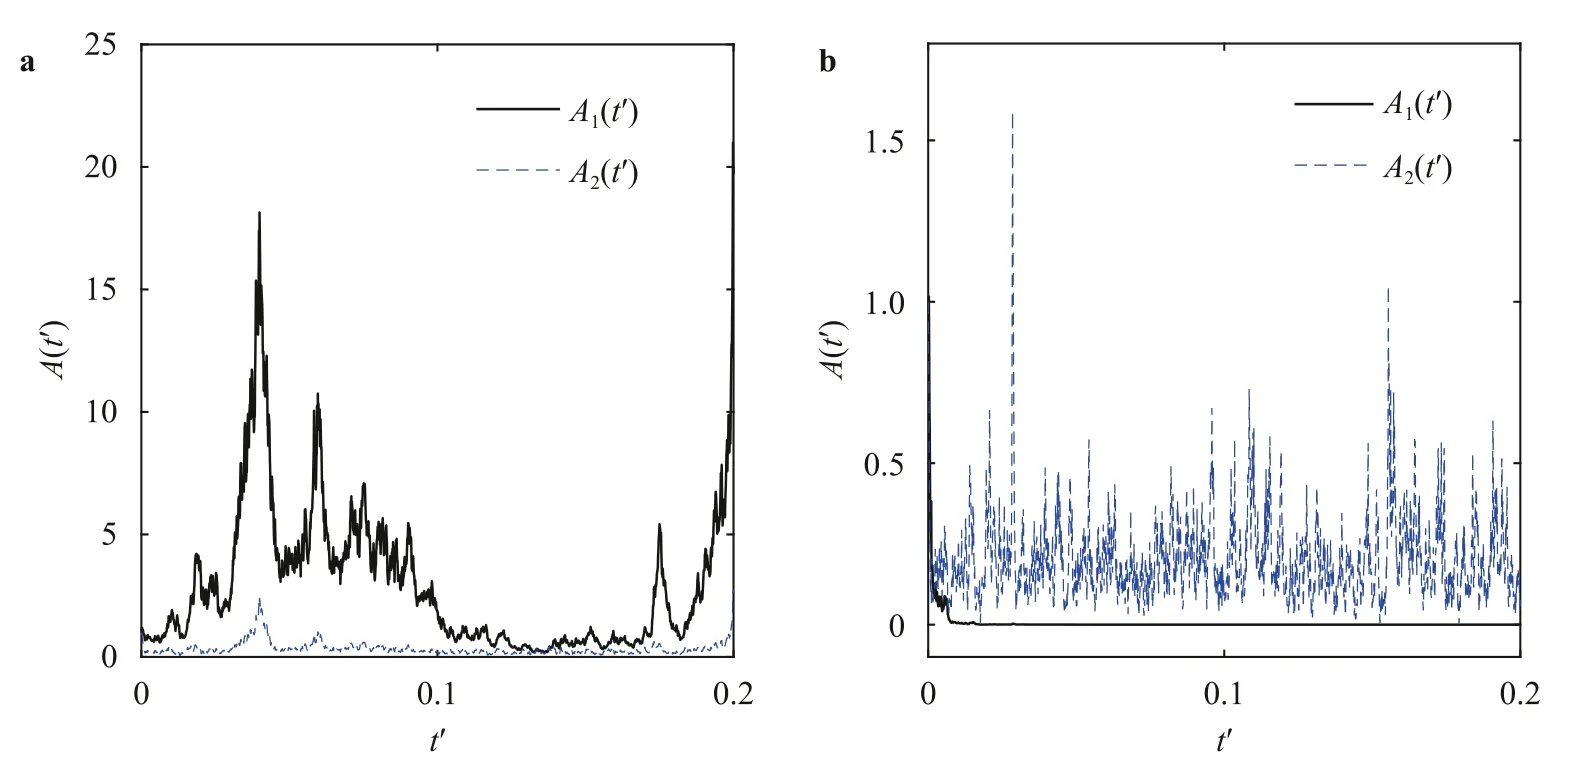
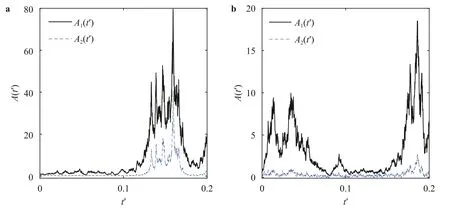
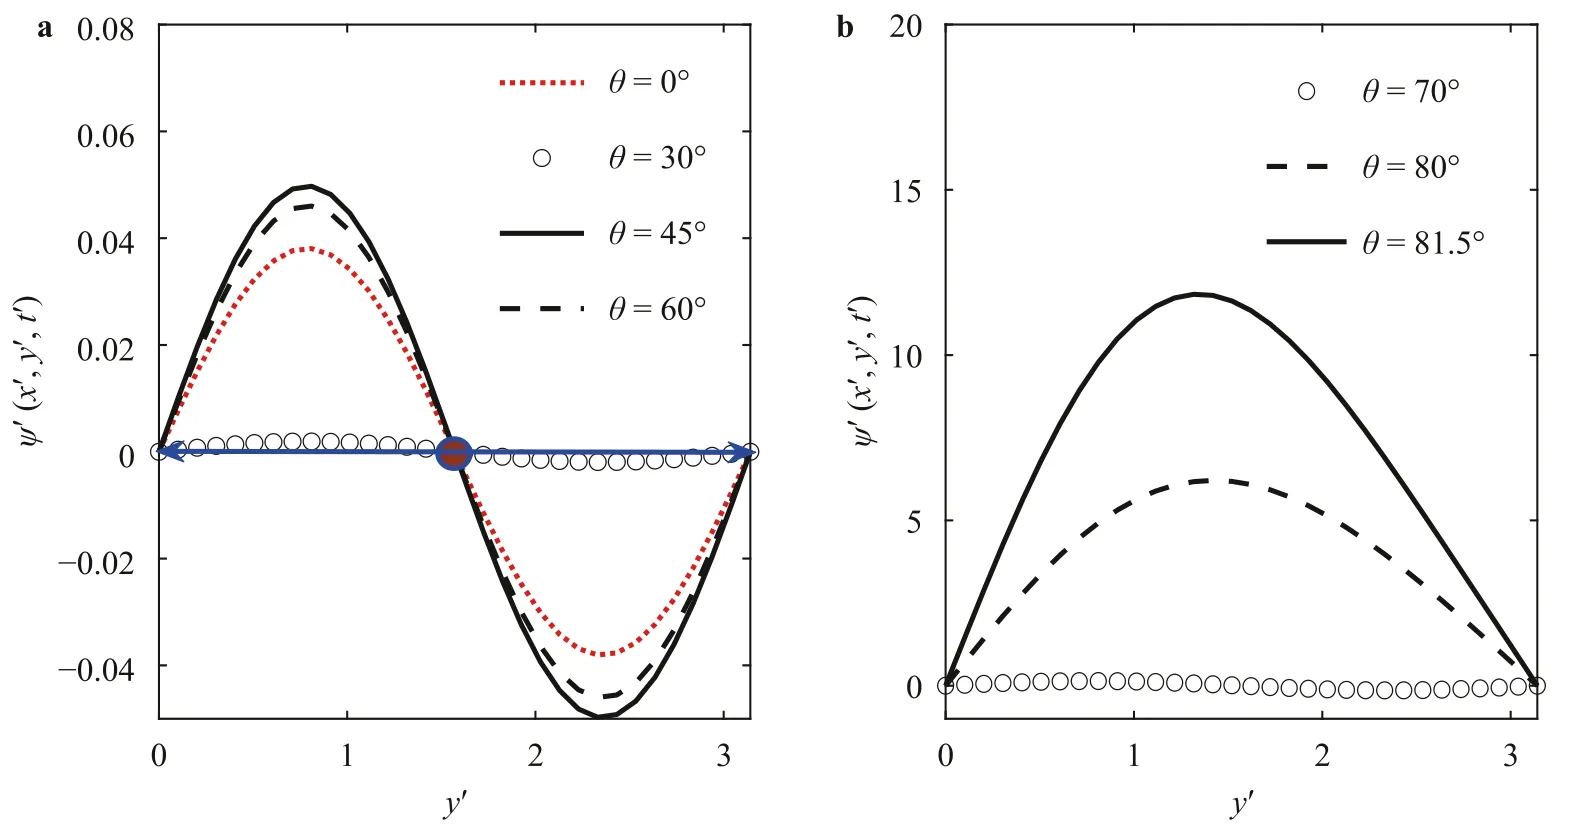
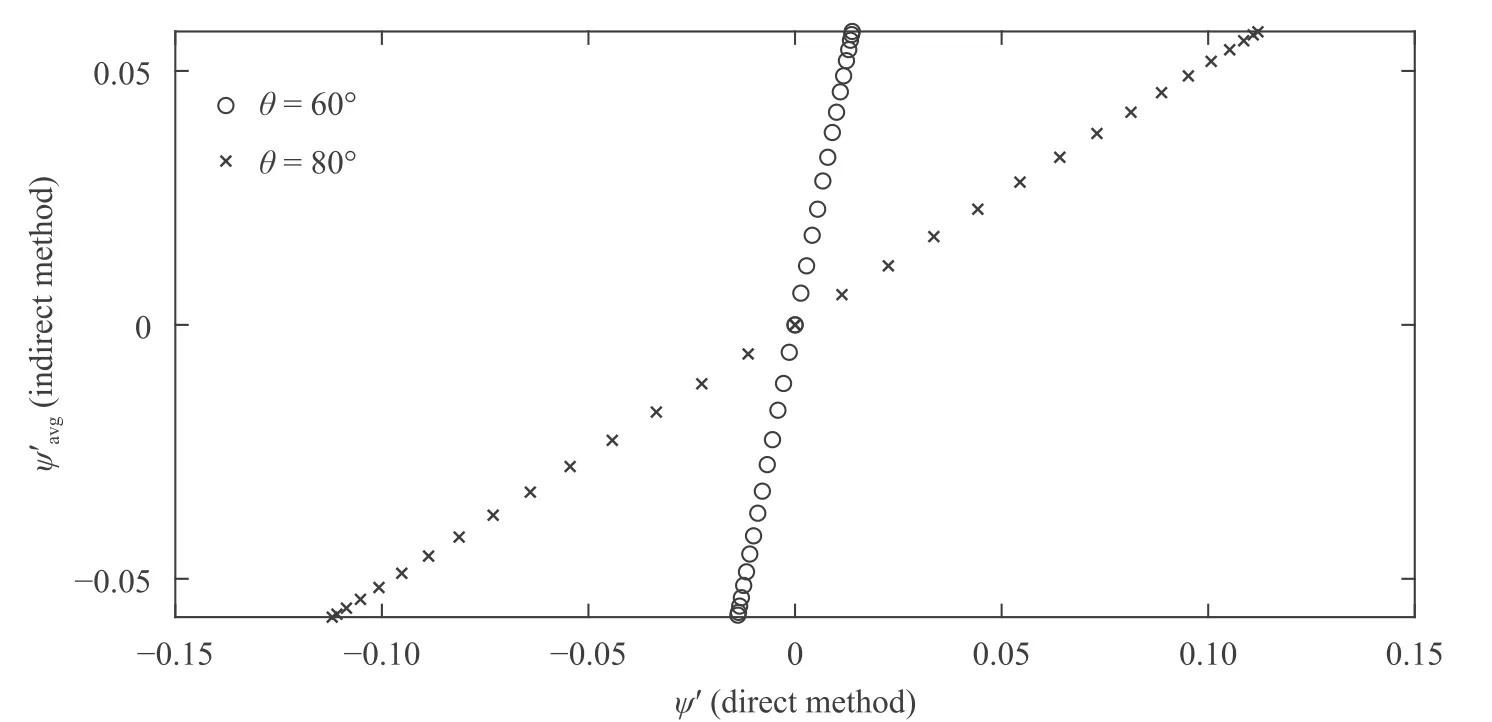
wherec1=0.77,c2=−1.8,c3=16.03,c4=12.97 andc5=−20.This model is deterministic and it can solved by Runge-Kutta method to obtain the approximate solution for every initial valueA0.In particular,forA0=0,A1>0,equilibrium solution is stable when 0 Stochastic perturbations in input parameters lead to reduce model errors in atmospheric and uncertainty in climate.In order to investigate time scales variability and then ocean flow stability,stochastic schemes are proposed for Eq.(10) and are as follows. whereW(t′)is in Wiener process,γis the stochastic coefficient of Coriolis force andηis stochastic coefficient of wind stress.Two numerical schemes are proposed here to solve the stochastic differential equations Eq.(11) inA=(A1,A2).The direct method,the first scheme,which follows the Euler-Maruyama approach is mathematically written as follows. Fig.1.A part of the Grid consists of control volumes (CV). where andnrepresents number of iterative time steps.In the second scheme,the probability density function-based method which uses the Fokker-Planck equation is studied.This is an indirect approach.In order to derive the Fokker-Planck equation in two dimensions,considerA(t′)as the random variable and is given by Then the Fokker-Planck equation in two dimensions is given by Rewriting Eq.(16) and then integrating Eq.(18) over the domainΩ(A1A2plane) and then Gauss divergence theorem leads to the following. The cell-centered finite volume method is used here to solve an integration-based Eq.(19).DivideA1A2plane into discrete control volumes and a node is placed at the center of each control volume.A part of the domain consisting of control volumes is schematically sketched in Fig.1.The boundaries of control volumes are positioned mid-way between adjacent nodes.It is a common practice to set up control volumes near the edge of the domain in such a way that the physical boundaries coincide with control volume boundaries.A general node point is identified byP(i,j)in whichi=1,2,3,...,nalongA1direction andj=1,2,3,...,malongA2direction respectively.Each node has neighbors identified byWthe west,Ethe east,Nthe north andSthe south respectively.Total number of node points arenm.Edges of the control volume are referred to aswthe west,ethe east,nthe north andsthe south respectively.The probability density function at each nodeP(i,j)ispi,j.On each control volume,handkare the edge sizes alongA1andA2 directions respectively.It is important to note that∑pi,j=1.Fluxes through each control volume edge are mathematically presented as follows. The probability density functionpat a boundary point of the control volume is defined in terms of the values ofpat nodes as follows. Similarly,derivatives ofpwith respectA1andA2at boundary points of control volumes are written as follows. From Eq.(19),it emphasizes that the rate of change ofponΩis equal to the sum of fluxes through edges of it.Therefore,on each control volume,Eq.(19) is as follows. Firstly,substitute Eqs.(21) and (22) in Eq.(20) and then substitute Eq.(20) in Eq.(23).Then combining Eq.(23) for alli,j,we get a system of differential equations inpi,j.Since the edges of the plane domain are infinitely large,pi,j=0 ati=1,i=n+1,j=1 andj=m+1.Then the system of differential equations in P=(p1,1,p1,2,...,pm,n)Tare written as follows. where F isnm×nmmatrix of fluxes and P isnmdimensional column vector.Runge Kutta method of order 4 is used to solve Eq.(24).In the present paragraph,discussion on symmetric bifurcation of the flow function that interprets the stability,direct and indirect methods,and their comparison and impact of stochastic control parameters on solution stability are thoroughly discussed. In the deterministic process,stream linesψ′(0,y,t′)alongydirection for various latitudesθ=0◦,30◦,45◦andθ=60◦respectively are plotted in Fig.2a.From the plot,it is observed that streamline follows asymmetric gauss curve initially with high tide and are gradually down as latitude increases. From Fig.2b,it is observed that streamlines follow sinusoidal pattern with asymmetry 0.75 at 89◦.As the latitude increases from 89◦to 89.3◦,the curve asymmetry decreases from 0.75 to 0.5. Fig.2.Stream line ψ (0,y,t) along y at x=0 for latitudes a θ=0◦,30◦,45◦,60◦b θ ≥89◦in deterministic process. Fig.3.Time scales profiles for a γ=0.1 b γ=0.3 when θ=80◦and η=0.1. Fig.4.Time scales behavior for a η=0.2 b η=0.3 when θ=80◦and γ=0.1. The stability of the solution is investigated based on the qualitative behavior of the time scales over small time periods.From Fig.3,it is observed that irregular responses of the time scalesA1(t′)andA2(t′)decrease gradually and sharply asγvalues increase from 0.1 to 0.3 at latitudeθ=80◦.Since both the time scales are convergent,time scale functions are stable. From Fig.4,time scales are distorted with high peaks and are diverged as the values ofωincrease from 0.1 to 0.3.In order to determine the stability of stream function,only converged time scales are considered. At stable time scalesγ=0.3,stream lines are symmetric about the stagnation pointy’=π/2 fromθ=0◦toθ=70◦and are shown in Fig.5a.From the plot,it is clear that the function takes the formCsin(2y),C<1. From Fig.5b,stream lines are of the formDsin(y),D>1 whenθ >70◦.Since there is no stagnation point over the interval 0 Fig.5.ψ (x,y,t) along y at x=0 for latitudes a θ=0◦,30◦,45◦and θ=60◦b θ ≥70◦in direct method. Fig.6.Direct and indirect method comparison. The stream functionψ′by direct method and the average stream functionby indirect method are correlated for latitudesθ=60◦,80◦and are shown in Fig.6.From the plot,it is observed that direct and indirect methods are almost perfectly correlated whenθ=80◦.Based on the results and discussion,the following conclusions are drawn. •In the deterministic process,flow in ocean was unstable due to symmetry about stagnation point. •Atγ=0.3,both the time scales were stable in direct method. •At unstable time scales,results were not discussed. •When 0◦<θ <60◦,there was no flow between upstream and downstream indicated that unstable flow. •Whenθ >70◦,only upstream has been found and hence flow was stable. •It has been concluded that qualitative behavior of solutions by both direct and indirect methods are almost similar but quantitatively different slightly that depends on parameterized values.Computationally,an indirect method is faster but a direct method is accurate. •Finite volume method was used to solve Fokker-Planck equations in two dimensions. Declaration of Competing Interest The authors declare no conflict of interest. Acknowledgment The author is very thankful to Dutch Research Council for funding the project bearing the number 435063. Supplementary materials Supplementary material associated with this article can be found,in the online version,at doi:10.1016/j.taml.2021.100282.







杂志排行
Theoretical & Applied Mechanics Letters的其它文章
- Simplified permeable surface correction for frequency-domain Ffowcs Williams and Hawkings integrals
- Electrothermal analysis of radiofrequency tissue ablation with injectable flexible electrodes considering bio-heat transfer
- End-to-end differentiable learning of turbulence models from indirect observations
- On the capability of the curvilinear immersed boundary method in predicting near-wall turbulence of turbulent channel flows
- Theory of adaptive mechanical drive
- Tunnel effects on ring road traffic flow based on an urgent-gentle class traffic model
