Complexity analysis of the Portevin-Le Chatelier in an Al alloy at different temperatures
2021-07-30JianfeiXuGuoxiongChenShihuaFu
Jianfei Xu, Guoxiong Chen, Shihua Fu
School of Civil Engineering and Architecture, Hainan University, Haikou 570228, China
Keywords: Portevin-Le Chatelier effect Dynamic strain aging Complexity Modified multiscale entropy
A B S T R A C T The complexity of the Portevin-Le Chatelier (PLC) effect in an Al alloy at different temperatures was analyzed by modified multiscale entropy. The results show that three evolutions of entropy with scale factor,i.e., near zero, monotonically increasing and peak-shape, were observed corresponding to the smooth curves, type-A serrations and type-B/-C serrations, respectively. The scale factor at the peak was onethird of the average serration period. The sample entropy increased initially and then decreased with temperature, which was opposite to the critical strain. It is also suggested that the type-A serrations corresponded to self-organized criticality and the type-B/-C serrations corresponded to chaos through the evolutions of entropy with scale factor.
The Portevin-Le Chatelier (PLC) effect [1–3] is commonly observed in many alloys within a certain range of temperatures and strain rates. This phenomenon is manifested as serrations of the stress-strain curve and a localized deformation band on the specimen surface (termed the PLC band). The PLC effect is usually associated with dynamic strain aging [4–6] , i.e., the interaction between solute atoms and mobile dislocations. When the mobile dislocations are arrested temporarily at obstacles, the solute atoms diffuse to the mobile dislocations and form a solute atmosphere to pin them. This additional solute atmosphere shifts the stress upwards. The mobile dislocations break away from solute atmospheres by thermal activation. This unpinning decreases the stress.The repeated pinning and unpinning results in a series of serrations in the stress–strain curve.
According to the stress serration morphology or propagation characteristics of the PLC bands, the PLC effect can be divided into three types [7–9] . At low temperatures and high strain rates, type-A serrations are sparsely located above the stress envelope with a small amplitude, which corresponds to the continuous propagation of type-A PLC bands. At intermediate temperatures and strain rates,the type-B serrations vibrate densely between the upper and lower stress envelopes with a medium amplitude, which corresponds to hopping propagation of type-B PLC bands. At high temperatures and low strain rates, type-C serrations are located densely below the stress envelope with large amplitudes, which correspond to a random nucleation of type-C PLC bands.
Because the PLC effect is affected by many factors, such as the solute concentration, diffusion coefficient, diffusion mode, precipitate content, stacking fault energy and dislocation density [10–15] , the PLC effect can be considered as a huge complex system.Some nonlinear analysis methods were used to study this complex system. The calculation of correlation dimension and Lyapunov spectrum revealed a transition of PLC effect from chaos to self-organized criticality with an increase in strain rate [ 16 , 17 ]. The multifractal spectrum showed that a peak appeared at the boundary between the type-A and -B PLC effect, and the analytical results indicate that type-B and -A serration correspond to chaos and a self-organized criticality, respectively [18–20] .
Sample entropy is a high efficiency and accurate method to evaluate the complexity of time sequences, and has been applied in physiology [21] , hydrology [22] and other fields. The multiscale entropy [ 23 , 24 ] method that has been developed based on sample entropy expands the sample entropy to multiple time scales and shows the evolution of entropy with scale factor. An analysis of the multiscale entropy method on stress sequences at different strain rates showed that the entropy of a type-C serration was lower than that of type-A and -B serrations at all scales [25] and the dynamics of the PLC effect were more complex in the interstitial alloy than in the substitution alloy [26] . This method is also used to study the complexity of serrated flows in bulk metallic glass and the complexity of the serration behavior increases with strain rate [27] .
In addition to the strain rate mentioned above, temperature also has an important effect on the PLC effect. However, there has been no effort to quantify the complexity of the PLC effect observed at different temperatures. Evaluating the complexity of time series from a physical process has potential value for constructing dynamic models of the system. In this work, the modified multiscale entropy (MMSE) method was applied to evaluate the complexity of the PLC effect at different temperatures. The present work will advance the fundamental understanding of the complexity of the PLC effect in temperature domain.
The sample entropy can be considered as the dissimilarity of the matches of a sequence at two adjacent dimensions, where self-matches are not included [28] . The multiscale entropy is the sample entropy of the coarse-grained time sequences with different width. MMSE is an improved algorithm of multiscale entropy[ 29 , 30 ]. The calculation steps are:
1 Given a one-dimensional time sequence that is sampled at equal intervals {x1,x2,···xi,···xN} , and the coarse-grained seriesyτis obtained,

where the scale factorτis the width for coarse-grained of the time sequences.
1 Construct an m-dimensional vectorwhere theith vector is:

whereδis the time delay andmis the embedding dimension.
1 For eachi, calculate the distancebetweenand the rest vectorthat is, the maximum absolute value of the difference between two vector elements:

The conditioni+τ≤jensures the non-overlapping segments between the two coarse-grained element
1 Set the similarity tolerancer. Ifis less thanr, a similarity exists between vectorandForeachi, thenumberof matches

2 Sum the number of matchesthat correspond to alli,

3 Add the dimension by 1 and repeat steps (2–5) to obtain the number of matches betweenm+ 1 dimension vectorsnm+1,τ.
4 For the coarse-grained sequence,yτcorresponds to eachτand the entropy is calculated as:

Usually, the embedded dimensionm= 2 and the similarity toleranceris 0.15 times the standard deviation of the original time sequences [ 23 , 27 ]. The entropy forτ= 1 is the sample entropy of the original time sequences.
Fig. 1 presents the stress-time curves of 5456Al alloys at different temperatures in Ref [30] . The temperature range of the tensile tests was 173–333 K and the nominal strain rate was 5.4 ×10⁻⁴s–1 with a sampling frequency of 50 Hz. The stress-time curves indicate the PLC effect was present at 223-323 K. According to the serration morphology, type-A, -B, and -C serrations appeared in temperature range of 223–248 K, 273–298 K and 310–323 K, respectively. To ensure the consistency at different temperatures and exclude the influence of Lüders plateau and necking, the data analyzed were limited to the two dash line.
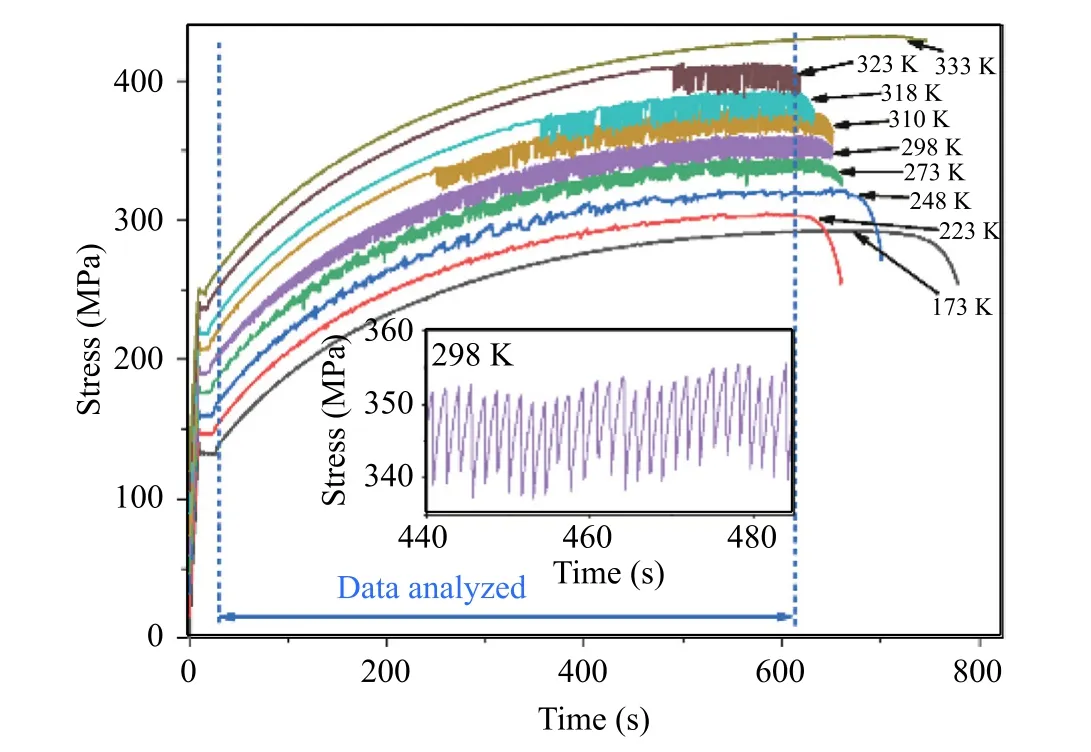
Fig. 1. Stress–strain curves at different temperatures (shifted by 15 MPa for a better view). Inset: local enlarged image at 298 K.
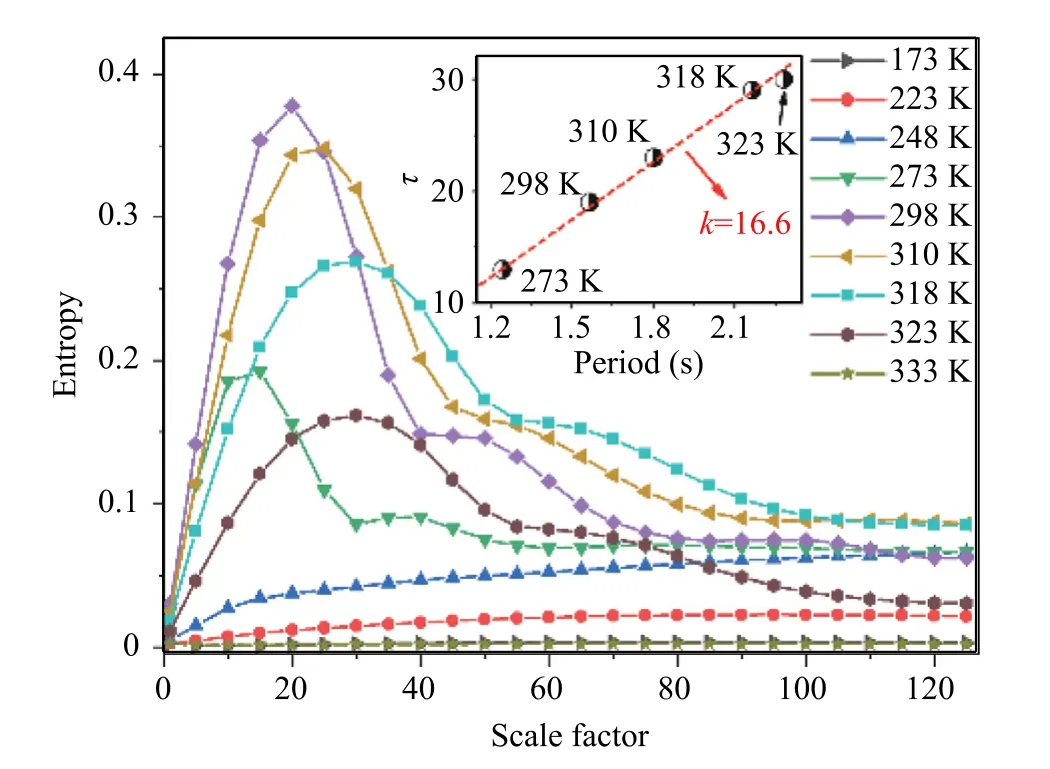
Fig. 2. MMSE results of stress curves with temperature. Inset: plots of scale factor τat peak with average serration period.
The results of the MMSE analysis are shown in Fig. 2 . Three evolutions of entropy with scale factor were observed: (1) near zero at 173 and 333 K, which corresponded to the smooth curves;(2)monotonically increasing at 223–248 K, which corresponded to type-A serrations; (3) peak-shape at 273–323 K, which corresponded to type-B/-C serrations. In addition, with increasing temperature from 273 to 323 K, the entropy of the peak increased initially and then decrease, while the scale factor of the peak increased monotonically.
A scale factorτcorresponds to a time scaletwith a sampling frequencyf, and one getsτ=tf. Therefore, the scale factor at the peak of the entropy evolution is associated with a characteristic time scale. Meanwhile, a key time parameter of the PLC effect is the serration period. As shown in the inset of Fig. 2 , the time scale(τ/f) at the peak was approximately 1/3 of the average serration period. The serrated curve can be regarded as a sawtooth wave (inset of Fig. 1 ). The autocorrelation coefficient of a sawtooth wave reaches a maximum at a period and a minimum at half a period.However, the scale factor at the peak was neither a period nor half a period. The dropping time is very short and can be ignored in the serration period. However, the dropping time reflects the duration of the unpinning process, which brings an increase of the entropy. The scale factor of the maximum entropy would be somewhat closer to the dropping time. The contribution of the pinning and unpinning is a non-linear superposition. The internal mechanism requires further study.
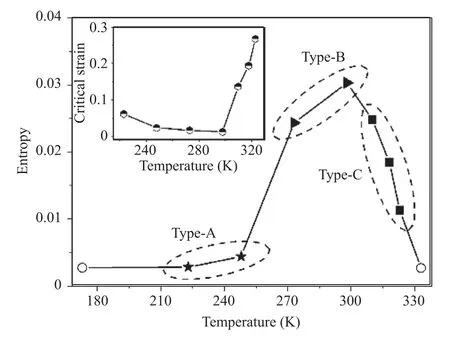
Fig. 3. Plots of sample entropy with temperature. Inset: plots of critical strain with temperature.
The entropy at scale factor one is the sample entropy, which describes the complexity of the original time sequences (without coarse-grained). Figure 3 shows that the sample entropy increased initially and then decreased with temperature. The maximum sample entropy occurred at 298 K. Interestingly, the evolution of sample entropy was opposite to the critical strain, which represents the onset of the PLC effect. As shown in the inset of Fig. 3 , the decreasing branch before 298 K is a normal critical behavior, while the increasing branch after 298 K is an inverse critical behavior[31] .
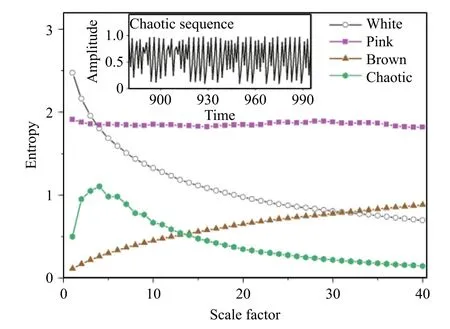
Fig. 4. MMSE analysis of several typical signals (white, pink, brown and chaotic sequence). Inset: morphology of the chaotic sequence.
Obviously, the occurrence of PLC effects raises the entropy due to the additional interaction between solute atoms and mobile dislocations. The diffusion of solute atoms increases with increasing temperature, which makes the additional interaction more intense and more frequent. As a result, larger and denser serrations are observed in the stress curve, and meanwhile, the system becomes more complex. Thus, the sample entropy increases with increasing temperature from 173 to 298 K. When the temperature exceeded 298 K, the critical strain is a relatively high value. In this case, the entire curve was divided into two parts: a smooth section (before the critical strain) and a serrated section (after the critical strain).The sample entropy of the smooth section (at 173 and 333 K) is near zero, while that of the serrated section is a high value. The sample entropy of the entire curve depends on the ratio of these two sections. The increase in critical strain lengthened the smooth section and shortened the serrated section. Therefore, the sample entropy decreased with increasing temperature from 298 to 333 K.
Figure 4 shows the evolutions of entropy with scale factor for several typical signals, i.e., a white noise, a pink noise, a brown noise and a chaotic sequence from the logistic mapxn+1 =μxn(1 −xn)withμ= 3.9 andx0 = 0.32 . The entropy of white noise decreased monotonously with an increase in scale, which indicated that the main information that was contained in the original signal was only at a small time scale. The entropy of pink noise was maintained at 1.8, which indicated that pink noise has the same dynamic characteristics at any scale. The entropy of brown noise increased monotonically with the scale factor, which indicated that the time sequence had higher complex structural characteristics at a large scale. The entropy of the chaotic sequence increased firstly and then decreased with scale factor, which indicated that this time sequence was only highly complex at a specific time scale.
The type-A serrations presents the same entropy trend as the brown noise, while the entropy evolutions of the type-B/-C serrations are similar to that of the chaotic sequence. Moreover, the morphology of the chaotic sequence parallels to that of type-B/-C serrations. The previous work by statistical analysis revealed that type-A serrations correspond to self-organized criticality, and type-B/-C serrations correspond to chaos [16–19] . The two phenomena can be also distinguished through the evolution of entropy with scale factor.
As mentioned above, the dropping time is a key parameter and is usually ignored in the statistical analysis. Besides, the statistical analysis does not take into account the work hardening, which affects the PLC effect by influencing the dislocations. Furthermore,let’s assume simply two states for the solute atoms: random distribution in matrix and concentrated distribution around dislocations.For each state, the solute atoms are statistically uniform for an enough long duration (a characteristic time). Obviously, the characteristic times for the two states are different. The MMSE method not only takes into account these factors as a whole system, but also presents the complexity at multiple time scales, which might not be able to detect by statistical analysis.
In summary, the MMSE method was used to study the complexity of the PLC effect in 5456Al alloy at different temperatures.The evolution of entropy with scale factor showed three types:near zero that corresponded to smooth curves without a PLC effect, monotonically increasing that corresponded to type-A serrations and peak-shape that corresponded to type-B/-C serrations.The scale factor at the peak was one-third of the average serration period. The sample entropy increased initially and then decreases with temperature, which is opposite to the critical strain.The increase of sample entropy is due to the enhanced interaction between solute atoms and mobile dislocations with increasing temperatures from 173 to 298 K, while the decrease is attributed to that a larger critical strain extends the smooth section with increasing temperatures from 298 to 333 K. Furthermore, the type-A serrations with self-organized criticality and the type-B/-C serrations with chaos are respectively characterized through the evolution of entropy with scale factor.
Declaration of Competing Interest
The Authors declare that they have no known competing financial interests or personal relationships that could have appeared to influence the work reported in this paper.
Acknowledgements
The authors are grateful for support from the National Natural Science Foundation of China (Grant no. 11802080) and the Nature Science Foundation of Hainan Province, China (Grant nos.118QN182 and520CXTD433 ).
杂志排行
Theoretical & Applied Mechanics Letters的其它文章
- Bifurcation mechanism of interfacial electrohydrodynamic gravity-capillary waves near the minimum phase speed under a horizontal electric field
- Research on refined reconstruction method of airfoil pressure based on compressed sensing
- Analytical solutions for sediment concentration in waves based on linear diffusivity
- Design of crashworthy attenuator structures as a part of vehicle safety against impact: Application of waste aluminum can-based material
- Derivation of FFT numerical bounds of the effective properties of composites and polycristals
- A model for universal spatial variations of temperature fluctuations in turbulent Rayleigh-Bénard convection
