Constraine d large-e ddy simulation of turbulent flow over inhomogeneous rough surfaces
2021-07-29WenZhngMinpingWnZhenhuXiJinhunWngXiyunLuShiyiChen
Wen Zhng ,Minping Wn ,b ,* ,Zhenhu Xi ,Jinhun Wng ,b ,Xiyun Lu,Shiyi Chen ,b,*
a Guangdong Provincial Key Laboratory of Turbulence Research and Applications, Department of Mechanics and Aerospace Engineering, Southern University of Science and Technology, Shenzhen 518055, China
b Southern Marine Science and Engineering Guangdong Laboratory (Guangzhou), Guangzhou 511458, China
c Department of Engineering Mechanics, Zhejiang University, Hangzhou 310027, China
d Department of Modern Mechanics, University of Science and Technology of China, Hefei 230026, China
Keywords: Wall turbulence Large-eddy simulation Roughness Inhomogeneity
ABSTRACT In this work we extend the method of the constrained large-eddy simulation (CLES) to simulate the tur-bulent flow over inhomogeneous rough walls.In the original concept of CLES,the subgrid-scale (SGS) stress is constrained so that the mean part and the fluctuation part of the SGS stress can be modelled separately to improve the accuracy of the simulation result.Here in the simulation of the rough-wall flows,we propose to interpret the extra stress terms in the CLES formulation as the roughness-induced stress so that the roughness inhomogeneity can be incorporated by modifying the formulation of the constrained SGS stress.This is examined with the simulations of the channel flow with the spanwise alternating high/low roughness strips.Then the CLES method is employed to investigate the temporal response of the turbulence to the change of the wall condition from rough to smooth.We demonstrate that the temporal development of the internal boundary layer is just similar to that in a spatial rough-to-smooth transition process,and the spanwise roughness inhomogeneity has little impact on the transition process.
A wide range of industrial and geophysical flows are bounded by rough walls.The surface roughness brings significant changes to the flow properties [1] .The flow over the inhomogeneous rough walls has attracted much attention recently.
Recently,Mejia-Alvarez and Christensen [2] found that the large-scale spanwise heterogeneity of the surface roughness can generate the stationary high-and low-momentum paths in the wall turbulence.Barros and Christensen [3] identified this heterogeneity-induced secondary flow in form of the streamwise large-scale counter-rotating vortices.Willingham et al.[4] found that the width of the high/low roughness strips has a strong impact on the secondary flow pattern.The parametric studies of Vanderwel and Ganapathisubramani [5],Yang and Anderson [6] demonstrated that the strength of the secondary flow is maxi-mized when the spanwise spacing is roughly equal to the bound-ary layer thickness.Anderson et al.[7] attributed the generation of the secondary flow to the extreme peaks of surface stress and associated elevated turbulence production in the fluid immedi-ately above the relatively high-roughness regions.Beside the sur-face roughness,the secondary flows induced by other forms of the spanwise variation of the wall are also observed [ 8 -11 ].
When a streamwise step change occurs in surface roughness,the turbulent flow can not adapt immediately and evolves into a non-equilibrium state.The outer layer flow remains almost un-changed [12],while an internal boundary layer develops in the near-wall region before the final equilibrium state is recovered [ 13,14 ].The recovery of the wall turbulence is very slow [15-18] .Is-mail et al.[17] estimated that the distance for the complete recov-ery of the turbulent stresses is approximately 20h-25h(his the half channel width),and the distance for the mean velocity to be fully recovered could be as long as 50h.Li et al.[19] found that the viscous region recovers almost immediately after the rough-to-smooth step change while the buffer region and beyond will re-cover in a longer distance.Understanding the growth of the in-ternal boundary layer is helpful in developing empirical models [20] to predict the mean velocity distribution during the roughto-smooth transition process.
Large-eddy simulation method has shown its advantage in predicting the turbulent flow with a relatively low cost.Usually wall models are needed to tackle the complex wall condition [21-23].Previously it is found that the behavior of turbulence can be accurately predicted when the subgrid-scale (SGS) stress is properly constrained in the simulation [24-26].Chen et al.[27] proposed a constrained large-eddy simulation (CLES) method for the simulation the wall-bounded turbulence so that in the simulation both the mean flow and the turbulence fluctuations can be accurately predicted even if a relatively coarse grid is used.The CLES method is further developed to simulate the flow with massive separation [28],the compressible flow [29-31],and the laminar-turbulent transition process [32].The CLES has also been applied in the engineering applications,such as in the simulation of the flow around a full-scale commercial aircraft [33].
In our previous work [34],the CLES method is used in the simulation of the turbulent flow over the homogeneous rough walls.It is found that the roughness effect on the wall turbulence can be correctly reproduced by imposing the rough-wall-like mean shear in the near-wall region without resolving the roughness elements.In this letter we extend the CLES method to simulate the turbulent flow over the inhomogeneous rough walls.First,we modified the formulation of the constrained SGS stress by incorporating the effect of the roughness inhomogeneity.Second,we use CLES to investigate the response of the wall turbulence to the change of the wall condition from rough to smooth.
In CLES the following low-pass filtered equations for the incompressible flows are solved in non-dimensional form
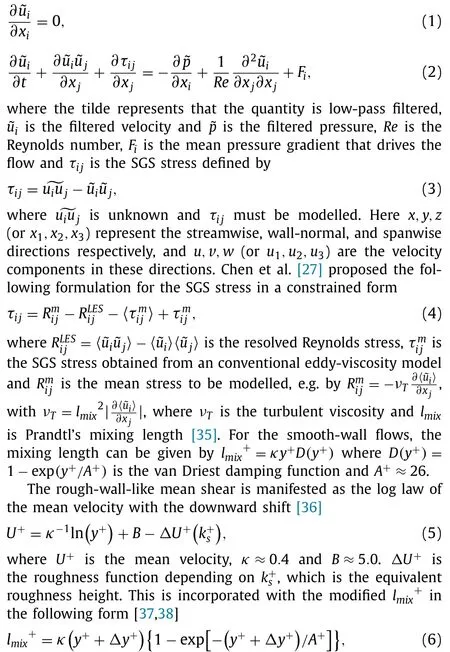
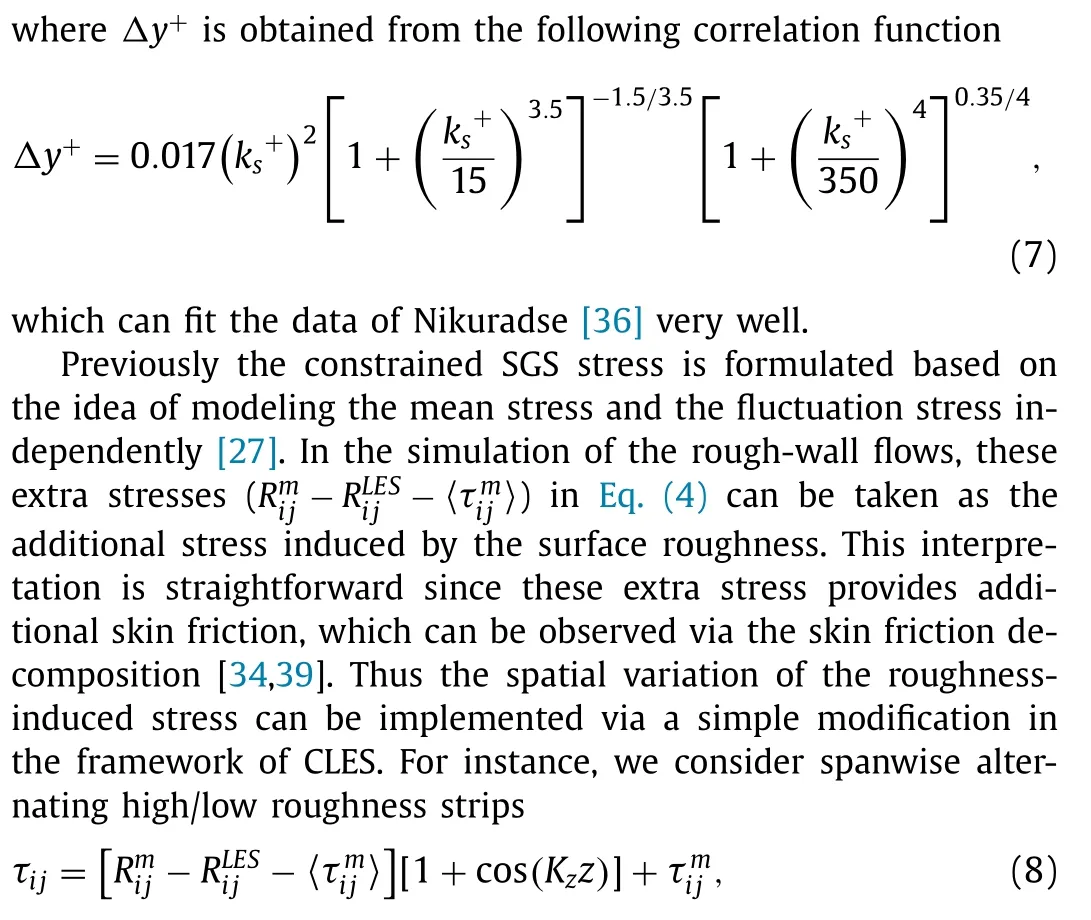
whereKzis the parameter controls the wave number of the spanwise variation.The high roughness strip is located at the spanwise position with cos(Kzz)=1,and the low roughness strip is at the position with cos(Kzz)=-1 where the wall is smooth since the SGS stress is equal toThus a largerKzmeans a smaller spacing of the high/low roughness strips.Furthermore,if the spanwise size of the simulation domain is equal to 2π andKzis an integer,the spanwise average ofτijwill be equal to that of the homogeneously constrained SGS stress.
Three test cases withKz=1,2,4 corresponding to different widths of the high/low roughness strips are simulated in channel flows atReτ=590 with=60.The domain size is 4πh×2πh× 2h,wherehis the half channel width.The filtered equations are solved using a Fourier-Chebyshev pseudo-spectral method with the 2/3 rule for de-aliasing.is calculated with the scale-dependent Lagrangian-averaged dynamic model [40],which is effective in simulating the flow in non-equilibrium states.64 ×65 × 64 grid points are used in streamwise,wall-normal and spanwise direction,respectively.This resolution has been demonstrated to be enough to simulate the flow accurately in both the rough and smooth wall conditions [34].The time-averaged statistics are obtained using 4000 snapshots within 40 large-eddyturnover times after the flow is fully developed.
The spatial-temporal averaged streamwise velocity profiles are shown in Fig.1.The downward shift of the mean velocity profile is correctly obtained using the modified formulation in Eq.(8).The mean velocity profile obtained with differentKzare almost the same and only very slight difference of the wake strength can be observed in the center region of the channel.It indicates the inhomogeneous constraint may have changed the large scale structures [42].
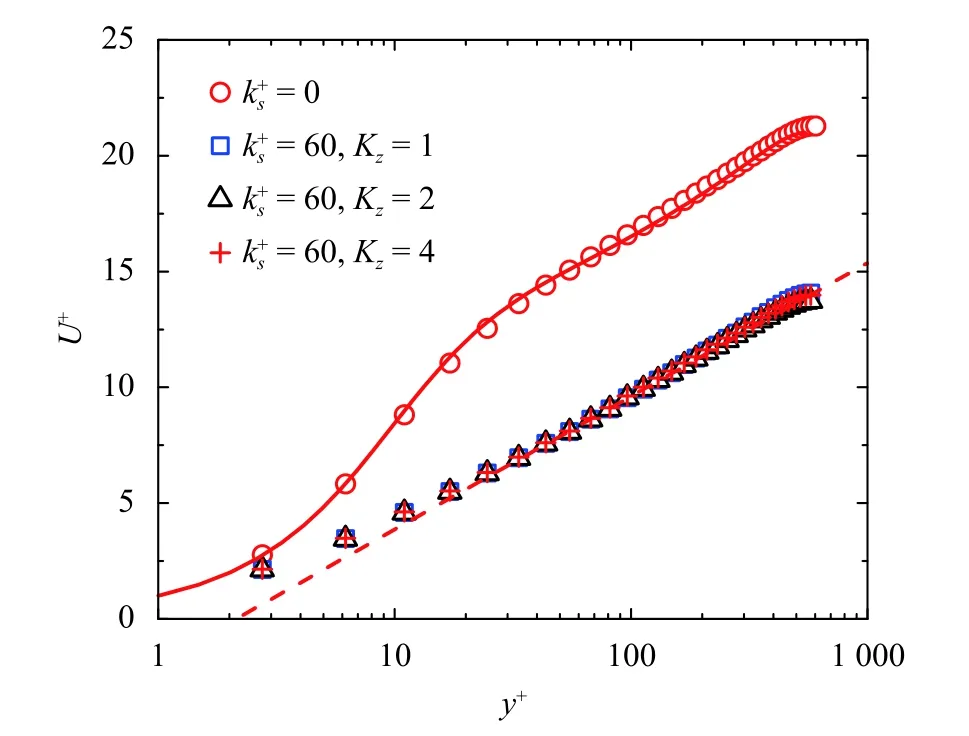
Fig.1. Spatial-temporal average of the streamwise velocity profile of the inhomo-geneous rough wall flows ( =60,K z=1,2,4).The mean velocity profile of the smooth wall flow (=0) is also plotted.The solid line is the DNS result of the smooth wall flow [41] and the dashed line is the expected log law with the downward shift for=60.
The secondary flow can be observed from the contours of the temporal-averaged streamwise vorticity as shown in Fig.2.The vector of the temporal-averaged spanwise and wall-normal velocity is presented by the arrows,which identifies the counterrotating secondary vortices.WhenKz=1,the secondary flow is limited by the channel and the counter-rotating vortices appear to be squeezed in the wall-normal direction as shown in Fig.2a.The strong secondary flow can be observed when theKz=2 and the spacing of the high/low roughness strip is close to the half channel width.The spacing of the high/low roughness strips decreases whenKzis increased from 2 to 4,and the scale of the secondary vortices becomes smaller as shown in Fig.2b and 2c.Generally the results are consistent with the previous parametric studies of Vanderwel and Ganapathisubramani [5],Yang and Anderson [6].It also indicates the effect of the roughness inhomogeneity has been successfully incorporated in the present modification of the constrained SGS stress.
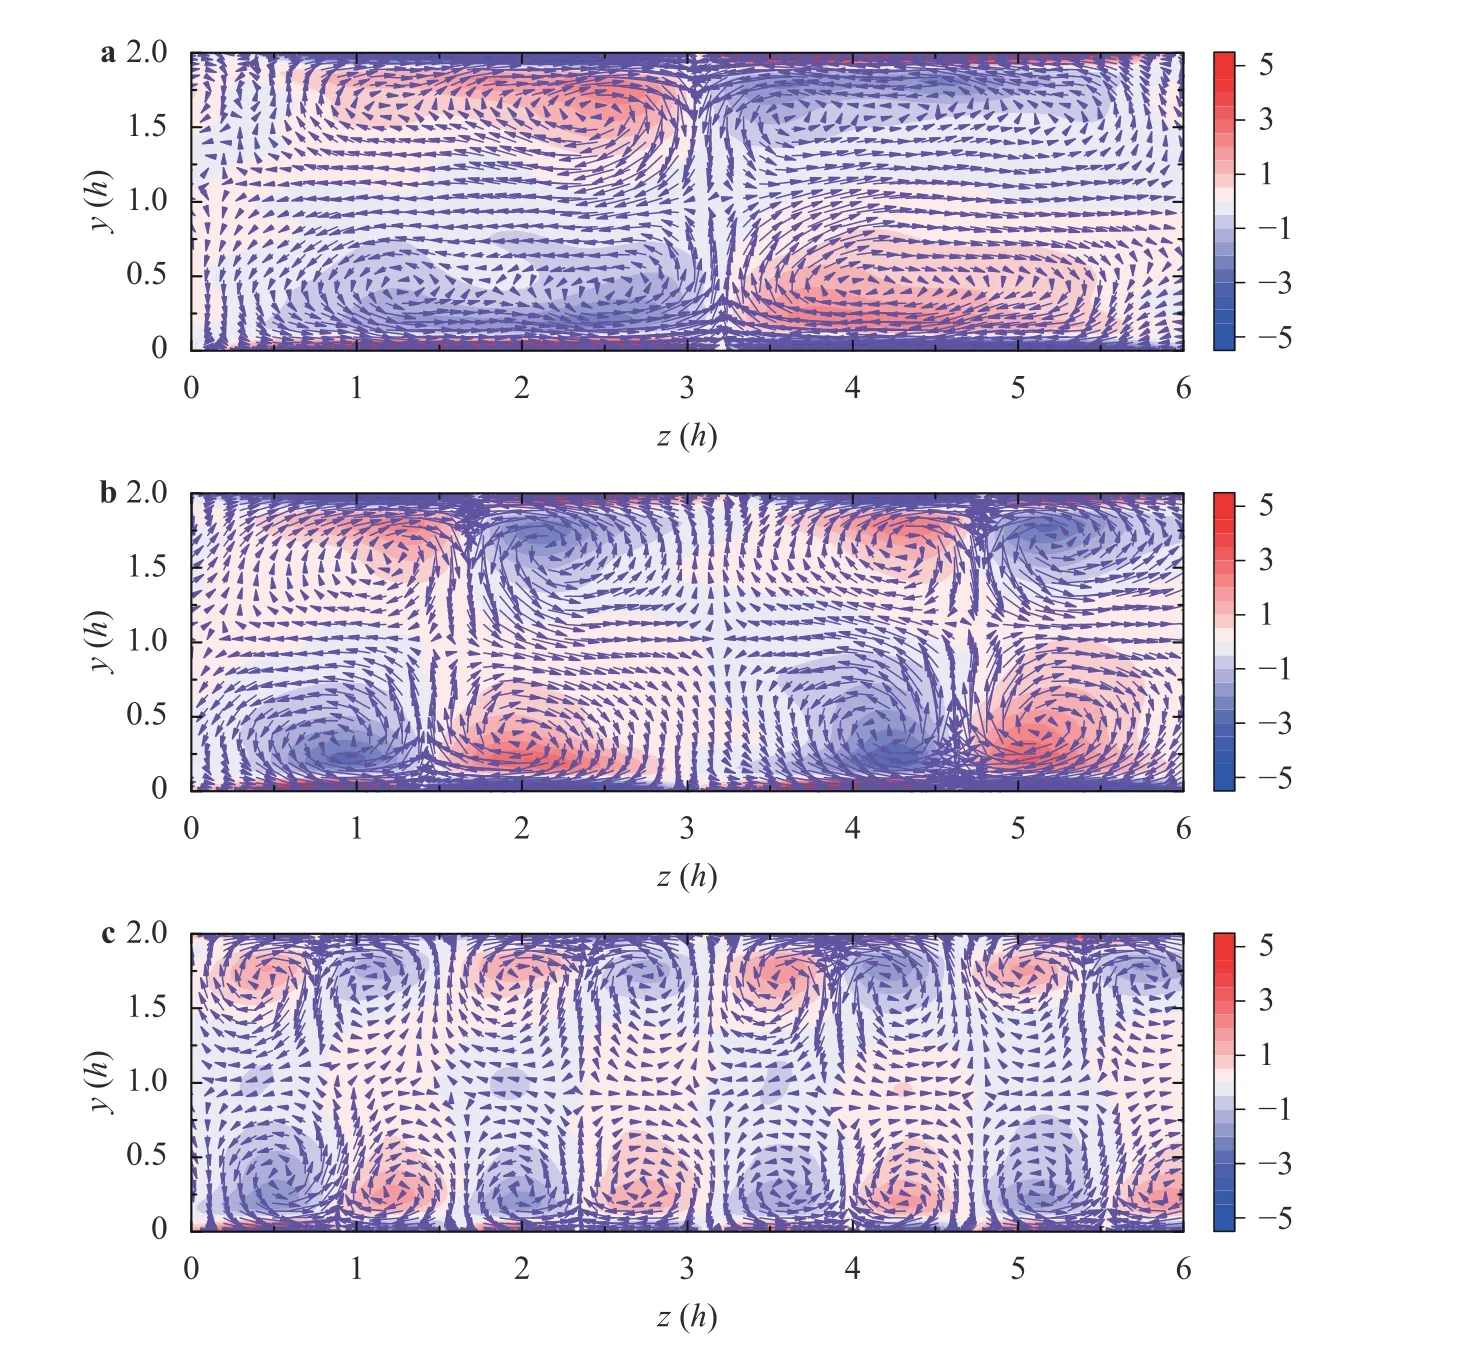
Fig.2. Contour of the temporal average of the streamwise vorticity and the arrows represent the mean spanwise and vertical velocities in (y, z) cross-section for a K z=1,b K z=2,and c K z=4.
Then we investigate the response of the turbulence to the temporal step change of surface roughness using CLES.First we run the simulation to obtain a rough-wall flow in fully developed state(with and without the spanwise inhomogeneity) as the initial condition of the rough-to-smooth transition.The simulation setup is the same with that used in the cases above.Then the constraint on the SGS stress is removed so that the flow is simulated just like the unconstrained smooth-wall case.Finally the flow will recover to the smooth-wall state.Equation (8) is used withKz=2 to generate the initial condition for the inhomogeneous case.
In the rough-to-smooth transition process,the spatial-averaged velocity profile starts to recover from the rough-wall state with a downward shift to the smooth-wall state as shown in Fig.3.Initially the change of the velocity profile occurs in the near wall region beforeTR2S=2 (TR2Sis the non-dimensional time since the beginning of the transition).This is consistent with the experimental findings of Li et al.[19],in which they found the viscous region recovers almost immediately after the rough-to-smooth transition.After a long time the flow reaches the smooth-wall state at aboutTR2S=40 according to the mean velocity profile.It also indicates that a long simulation domain must be used if the spatial roughto-smooth transition process is considered.
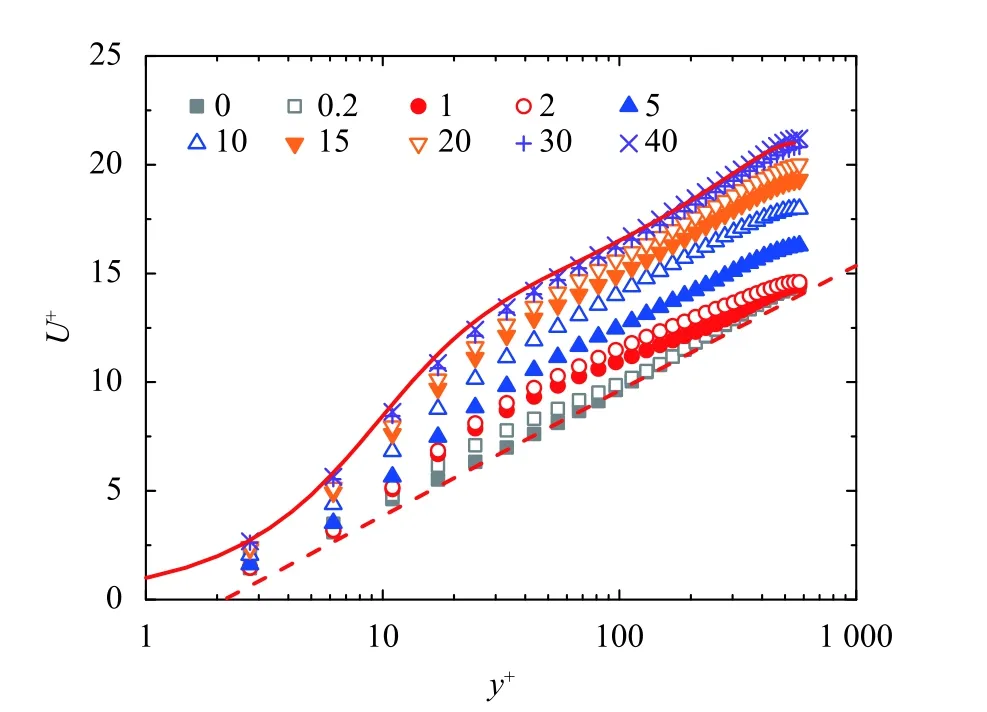
Fig.3. Spatial-averaged streamwise velocity profile in the temporal rough-tosmooth transition process starting from the uniform rough-wall flow with T R2S from 0 to 40.The dashed line represents the expected log law for the rough-wall flow and the solid line is the DNS result of the smooth-wall flow [41].
Typically(h/Ub)∂U/∂x=0 is used to characterize the outer edge of the internal boundary in the spatial rough-to-smooth transition in channel flows [18].Here a modified definition∂(U/Ub)/∂T=0 can be used to adapt the temporal evolution of the flow.The contours of∂(U/Ub)/∂Tobtained from one single run and from the average of 16 runs of the rough-to-smooth transition starting from the homogeneous rough-wall flow are shown in Fig.4a and 4b.It can be observed that the normalized velocity(U/Ub) is accelerated in the near-wall region but decelerated in the center region of the channel.This is similar to the spatial roughto-smooth transition process [18].The outer edge of the internal boundary layer can be identified with the definition∂(U/Ub)/∂Tas marked with the open symbols in Fig.4a and 4b.
The average growth of the internal boundary layer thickness(δin) is plotted in Fig.5.In the initial stage (TR2S<0.8),the growth ofδinfollows the power law in the homogeneous roughness case and the growth rate obtained from the fitted line is about 0.39.This behavior is very close to the result obtained from the spatial rough-to-smooth transition in previous research [18].The growth process ofδinobtained from the inhomogeneous initial flow agrees with the one obtained from the homogeneous initial condition within the uncertainty,which indicates the inhomogeneity of roughness does not have a significant impact on the roughto-smooth transition.
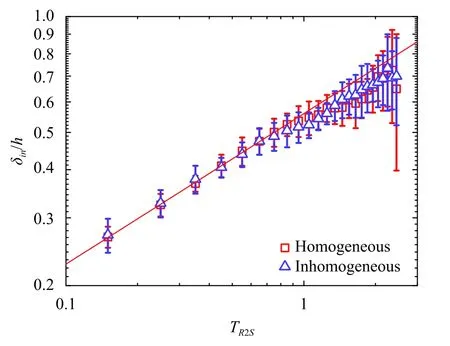
Fig.5. Growth of the thickness of the internal boundary layer (δin) during the rough-to-smooth transition process starting from the uniform and non-uniform rough-wall flow.The error bar represents the standard deviation obtained from the 16 runs.The growth of δin is fitted as shown by the solid line with the slope of 0.39.
In this work,we extended the method of the CLES to simulate the inhomogeneous rough-wall flows.The extra terms in the formulation of the constrained SGS stress are interpreted as the resistance caused by the roughness and the effect of the roughness inhomogeneity is incorporated based on this interpretation.This modification is tested in simulating the channel flow with the spanwise alternating high/low roughness strips.The secondary circulation induced by the roughness inhomogeneity is observed and the scale of the secondary vortices is found to be affected by the spanwise spacing of the roughness strips and the channel height,which is consistent with previous research.Then CLES is applied to investigate the response of the wall turbulence to the change of the wall condition from rough to smooth.The temporal development of the internal boundary layer is observed,which is similar to that in a spatial rough-to-smooth transition process.It is found that the growth rate of the internal boundary layer is about 0.39 and the spanwise roughness inhomogeneity appears to have little impact on the growth rate.This result can be helpful in developing new empirical models to predict the evolution of mean velocity distribution in a rough-to-smooth transition process.
Acknowledgments
This work has been supported by the National Natural Science Foundation of China (Grants 11988102,91752201,and 11822208),the Department of Science and Technology of Guangdong Province(Grant 2019B21203001),Key Special Project for Introduced Tal ents Team of Southern Marine Science and Engineering Guang dong Laboratory (Guangzhou) (Grant GML2019ZD0103),Shenzhen Science &Technology Program (Grant KQTD2018 0411143441009).Numerical simulations have been supported by Center for Computational Science and Engineering of Southern University of Science and Technology.M.P.Wan acknowledges the support from Cen- ters for Mechanical Engineering Research and Education at MIT and SUSTech.
杂志排行
Theoretical & Applied Mechanics Letters的其它文章
- Experimental investigation of sound absorption in a composite absorber
- A study of inner-outer interactions in turbulent channel flows by interactive POD
- A study on equivalence of nonlinear energy dissipation between first-order computational homogenization (FOCH) and re duce d-order homogenization (ROH) methods
- Stable heat jet approach for temperature control of Fermi-Pasta-Ulam beta chain
- Rotational dynamics of bottom-heavy rods in turbulence from experiments and numerical simulations
- Wall-resolved large-eddy simulation of turbulent channel flows with rough walls
