A study of inner-outer interactions in turbulent channel flows by interactive POD
2021-07-29HongpingWangQiGao
Hongping Wang ,Qi Gao
a State Key Laboratory of Nonlinear Mechanics, Institute of Mechanics, Chinese Academy of Sciences, Beijing 100190, China
b School of Engineering Sciences, University of the Chinese Academy of Sciences, Beijing 10 0 049, China
c State Key Laboratory of Fluid Power and Mechatronic System, Department of Mechanics, School of Aeronautics and Astronautics, Zhejiang University, Hangzhou 310058, China
Keywords: Wall turbulence Interactive POD Inner-outer interaction Amplitude modulation Frequency modulation
ABSTRACT The amplitude and frequency modulation of near-wall flow structures by the large-scale motions in outer regions is studied in turbulent channel flows.The proper orthogonal decomposition (POD) method is ap-plied to investigate the interactions between the near-wall motions and the large-scale flow modes of the outer regions based on two datasets from direct numerical simulation of turbulent channel flows at Reynolds numbers of 550-10 0 0.The fluctuations in the fields u+,v+,w+ and Reynolds shear stress -(u v ) + are studied to understand the mechanism of amplitude and frequency modulation of the near-wall structures by the outer large-scale motions.The amplitude modulation coefficient of the Reynolds shear stress is larger than that of the velocity components.The frequency modulation effect has an op-posite influence in the spanwise direction compared to the streamwise direction.The streamwise char-acteristic frequency increases with increasing large-scale velocity.However,the spanwise characteristic frequency exhibits a decreasing trend with increasing large-scale velocity in the near-wall region.
1.Introduction
Over the past few decades,studies on coherent structures of wall-bounded turbulence became an important topic beginning with the observation of near-wall streaks by Kline et al.[1] .Ac-cording to the review by Smits et al.[2],these coherent struc-tures contain near-wall streaks,hairpin vortices,large-scale mo-tions (LSMs) with a streamwise scale ofO(δ)(δis the thickness of the boundary layer) and very-large-scale motions (VLSMs,or superstructures) with a streamwise length scale of(10δ).They hierarchically distribute over different wall-normal locations and present different spatial or temporal scales.Recent studies have found that the large scales primarily associated with the outer (V)LSMs exert superposition and modulation effects on the near-wall smaller scales [ 3 -5 ].
Low-and high-speed streaks exist in the near-wall region of wall turbulence.Kline et al.[1] first observed the existence of streaks with hydrogen bubbles in flow visualization.The span-wise spacing of streaks has a log-normal distribution and increases as the distance from the wall increases [6] .In the premultiplied streamwise and spanwise energy spectra of streamwise velocity fluctuations,there is a clear energy peak in the near-wall region.This peak is located at wall-normal locationy+=15 (the super-script+denotes a normalization with inner scales),and the dom-inant streamwise and spanwise wavelengths,which are scaled to viscous wall units,are approximately 10 0 0 and 10 0,respectively [7] .These values are nearly invariant under different high Reynolds numbers.Recent studies have pointed out that the small scales cannot be scaled by the viscous units and the vortical structures are progressively strengthened as Reynolds number increases at lower Reynolds numbers [ 8,9 ].The numerical simulations [10-12] indicated the existence of a self-sustaining near-wall cycle that is a local phenomenon in the near-wall region and is not influ-enced by the outer flow.The entire process of hairpin vortex gener-ation from near-wall streamwise vortices was studied based on the streak transient growth from a direct numerical simulation (DNS) of a minimal channel atReτ=400 [13] .
The hairpin vortices predominantly reside in the logarithmic layer of the boundary.The vortex populations regarding the core size,orientation,circulation and propagation velocity of eddies in the buffer and logarithmic regions of the turbulent boundary layer were investigated based on DNS datasets atReτ=590 and 934 and PIV data atReτ=1160 by Gao et al.[14].The orientation distri-butions indicate that the most probable wall-normal inclination of eddies increases with increasing wall-normal distance.Tomkins and Adrain [15] and Ganapathisubramani et al.[16] used PIV measurements in the logarithmic region,showing that the elongated low-speed regions induced by the motion of the hairpin vortices are flanked by vortical motions,which are the necks of hairpin structures.
When a group of hairpin vortices aligns along the streamwise direction at a mean growth angle of 10~20°,it is considered a vortex packet,which is normally referred to as an LSM [15-17] .LSMs and VLSMs are distinguished by the streamwise length scales,which can be determined by many approaches.These approaches include linear stochastic estimation (LSE) [15,18],proper orthogonal decomposition (POD) [19,20],and premultiplied energy spectrum analysis [21].Balakumar and Adrain [22] investigated the streamwise length scale of LSMs and VLSMs in turbulent channel flow,a zero-pressure-gradient (ZPG) turbulent boundary layer(TBL) and pipe flow.The streamwise length scale of LSMs was found to be approximately 2-3δ,while that of VLSMs reached approximately 10δand increased with increasing wall-normal locationy+.They concluded that substantial portions of the kinetic energy (40-65%) and the Reynolds shear stress (30-50%) are carried by VLSMs in pipe,channel and ZPG boundary layer flows.Wang et al.[23] recently used linear stochastic estimation (LSE)and conditional averaging methods to analyze the properties of hairpin vortices and eddy packets.They found that the population density of the packets in a TBL is large enough to leave footprints in conditionally averaged flow fields.In terms of the generation of VLSMs,Kim and Adrain [21] proposed that VLSMs are caused by streamwise alignment of LSMs,whereas del Álamo and Jiménez [24] suggested that they could be formed by some linear or nonlinear processes,which can be described by the Orr-Sommerfeld-Squire equations for the mean turbulent profile.However,the origin of VLSMs remains unclear.
Interaction among structures with different scales is a major issue when studying turbulence.Under the framework of Townsend’s attached eddy hypothesis [25,26],the outer large-scale structures may affect the inner small-scale structures over a certain range of wall-normal locations [4].Hunchins and Marusic [3] applied the premultiplied energy spectrum methods to study the TBL and found a secondary energy peak in the outer region,which became comparable to that of the near-wall cycle when the Reynolds number increased.Marusic et al.[27] investigated the correlation of the inner and outer signals,mostly with hotwire techniques,and claimed that the outer structures affect the near-wall turbulent fluctuations via superposition and modulation.A concise algebraic outer-inner model was proposed to predict the near-wall turbulence with only large-scale information from the outer boundary layer region [27].All three velocity components were investigated using cross-wire probes by Talluru et al.[28],and the results indicated that the small-scale spanwise fluctuationsw+,wall-normal fluctuationsv+and Reynolds shear stress -(uv)+are modulated in a very similar manner to the streamwise fluctuationsu+.Furthermore,Ganapathisubramani et al.[4] used the hotwire data of the turbulent boundary layer to examine the impact of the strength of the large-scale motions on the amplitude and frequency of the small-scale motions at high Reynolds numbers.Wavelet analysis was employed to examine the amplitude and frequency modulation in broadband signals by Baars et al.[29].It was found that the time shift in the frequency modulation is smaller than that in the amplitude modulation.
For multiscale analysis,a critical step is to extract the flow structures of different length scales.The velocity fluctuations are usually separated into large (outer) and small (inner) scales using a spectral filter of wavelengthλ+x=δ+(λ+xdenotes the streamwise wavelength).This criterion is determined according to the streamwise premultiplied energy spectra.Unfortunately,this method,which will be introduced in Sect..1,is hard to be applied to low-Reynolds-number turbulent flows due to the insufficient scale separation [2,3].Agostini and Leschziner [30] used Huang-Hilbert empirical mode decomposition (EMD) to separate the velocity scales with no predetermined bases needed.The large scales were chosen from the intrinsic mode functions (IMFs) based on the local temporal/spatial scales in EMD.Another method to extract the largescale structures is POD [20,31-34],which can reconstruct the most energetic structures in turbulence.While data-driven models generated from EMD or POD usually reflect the local characteristics,it still is hard to extract and identify the large scales related to outer flow structures.Recently,linear coherence spectra have been used to analyze velocity signals at two different wall-normal locations for triple decomposition of the streamwise velocity energy spectra [9,35-37].This means that the velocity fields along the wall-normal direction are highly correlated.Moreover,as explained by Talluru et al.[28],most of studies on modulations in turbulence have been restricted to analyzing the modulation of the streamwise velocity component along the streamwise direction.It is very important to check the modulation effect for all three velocity components along different directions.
In the present work,we developed a POD-based method,named interactive POD,to explore the relationship between large and small scales for all three velocity components at low-Reynoldsnumber turbulent flows.The rest of the article is organized as follows.First,scale separation approaches based on the Fourier transform and interactive POD are introduced and compared.Second,the superposition,amplitude and frequency modulations between large and small scales ofu+,v+,w+and Reynolds shear stress -(uv)+are investigated using cross-correlation and conditional averaging.It has been discovered that the streamwise frequency and spanwise frequency display opposite trends when the large-scale velocity is increased at the same wall-normal locations.Finally,a conclusion is made regarding perspectives on the interactive POD and the modulation effects.
2.Descriptions of the DNS data
In the subsequent descriptions,the streamwise,spanwise and wall-normal directions are denotedx+,z+andy+,and the velocity fluctuations are represented byu+,w+andv+,respectively.All the velocity components are normalized using the skin friction velocityuτ,and the length scale is normalized by the inner length scaleν/uτ,whereνis the kinematic viscosity.Two DNS datasets of fully developed turbulent channel flows are employed in this study.The dataset of the lower friction Reynolds numberReτ=550 is denoted“DNS1”,while the other dataset ofReτ=1000 is called“DNS2”.
The bulk Reynolds numberReb=Ubh/νof DNS1 is 10,000.Here,Ubis the bulk mean velocity,andhis the half-channel height(h=1 in dimensionless units).The simulation followed the numerical procedure developed by Kim et al.[38].Periodic boundary conditions were employed in both the streamwise and spanwise directions,and the no-slip boundary condition was applied at the wall.A pseudospectral method was employed to numerically solve the Navier-Stokes equations,where Fourier series were used in both the streamwise and spanwise directions.Meanwhile,a sixth-order compact finite difference scheme was utilized in the wall-normal direction.The aliasing errors were removed using the 3/2 rule.Time was advanced with a third-order,stiffly stable scheme.The computation domain size was 8πh× 2h× 3πhwith a mesh of 1536 × 256 × 1152 in the streamwise,wall-normal and spanwise directions.The grid was uniform in the homogeneous directions,while the points were closely concentrated in the wall-normal direction near both walls using cosine mapping.Therefore,the grid spacing normalized by the inner length scale in the streamwise and spanwise directions was approximately 9.0 and 4.5,respectively.The minimum and maximum wall-normal grid spacings were 0.0414 and 6.75,respectively.The time step was fixed atΔt=1.25 ×10⁻³h/Ub(Δt+≈0.037).The data were stored every eight time steps during a period of 20.48h/Ubafter the flow had fully developed and reached a statistically stationary state.
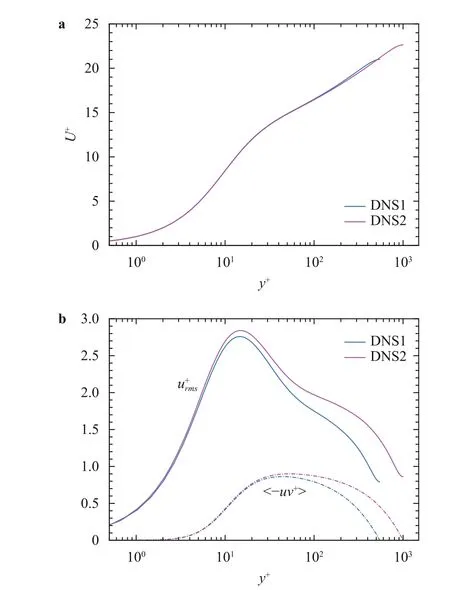
Fig.1. Statistical profiles of the two DNS datasets: a the mean streamwise velocity;b the streamwise turbulence intensity and the Reynolds shear stress.
DNS2 of a higher Reynolds number was downloaded from the Johns Hopkins Turbulence Databases (JHTDB) [39-41].This turbulent channel flow was simulated from a DNS of wall-bounded flow with periodic boundary conditions in the streamwise and spanwise directions and no-slip conditions at the top and bottom walls.The Navier-Stokes equation was also solved using the wall-normal,velocity-vorticity formulation proposed by Kim et al.[38].Details about the simulation can be found on the website (http://turbulence.pha.jhu.edu/cutout.aspx).The simulation was performed in a domain with a size of 8πh× 2h× 3πhdiscretized on a grid of 2048 × 512 × 1536.The grid spacing in the viscous unit was approximately 12.2 and 6.1 in the streamwise and spanwise directions,respectively.The grid close to the wall was also refined to achieve a grid spacing from 0.0165 to 6.15 from the wall to the center of the channel along the wall-normal direction.
Figure 1 shows the statistical profiles of these two DNS datasets.The curves of different Reynolds numbers agree well in the nearwall region and show a great deviation in the outer region.The two original DNS datasets are difficult to analyze because of the large data size.In this study,both DNS datasets were cropped to a size of 5δ× 3δat fixed wall-normal locations.All the velocity components were spline interpolated to a regular square mesh in the streamwise and spanwise planes.The interpolated grid spacing was 6 and 9 for DNS1 and DNS2,respectively.Table 1 providesthe parameters of the datasets.LxandLzare the lengths in the streamwise and spanwise directions,respectively.andare the grid spacings after interpolating the original DNS data to a regular square mesh in thex-zplane.represents the time spacing,andNtis the total number.NxandNzdenote the grid numbers in the streamwise and spanwise directions,respectively.The wallnormal locations used in this paper are shown in the sections of the results.

Table 1 Parameters of the cropped datasets.
3.The scale separation approaches
3.1. Scale separation based on the spectrum
The streamwise premultiplied energy spectra of the streamwise velocity fluctuations are commonly used to explore the interactions of the large-scale structures with near-wall small-scale motions.Hutchins and Marusic [3] stated thatReτ >1700 is the minimum requirement to observe two energy peaks in the streamwise spectral map for wall-bounded turbulence.McKeon and Morrison [42] and Smits et al.[2] found thatReτ >4000 was required to achieve a sufficient scale separation.The inner peak is located aty+=15 and=1000,while the outer peak resides in the center of the logarithmic region [7,43].The magnitude of the outer peak increases with Reynolds number,and the dominant streamwise wavelength is much larger than the boundary thickness [3].At low Reynolds numbers,the two energy sites are too close,and the outer peak is very ambiguous due to the insufficient separation [3].Therefore,the spectral filter method is difficult to apply to separate the outer large scales from the near-wall fields.
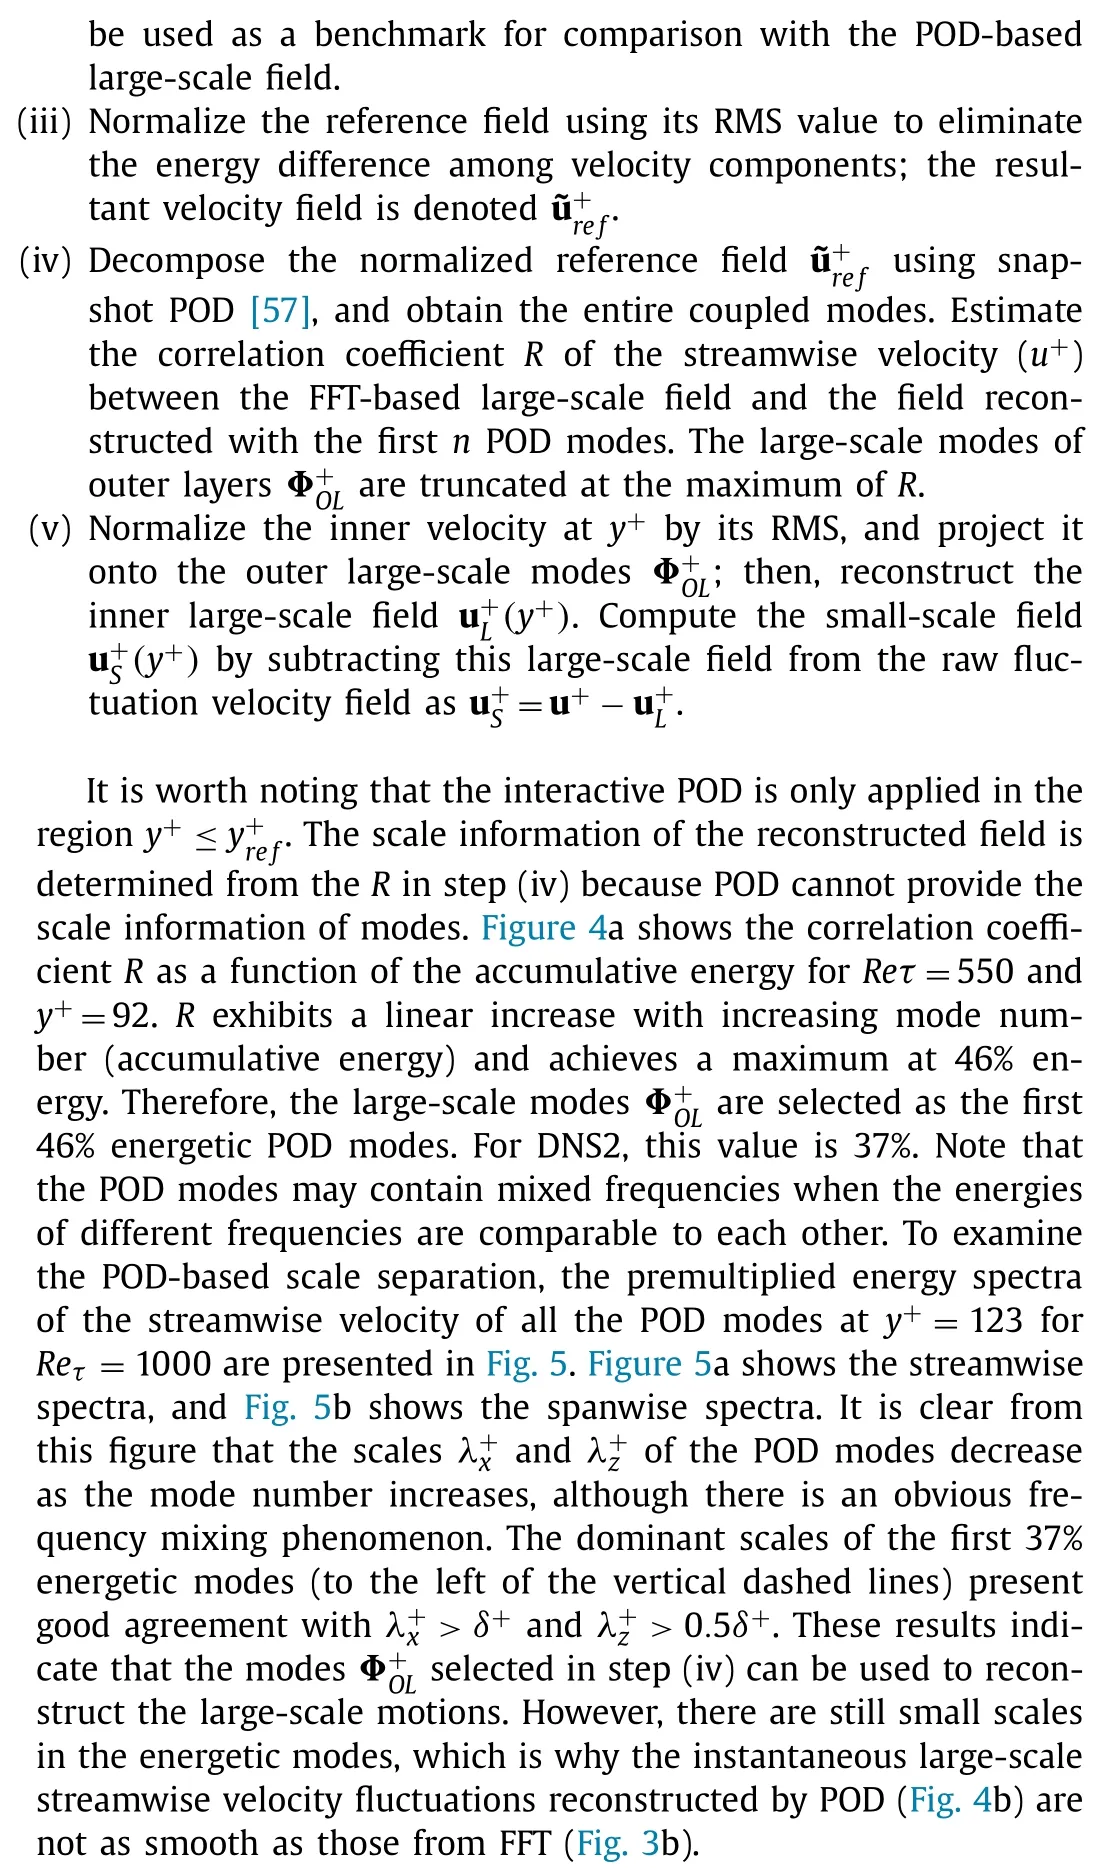
In the present work,the outer peak of the streamwise spectra is not clearly visible for the friction Reynolds numbersReτ=550 and 1000.However,two spectral peaks can be observed in the premultiplied spanwise energy spectra of streamwise velocity fluctuations,as shown in Fig.2 and described in detail by Wang et al.[44].The first peak emerges at approximately=125 andy+=15.The wall-normal position of the outer peak is associated with the Reynolds numbers,and the spanwise wavelength of the outer peak is normally equal to the thickness of the boundary layer [43-48].The existence of inner and outer spectral peaks implies that the scales can be sufficiently separated in the spanwise direction using the spectral filter method.For the streamwise-spanwise field,two cutoff wavelengths need to be defined.The spanwise cutoff wavelength is chosen as/δ+=0.5 (the dashed-dotted lines in Fig.2) following the method of Bernardini and Pirozzoli [47].The streamwise cutoff wavelengthλx/δis 1,similar to the strategy in Mathis et al.[49],Marusic et al.[27],and Mathis et al.[50].Note that the 2D spectral filter method is only used in the outer region to extract the large scales of the streamwise fluctuationsu+in this work.Two issues need to be considered for scale separation based on the Fourier transform.First,the data are discontinuous at the edge because of the non-integer-period sampling.In this work,a larger flow field of the DNS was used to separate the scales using the fast Fourier transform (FFT).Then,the field was cropped as shown in Table 1 to perform the following analysis.Second,there is no ideal low-pass filter because the signal can be distorted by the Gibbs phenomenon due to the sharp cutoff in the frequency domain [51].Thus,a fourth-order elliptical Butterworth filter was adopted in this work to perform low-pass filtering in the frequency domain [51].Figure 3 shows one instantaneous field (a) and the corresponding large-scale field obtained by FFT(b) aty+=92 (3.9Reτ1/2) for DNS1.The color contour represents the streamwise fluctuating velocityu+.The high-and low-speed zones are well captured by the large-scale field.The large-scale field obtained at the outer region will be used as a reference for the interactive POD.
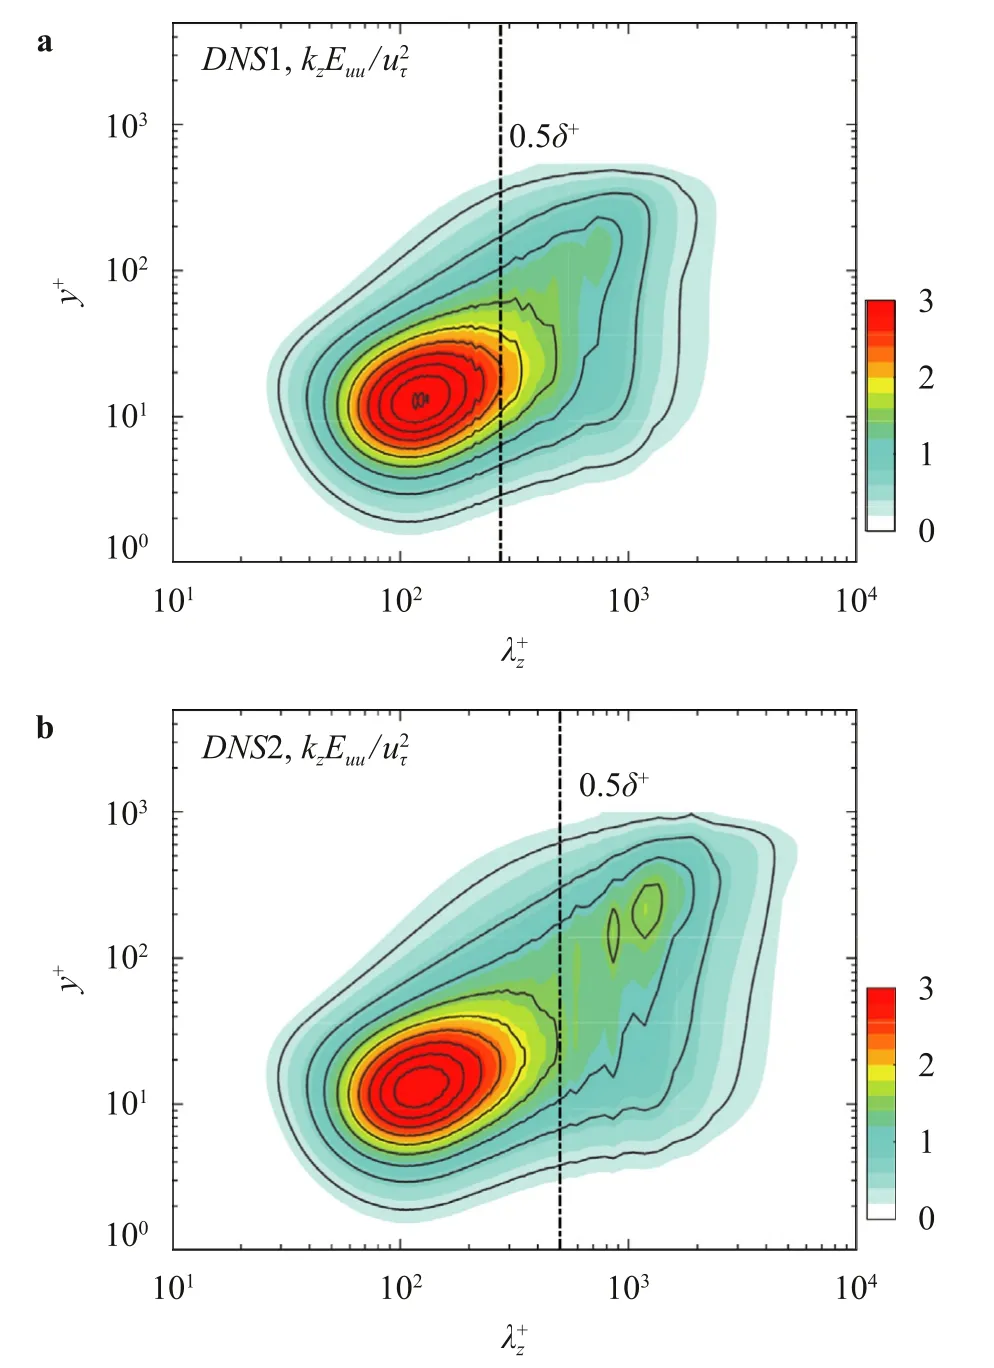
Fig.2. Premultiplied spanwise spectra of the u+ fluctuations as a function of y+for DNS1 a and DNS2 b.The horizontal and vertical axes represent the spanwise wavelength and wall-normal location,respectively.The black dashed lines indicate=0.5 δ+.
3.2. Scale separation based on interactive POD
Proper orthogonal decomposition (POD) provides a set of lowrank bases for a high/infinite-dimensional dynamical system.These bases are optimal for the turbulent kinetic energy contributions in the sense ofL2(2-norm).The POD technique has been widely utilized in different fields of research.It was first applied to study turbulent flows by Lumley [52] and reviewed by Berkooz [53].The idea of POD is to extract prominent modes associated with high energy and containing large-scale coherent structures in turbulent flows,thereby achieving a mode reduction from full dimensional turbulence to a low-dimensional model.The decomposition generates a group of orthogonal flow modes,which are ordered with respect to their contributions to the turbulent kinetic energy.This method was applied to examine the possible self-similarity of the large-scale motions in turbulent pipe flow [33].Compared with the scale separation based on FFT,POD can obtain coherent structures by coupling all three velocity components.
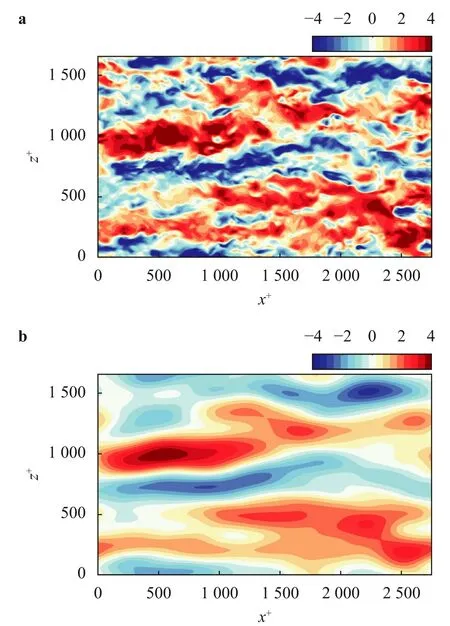
Fig.3. Comparison between the original u+ field a and the FFT-based large-scale u+ field b at y+=92 for the DNS1 dataset.
In this work,an interactive POD method is proposed to examine the outer-inner interaction.Different from the extended POD used to analyze the local energy contribution to the whole velocity field [54,55],interactive POD reconstructs the near-wall large scales using the large-scale modes extracted from the outer region.The wall-normal location in the outer region is estimated from the formulay+=3.9Reτ1/2,which is deduced from the outer peak of the streamwise premultiplied energy spectra according to Mathis et al.[49,50].The location is consistent with the nominal midpoint of the logarithmic region under high-Reynolds-number turbulence.However,Wang et al.[9] usedy+=100 instead of 3.9Reτ1/2as the reference location for evaluating outer footprints,and they provided plenty of evidences to demonstrate the small scales are universal under the condition ofy+=100.This value is also consistent with the smallest attached eddy size given by Perry and Chong [56].In the present work,our objective is to investigate the influences of the outer large scales on the inner small scales,we still use the location deduced fromy+=3.9Reτ1/2when analyzing the outer-inner interactions.Therefore,the outer reference location is approximately equal to 92 and 123 for DNS1 and DNS2,respectively.Snapshot POD [57] was adopted in the present work,and the correlation matrix between individual snapshots was calculated [58].All three velocity components were used,and each component was normalized by its root-mean-square (RMS) value to eliminate the magnitude difference for the correlation matrix.The reconstructed field was multiplied by its RMS to recover the full information.The step-by-step procedure of interactive POD is given as follows.

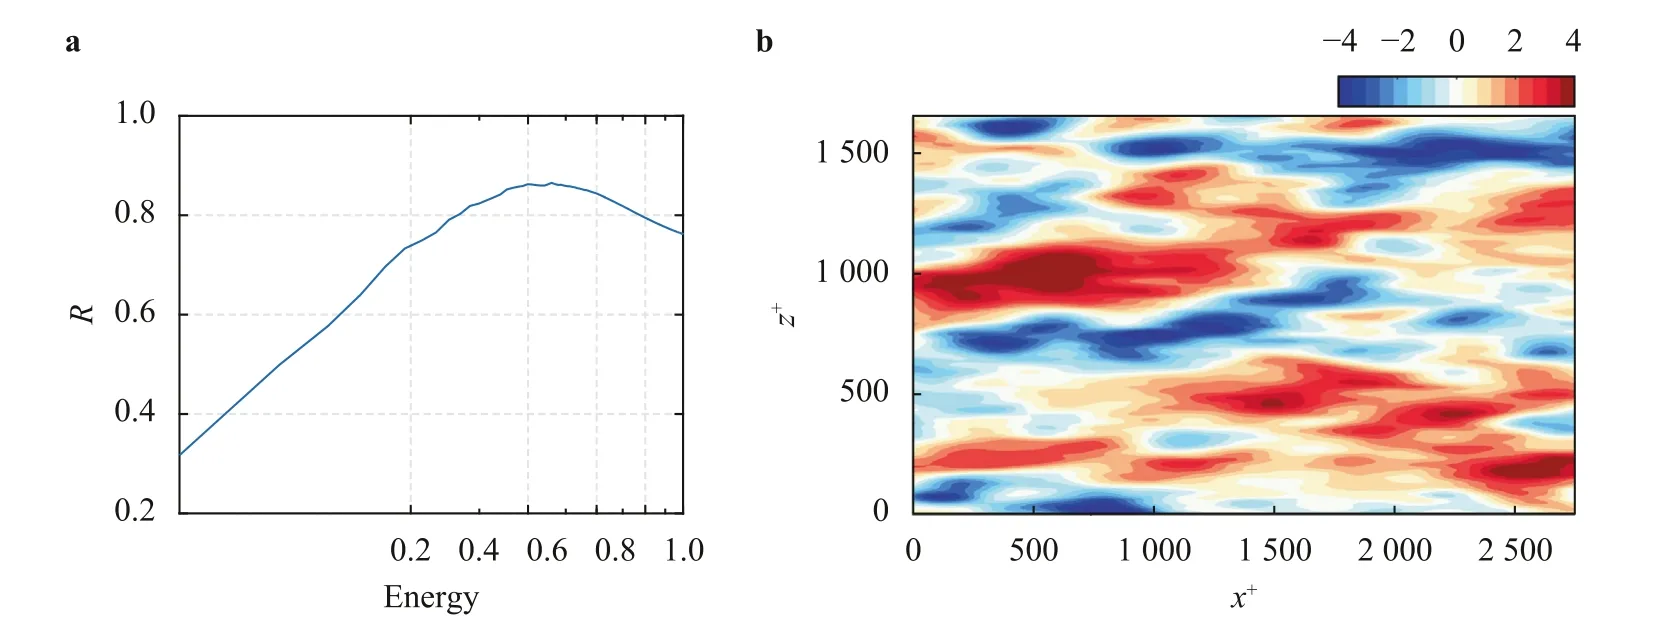
Fig.4. a Correlation coefficient R between the FFT-based large-scale streamwise velocity field and the POD reconstructed streamwise velocity field as a function of the accumulative energy for Re τ=550 at y+=92.The maximum R is achieved at 46% relative energy.b Large-scale structure reconstructed by POD for DNS1.The contour represents the streamwise velocity u+.
The outer large-scale modesare used to construct the inner large-scale field.Then,the small-scale fluctuations are obtained by subtracting this large-scale field from the raw fluctuation velocity field.This is the core idea of interactive POD.Similar to the scale separation based on FFT,the large-scale component makes a significant energy contribution in the outer region.In contrast,the small-scale fluctuations account for the majority of the nearwall peak,and their energy diminishes to zero at the edge of the boundary.
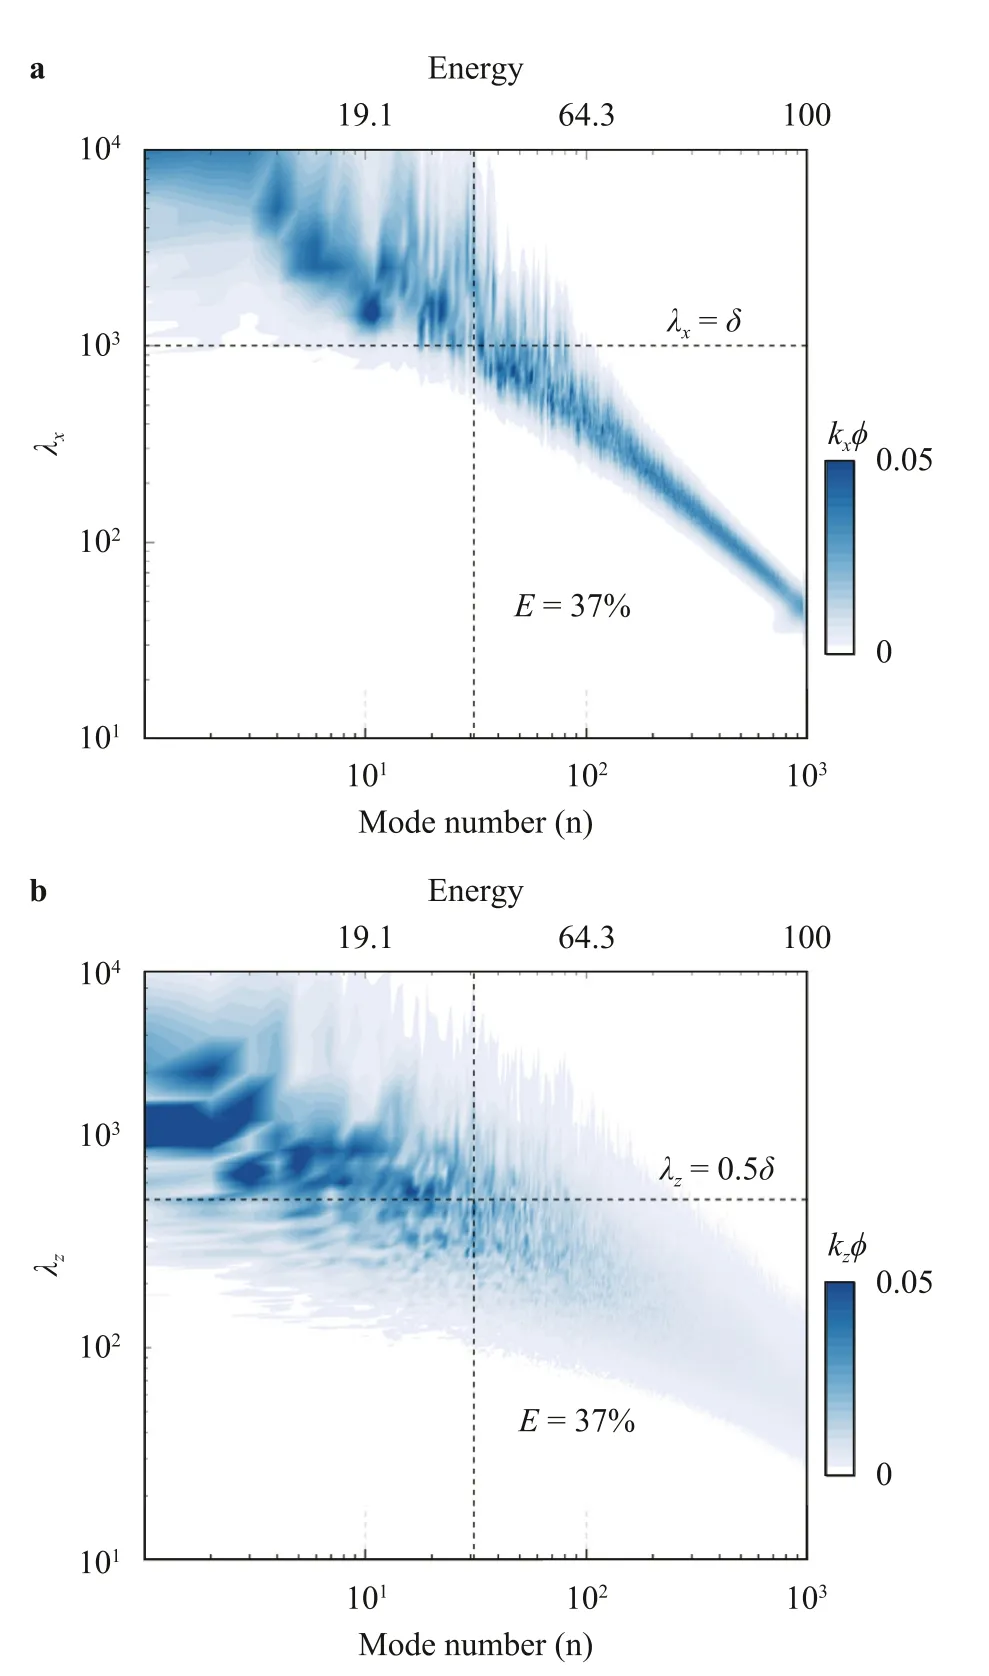
Fig.5. Premultiplied energy spectra of the streamwise velocity as a function of the mode number at y+=123 for Re τ=1000. a Streamwise spectra,the blue contours represent k xφ.b Spanwise spectra,and the blue contours represent k zφ.The top horizontal axis denotes the cumulative POD energy,and the bottom horizontal axis denotes the mode number.(For interpretation of the references to color in this figure legend,the reader is referred to the web version of this article.)
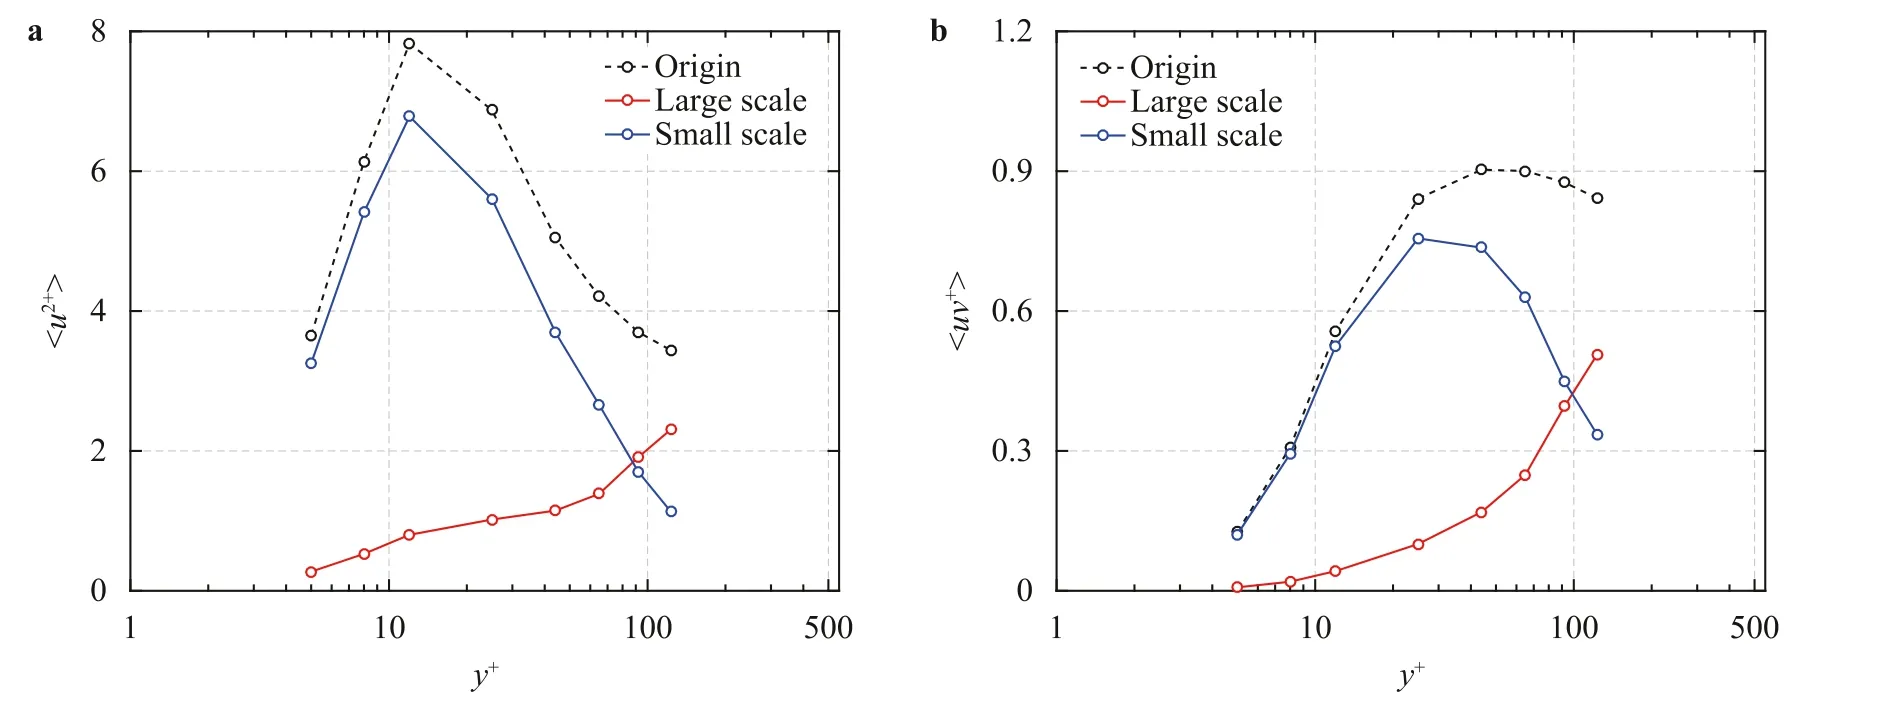
Fig.6. Large-scale and small-scale contributions to streamwise turbulent kinetic energy u2+ a and Reynolds stress 〈-(uv)+ 〉 b for DNS2.The trends for DNS1 and DNS2 are similar.(For interpretation of the references to color in this figure,the reader is referred to the web version of this article.)
4.Reynolds shear stress statistics
Figure 6 shows the large-scale and small-scale contributions to streamwise turbulent kinetic energy 〈u2+〉 (a) and to Reynolds stress 〈-(uv)+〉 (b).The black,red and blue curves represent the contributions of the original data,large scales and small scales,respectively.The result of Fig.6a is very similar to the result of Marusic et al.[7],where the small-scale contribution to 〈u2+〉is primarily located in the near-wall region and the outer layer is dominated by the outer large scales.For the Reynolds shear stress 〈-(uv)+〉,in the near-wall region,the Reynolds stress of small scales (blue curve) is much larger than that of large scales(red curve).Asy+increases,the contribution of the large scales gradually surpasses that of the small scales in the outer region.The results for DNS1 have similar trends.The contributions to the Reynolds stress of large and small scales share the same properties as those to 〈u2+〉.
To further investigate the Reynolds shear stress contributions of large and small scales,Fig.7 shows the weighted joint probability density function (PDF) ofu+andv+at different wall-normal locations for DNS1 and DNS2.The contour lines represent the contribution to 〈-(uv)+〉,andu+andv+are scaled byrespectively.Regardless of the scale,the PDFs show strongQ2(u+<0,v+>0,ejection) andQ4 (u+>0,v+<0,sweep) events,demonstrating that the positive streamwise velocities are associated with the negative wall-normal velocities or vice versa.TheQ2 andQ4 events are responsible for transporting high momentum fluid towards the wall and low momentum fluid away from it [32].Thus,these events correspond to a positive contribution to the Reynolds shear stress 〈-(uv)+〉.However,there are some differences between the large scales and small scales.For the large scales,the PDFs are almost symmetrically distributed about the diagonal line in quadrants 2 and 4,and the shapes are similar across the different wall-normal locations for the present two Reynolds numbers.This implies that the large-scale contribution to the Reynolds shear stress presents a self-similar distribution.For the small-scale Reynolds shear stress,more interesting distributions are presented.In the near-wall region (y+=12),the PDFs also show strongQ2 andQ4 events,but the shape of the contours is completely different from that of the large scales because the range of the normalized wall-normal componentv+is much larger than that of streamwiseu+.This may be caused by the counterrotating streamwise vortices identified as dominant vortical structures in the near-wall region [59].When increasingy+to 3.9Reτ1/2,the PDF of small scales becomes symmetric about the diagonal line of the second and fourth quadrants.Moreover,the large scales have little contributions to theQ1 (u+>0,v+>0,outward interaction)andQ3 (u+<0,v+<0,wallward interaction) events compared to the small scales [32].
5.Inner-outer interactions
In the paper by Talluru et al.[28],a combination of cross-wire probes with an array of flush-mounted skin-friction sensors was used to study all three velocity component modulation effects,and they found that the small-scale spanwise and wall-normal fluctuations and the instantaneous Reynolds shear stress are modulated in a very similar manner as the streamwise fluctuations at high Reynolds numbers.Using interactive POD in the present work,both the superposition and modulation effects are investigated for all three velocity components and Reynolds stress 〈-(uv)+〉.
5.1. Superposition effect
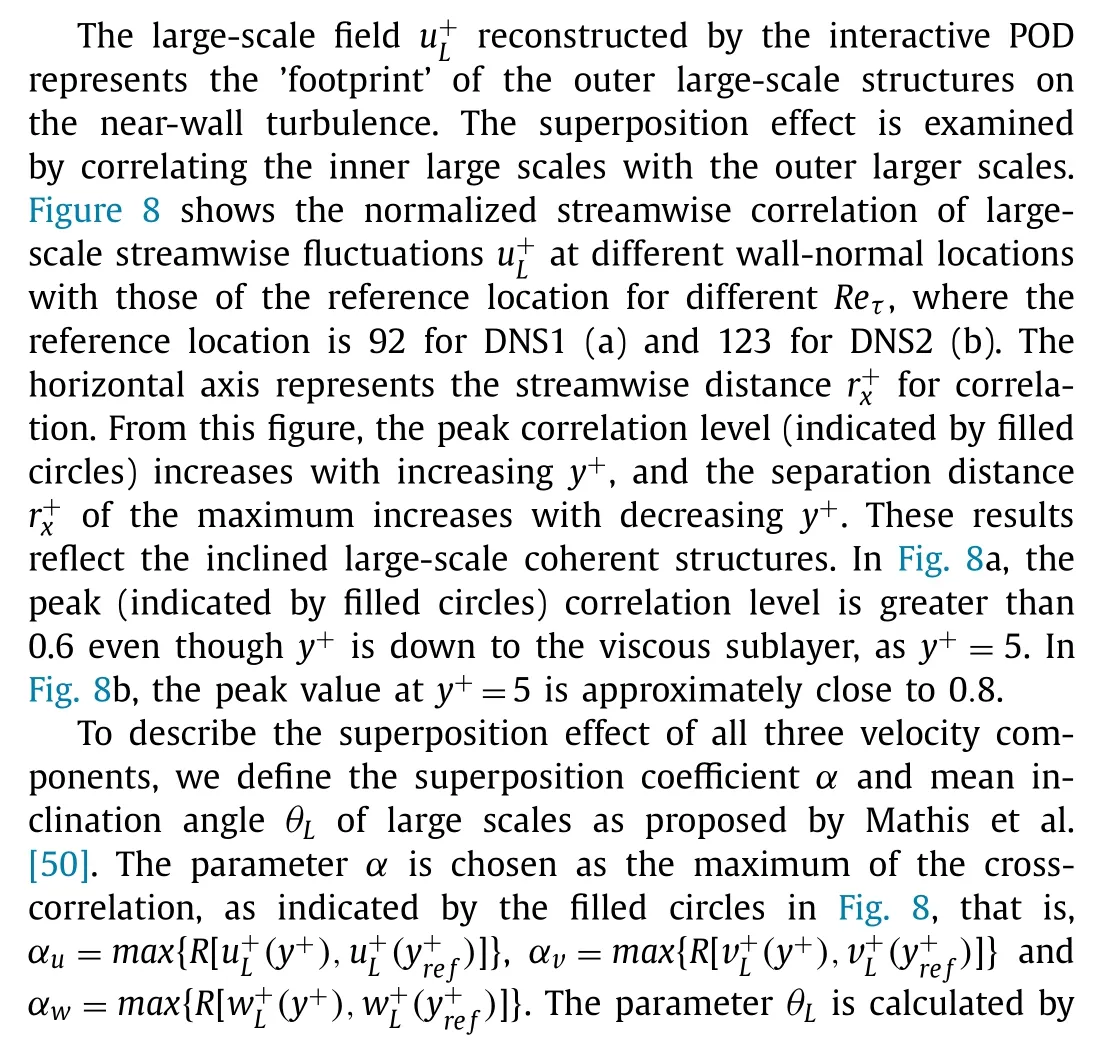
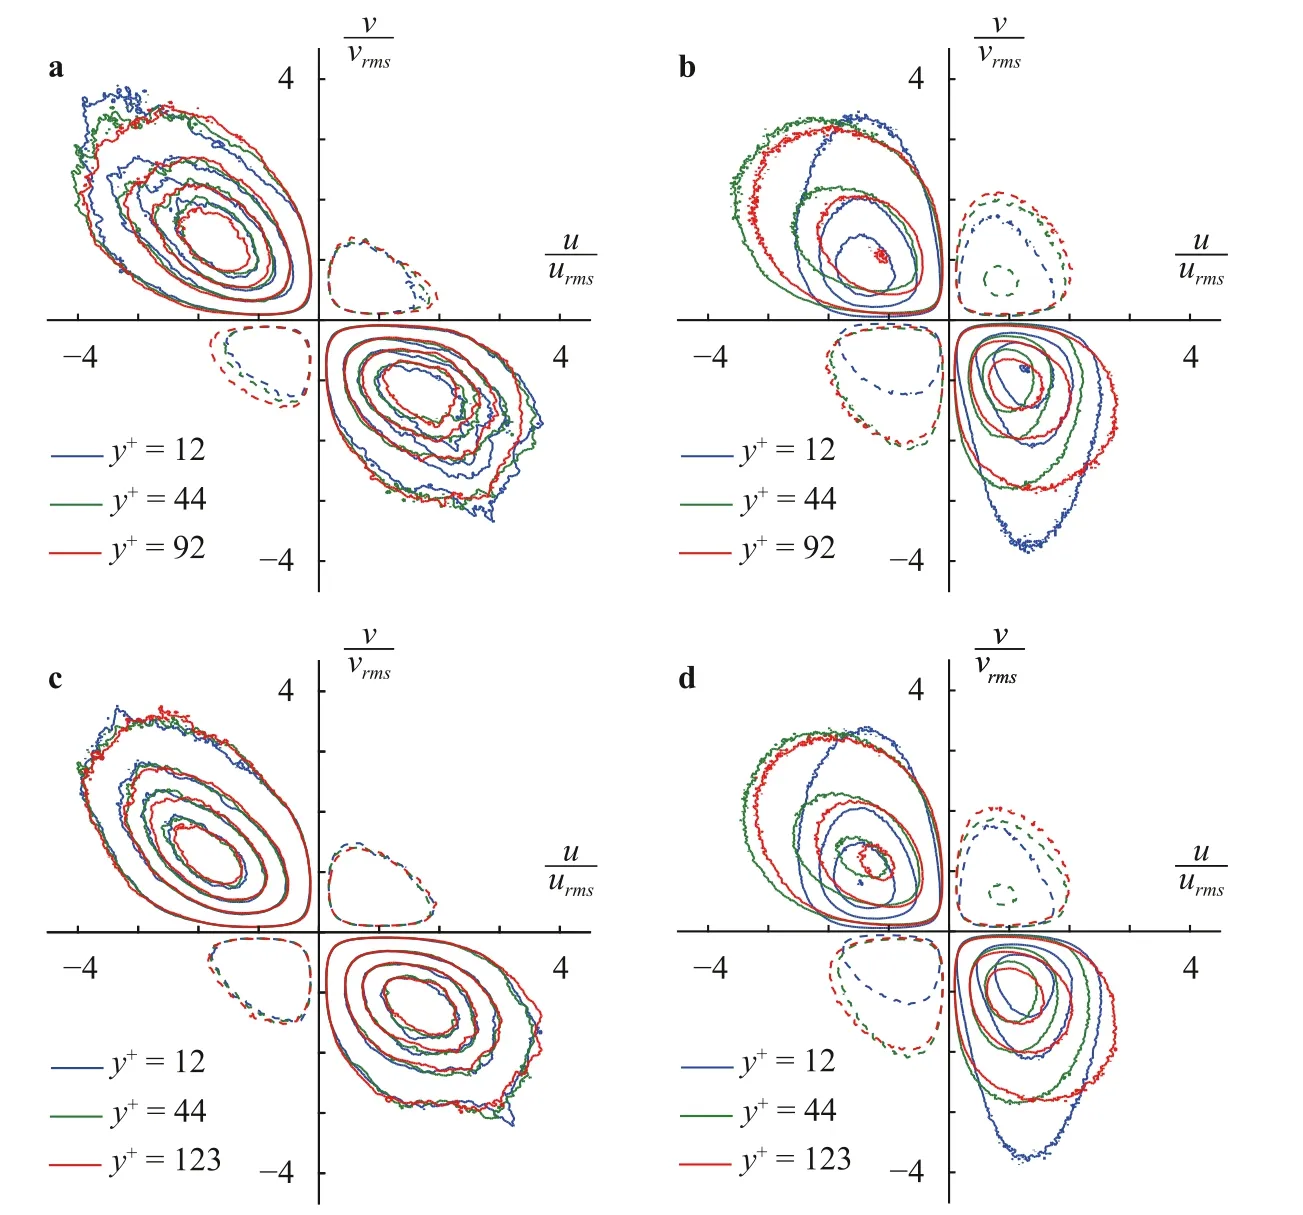
Fig.7. Reynolds shear stress weighted joint PDF of u+ and v+ at different wall-normal locations for DNS1 a, b and DNS2 c, d.Left panels a, c show the large-scale field,and right panels b,d show the small-scale field.All values are normalized by or and weighted by the Reynolds shear stress -(uv)+.The positive contour levels (solid lines) are from 0.01 to 0.1 in a step of 0.03.The negative contour levels (dashed lines) are from -0.04 to -0.01 in a step of 0.03.
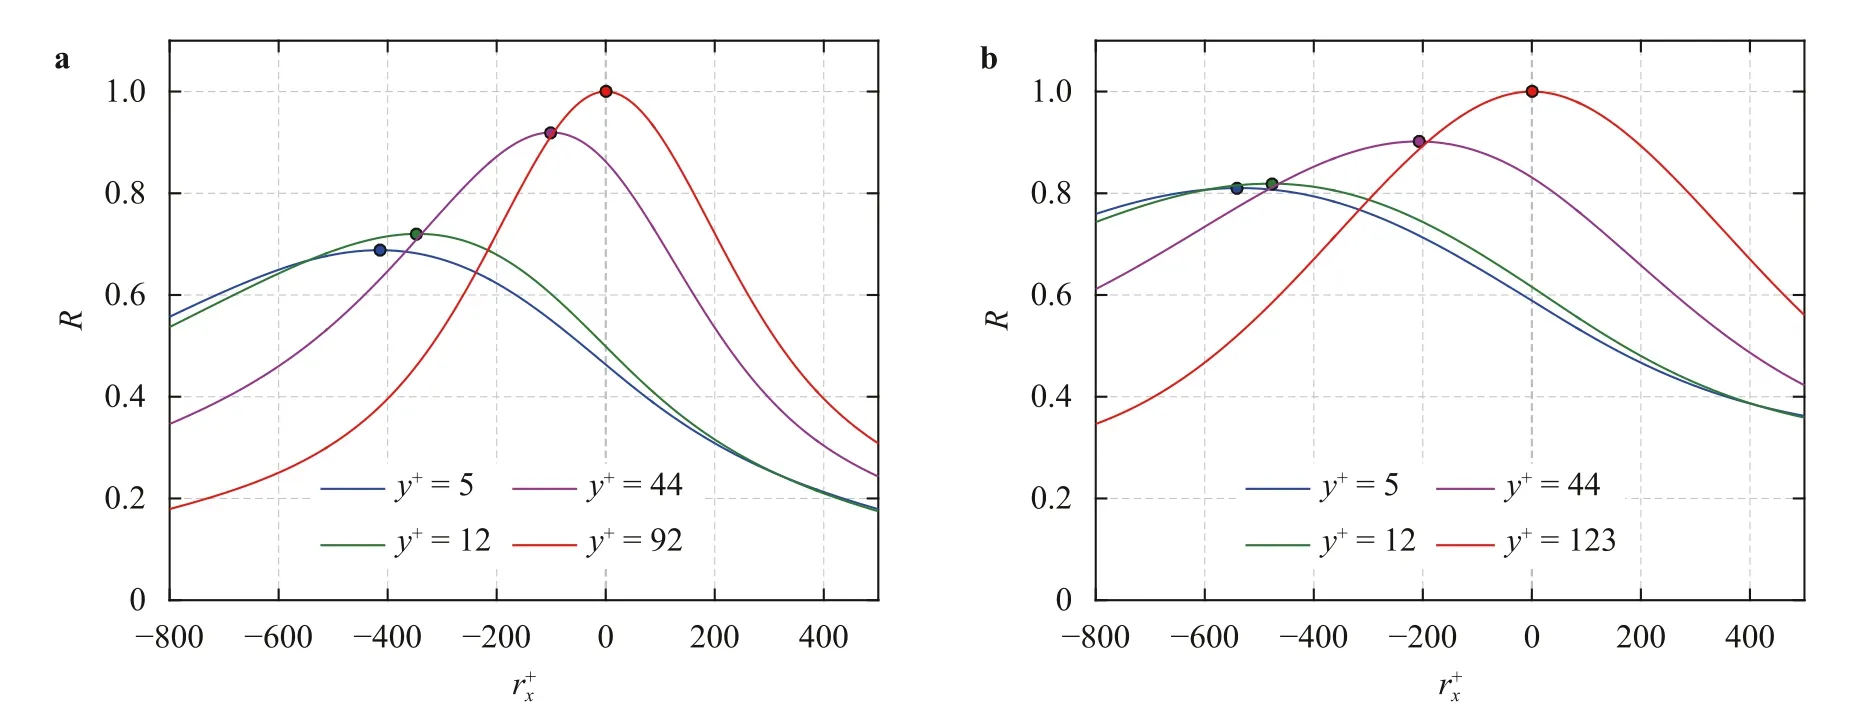
Fig.8. Streamwise correlation of large-scale streamwise fluctuations at y+=5 (blue),12 (green),and 44 (purple) with those at the reference wall-normal location (y+=92 for DNS1 and y+=123 for DNS2);a and b present the results for DNS1 and DNS2,respectively.represents the streamwise distance from the correlation center.The red curve represents the streamwise autocorrelation at the reference location.The filled circles indicate the position of the maximum correlation coefficient R.(For interpretati o n of the references to color in this figure legend,the reader is referred to the web versio n of this article.)

5.2. Amplitude modulation
The amplitude modulation of the near-wall structures by the large scales is investigated in this part.First,we explore the spatial distribution of the small-scaleu+events on the condition of largescale positive and negativeu+events.Second,the small-scale am-plitudes of all three velocity components and Reynolds shear stress are conditionally computed on the value of the large-scale intensity.
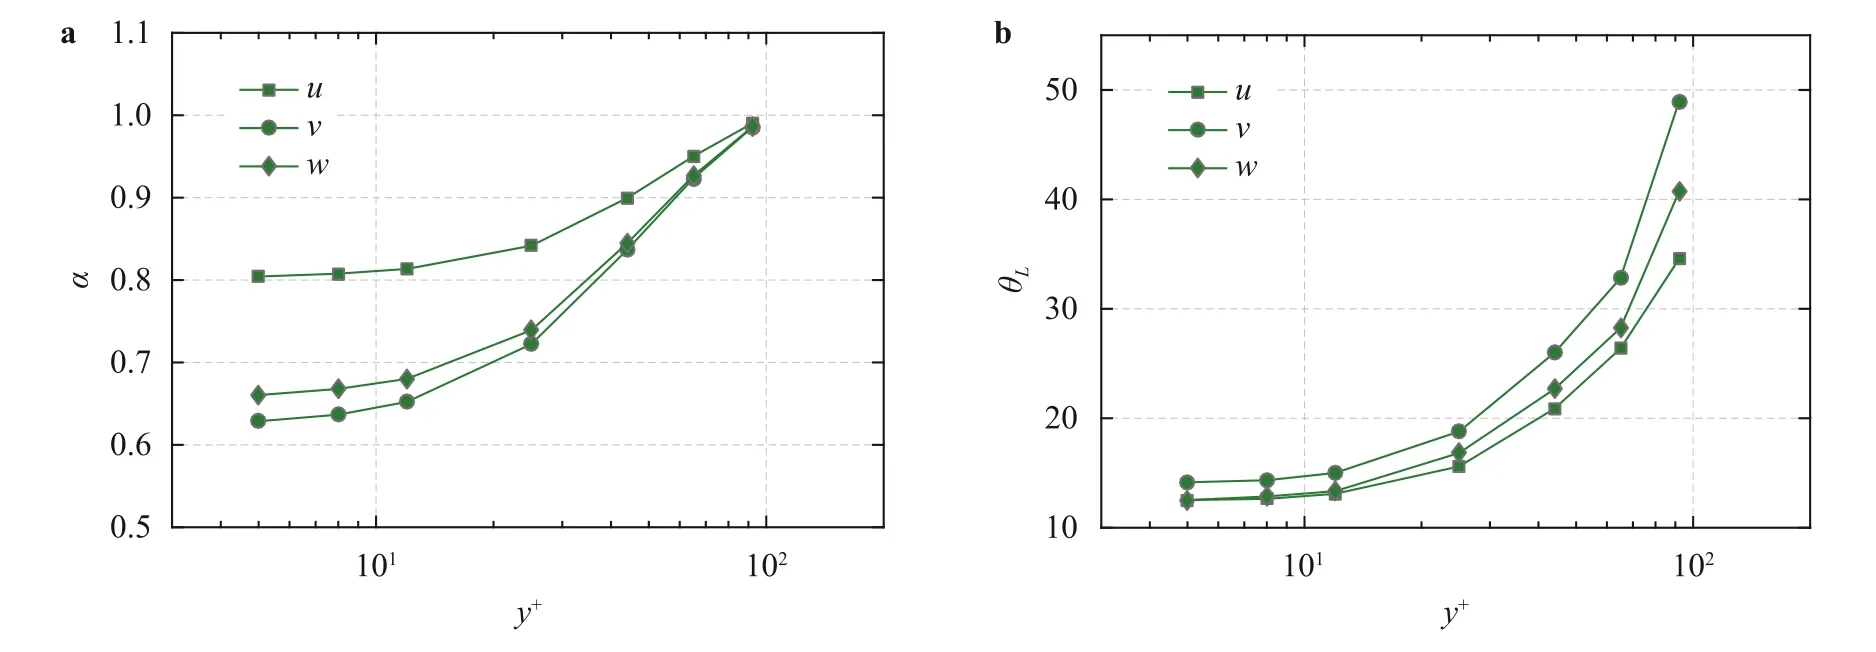
Fig.9. Superposition coefficient α a and inclination angle θL b of the large scales as a function of the wall-normal location for DNS2.The velocity components u+,v+ and w+ are plotted by square,circle and diamond symbols.
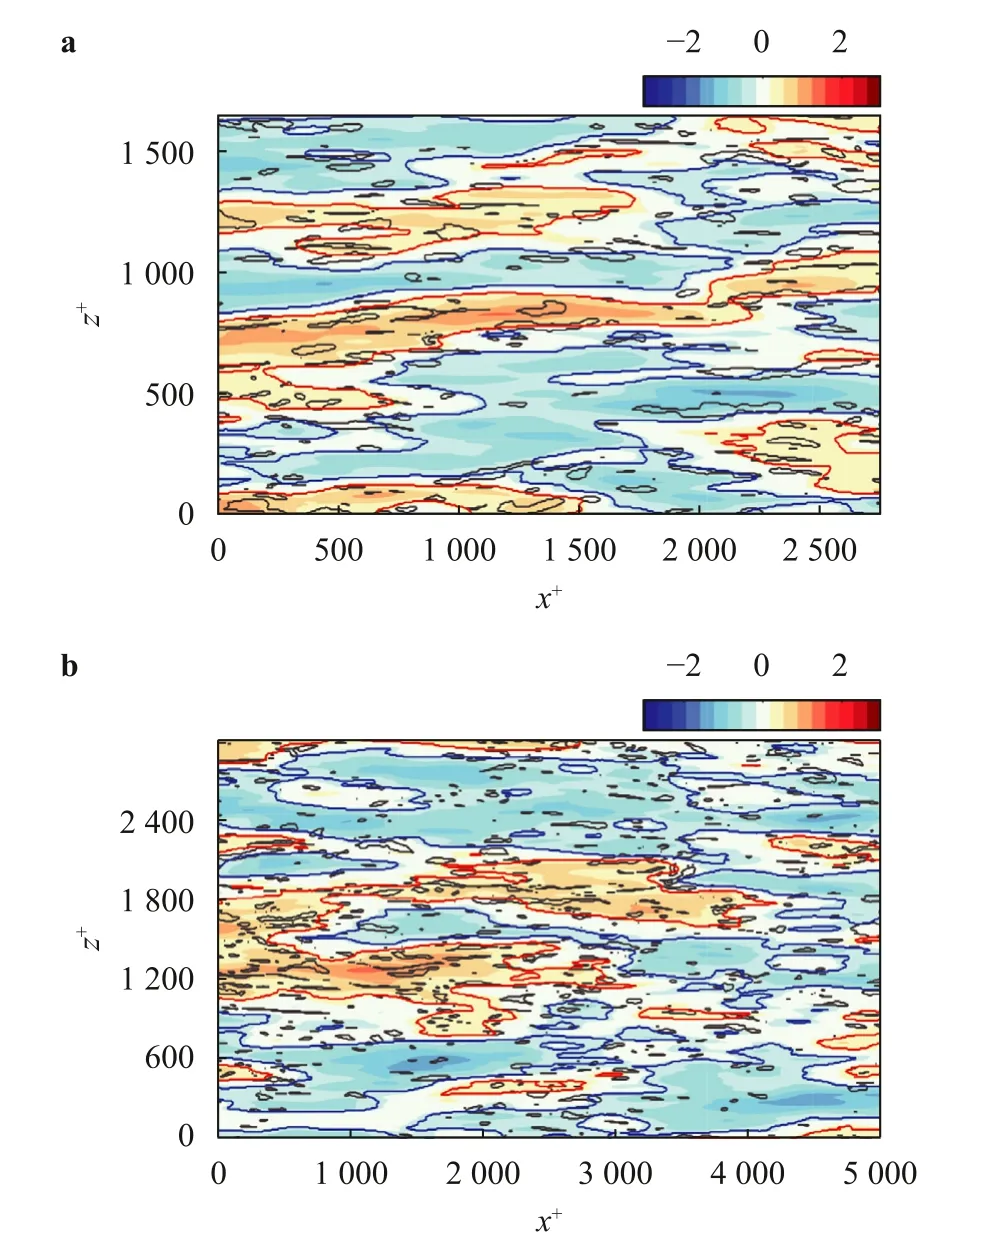
Fig.10. Example at y+=5 of large-scale u+ fluctuatio n and small-scale u+ events with αS=1.5.The contour represents the large-scale ,and t he re d a nd blue curves are the isocontour lines of αL=±0.5.The black curves r epresent the isocontour lines of the small-scale u+events.The illustrations in a and b are for DNS1 and DNS2,respectively.(For interpretation of the references to color in this figure legend,the reader is referred to the web version of this article.)
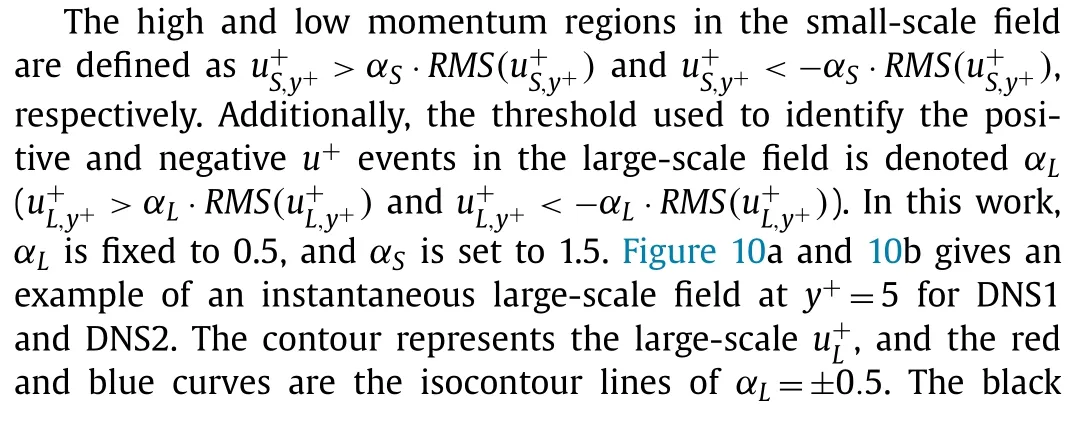
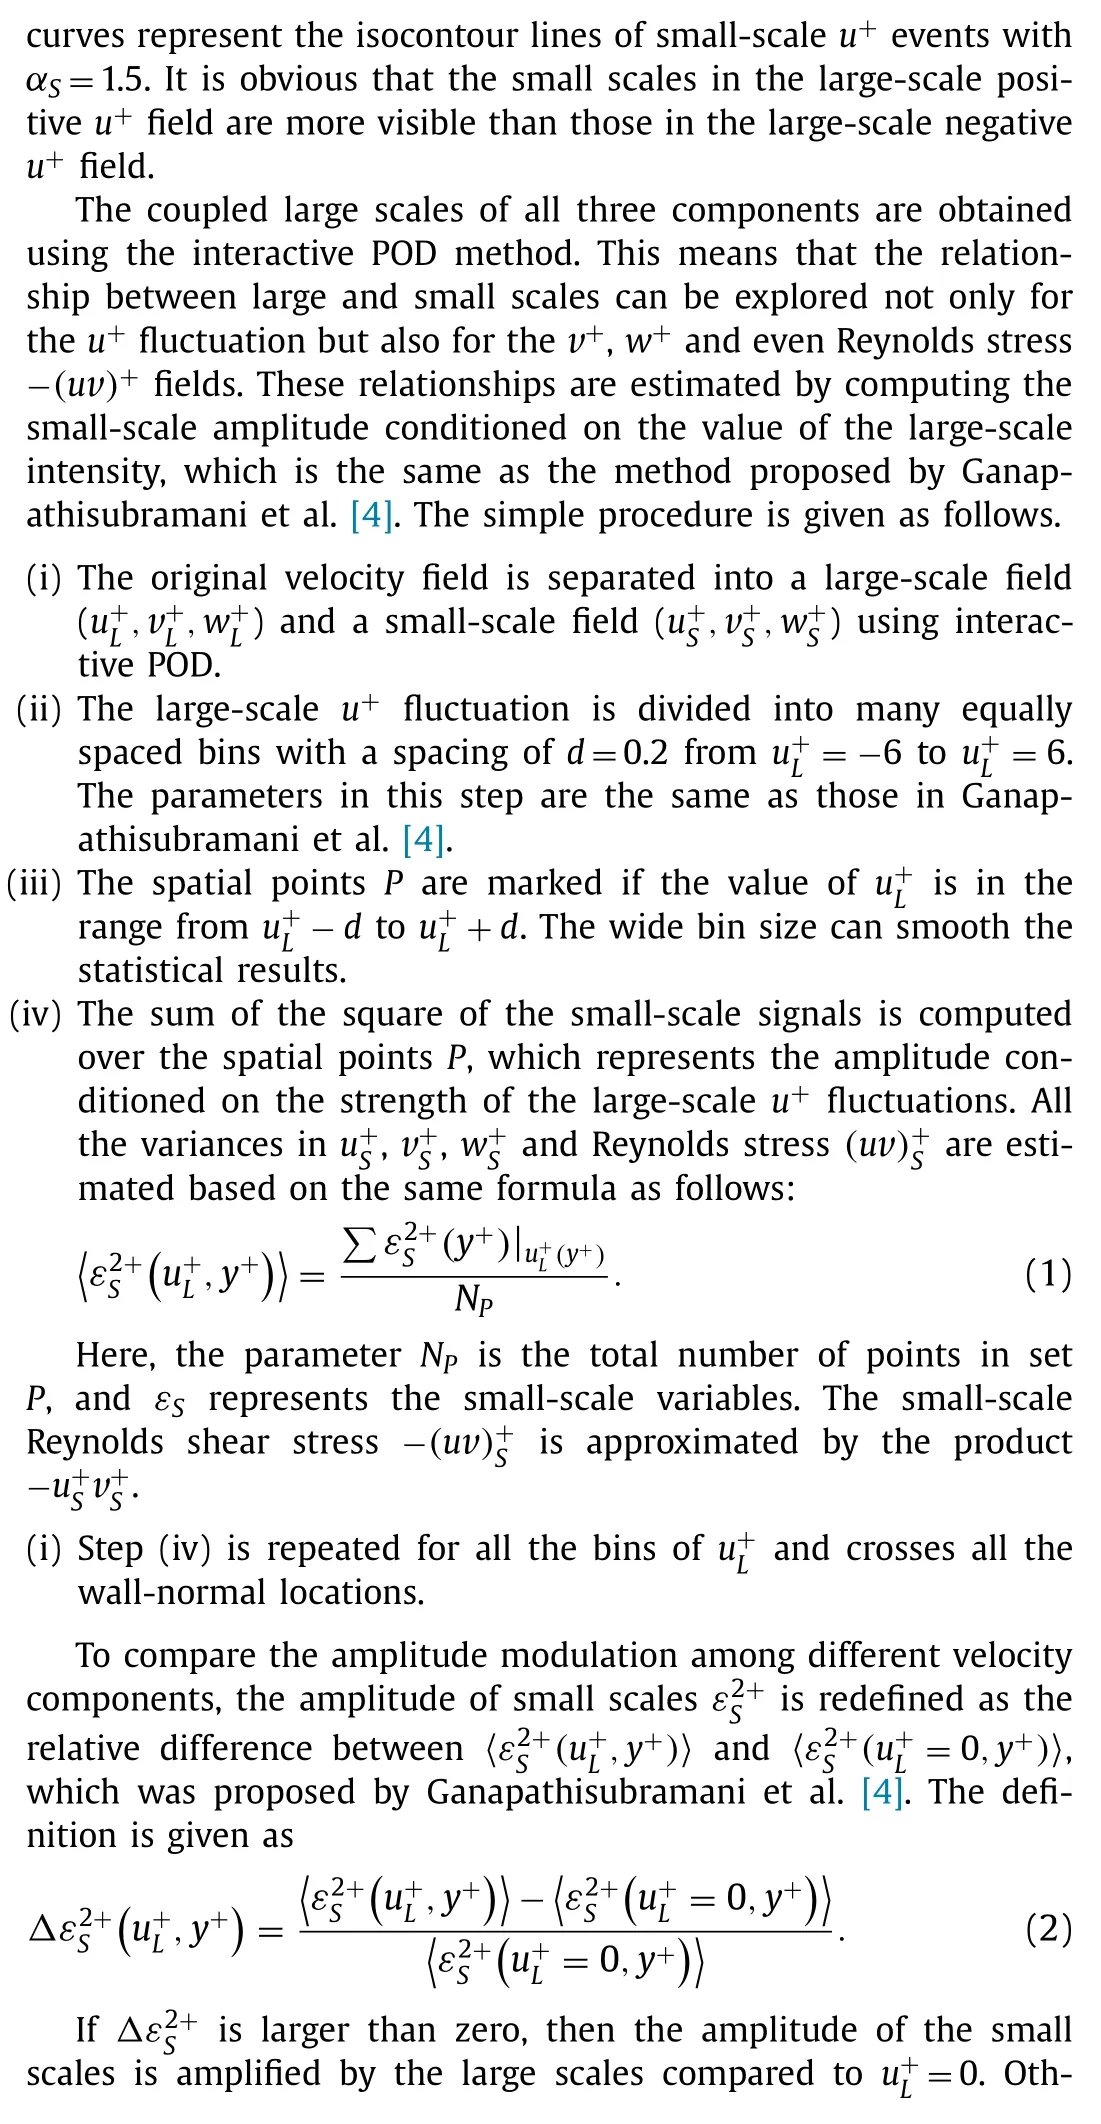
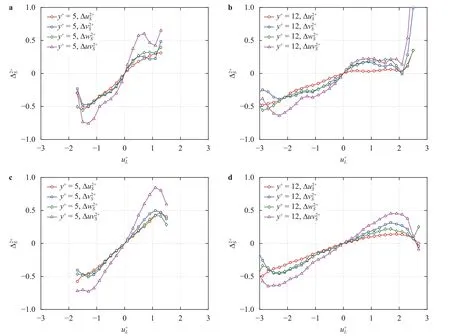
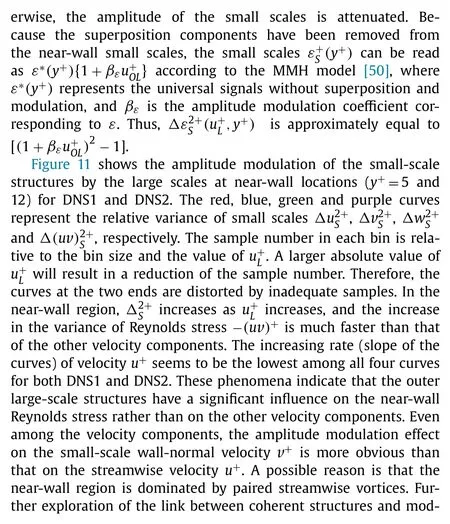
Fig.11.Plots of Δ (red),Δ (blue),Δ (green) and Δ(u v)(purple) as a function of the large-scale u+ fluctuation for DNS1 a,b and DNS2 c,d.The wall-normallocation of the left panel is 5,and that of the right panel is y+=12.(For interpretation of the references to color in this figure legend,the reader is referred to the web version of this article.)

5.3. Frequency modulation
Frequency modulation also exists in wall turbulence [4,29].Simply,in the near-wall region,the frequency of the small-scale fluctuations is attenuated by the negative large-scale fluctuations and amplified by the positive large-scale fluctuations.One method to estimate the frequency of the signals is to calculate the derivative of the phase,which can be deduced from the Hilbert transform.However,similar to the definition for the envelope of the small scales,the skewness of the small-scale fluctuations seems to influence the results [60].In this work,we adopt the peak-valley counting (PVC) procedure proposed by Ganapathisubramani et al.[4] to determine the frequency of signals.To investigate the differences between the streamwise and spanwise directions,the number count is performed along these two directions.The procedure is the same as that for amplitude modulation except for step iv:
(i) The local maximum or minimum along the streamwise or spanwise direction is targeted as one,and the other points are set to zero in the small-scale fields.A representative frequencyfS,which represents the frequency modulation on the condition of the strength of the large-scaleu+fluctuations,is counted using the number of peaks over the spatial pointsP.The frequencies ofand Reynolds stressare estimated based on the same formula as follows:
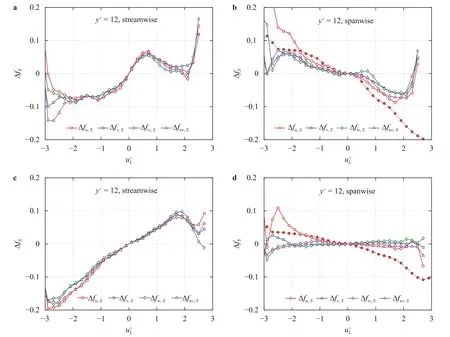
Fig.12. Plots of Δ f u,S (red), Δ f v,S (blue), Δ f w,S (green) and Δ f uv,S (purple) as a function of the large-scale u+ fluctuation for DNS1 a, b and DNS2 c, d.The left panels show the characteristic frequency in the streamwise direction,while the right panels show the characteristic frequency in the spanwise direction.The dashed line with red symbols represents the frequency modulation obtained from the FFT along the spanwise direction.All the wall-normal locations are y+=12.(For interpretation of the references to color in this figure legend,the reader is referred to the web version of this article.)
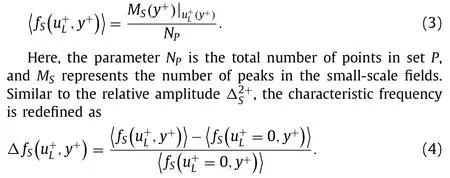
In the spanwise direction,the scale of the streamwise fluctuationsu+can be separated using the spectral filter method due to the existence of sufficient scale separation,as introduced in Sec 3.1.The characteristic frequency based on the fields from spectral decomposition can also be estimated from Eqs.(3) and (4).The results will be compared with those of POD.
Figure 12 shows the frequency modulation effect along the streamwise (left panels) and spanwise (right panels) directions for DNS1 (a,b) and DNS2 (c,d).Thex-axis represents the outer largescale streamwise fluctuation,and the curves with different colors represent the characteristic frequency of different velocity components.Note that the dashed lines with red symbols represent the frequency modulation of small-scaleu+obtained from FFT along the spanwise direction.All the results are estimated aty+=12.In the streamwise direction,the characteristic frequency increases with increasing large-scale fluctuation,although the curves atReτ=550 display an unexpected local minimum in the region of1.This phenomenon may be caused by insufficient scale separation at low Reynolds numbers and disappears in Fig.12c and 12d forReτ=1000.Compared with the amplitude modulations,the frequency modulations present a more similar behavior among all three velocity components and the Reynolds shear stress.The frequency modulation along the streamwise direction is consistent with the result of Ganapathisubramani et al.[4].However,it is interesting to note that the characteristic frequency in the spanwise direction displays a weak trend across the entire range ofu+Lfor the interactive POD result,which implies that outer large scales have limited influence on the spanwise frequency of small scales in the near-wall region.In particular,the dashed red lines calculated from the spectral filter method present a decreasing trend with increasing large-scale fluctuations.There are obvious differences in the streamwise and spanwise directions for frequency modulation.
In the work of Ganapathisubramani et al.[4],the streamwise velocity acquired in the high-Reynolds-number boundarylayer wind tunnel by hot-wire probes is used to examine the interaction between the large and small scales of the boundary layer.The temporal frequency modulation effect is highest in the near-wall region,and this effect decreases with increasing wallnormal distance.The authors explained that the increase in smallscale frequency is caused by a combination of augmented smallscale activity and convection at these small scales induced by the large-scale motions.The present results prove that the number of small-scale structures indeed increases in the streamwise direction with increasing large-scale streamwise velocity fluctuations.In wall-bounded turbulence,the convection velocity at large scales is much higher than that at small scales in the near-wall region del Álamo and Jiménez [61].The local high Reynolds number increases the local mean shear stress and then generates more small-scale structures in the streamwise direction.However,an opposite frequency modulation appears in the spanwise direction in which the number of small scales is suppressed by the large-scale velocity.More research is needed to further explain this result.
6.Conclusions
In this study,we use interactive POD to investigate the innerouter interactions of turbulent channel flows at low Reynolds numbersReτ=550 andReτ=1000.The spectral filter operation is unsuitable for velocity decomposition at relatively low Reynolds numbers due to the insufficient scale separation.Instead,the interactive POD method could be used to extract the footprint of the outer large-scale motion in the near-wall region.The outer velocity field aty+=3.9Reτ1/2is decomposed to obtain the large-scale modes.The premultiplied energy spectra of these modes indicate that the selected large-scale modesare indeed associated with outer large-scale or very large-scale motions.The velocity field in the inner layer is projected onto these modes to reconstruct the near-wall large-scale structures.It is worth noting thatis related to the wall-normal positiony+.The interaction of outer large scales at any wall-normal location with the near-wall cycle can be studied using this method.
The weighted joint PDFs of fluctuationsu+andv+for largescale motion and small-scale motion are given as a function of the wall-normal distance.The large-scale contribution is symmetrically distributed in quadrants 2 and 4 and has a similar contour shape.The large-scale contribution to -(uv)+presents a self-similar behavior.The contour of the small-scale contribution shows a variation when increasing the wall-normal location.
The superposition effect is explored by correlating the largescale fluctuations in the near-wall region with those in the outer region.The large superposition coefficientαindicates a high correlation of the large-scale motions along the wall-normal direction.Theαvalues ofv+andw+are smaller than that ofu+,and the inclination angleθLis larger than that ofu+.θLis nearly constant atθL≈13°in the near-wall region and then rapidly increases with increasing wall-normal distance.Furthermore,the correlation of small-scaleu+fluctuations at outer locations with those aty+=5 is almost zero.These results indicate that the outer large-scale structures can extend to the wall and that the influence of nearwall structures diminishes rapidly asy+increases.
The modulation of the small scales by the large scales is also investigated.The occurrence probability of small-scale structures conditioned on a large-scale positiveu+event is much higher than that conditioned on a large-scale negativeu+event.The amplitudes of small-scaleu+,v+,w+and Reynolds stress -(uv)+are computed conditioned on the value of the large-scaleu+intensity.Although all the small scales are modulated in a similar fashion,the amplitude modulation of the small-scale -(uv)+is the greatest among all the components.The Reynolds shear stress in the nearwall region is more easily controlled by the outer large-scale structures.Furthermore,the representative frequency is approximated by counting the number of peaks in the streamwise and spanwise directions.In the streamwise direction,the small-scale frequency is attenuated by the negative large-scaleu+fluctuations and amplified by the positive large-scaleu+fluctuations.The results ofv+,w+and -(uv)+are fully consistent with that ofu+.However,an interesting finding is that the spanwise frequency modulation exhibits an opposite trend to the streamwise frequency modulation.The small-scale frequency in the spanwise direction is attenuated by the positive large-scaleu+fluctuations at the present low Reynolds numbers.Further research is required to explore the reasons behind this phenomenon.
DeclarationofCompetingInterest
The authors declare that there is no conflict of interest regarding the publication of this paper.
Acknowledgments
This work was supported by the National Natural Science Foundation of China,Basic Science Center Program for“Multiscale Problems in Nonlinear Mechanics”(Grant No.11988102) and the National Natural Science Foundation of China (Grant Nos.91852204,11702302) and the National Key R&D Program of China(Grant No.2020YFA0405700).
杂志排行
Theoretical & Applied Mechanics Letters的其它文章
- Experimental investigation of sound absorption in a composite absorber
- A study on equivalence of nonlinear energy dissipation between first-order computational homogenization (FOCH) and re duce d-order homogenization (ROH) methods
- Stable heat jet approach for temperature control of Fermi-Pasta-Ulam beta chain
- Rotational dynamics of bottom-heavy rods in turbulence from experiments and numerical simulations
- Wall-resolved large-eddy simulation of turbulent channel flows with rough walls
- Constraine d large-e ddy simulation of turbulent flow over inhomogeneous rough surfaces
