Mechanization and efficiency in rice production in China
2021-06-02SHIMinKrishnaPAUDELCHENFengbo
SHI Min,Krishna P.PAUDEL,CHEN Feng-bo
1 College of Economics &Management,South China Agricultural University,Guangzhou 510642,P.R.China
2 Department of Agricultural Economics and Agribusiness,Louisiana State University (LSU) and LSU Agricultural Center,Baton Rouge,Louisiana 70803,USA
Abstract Agricultural mechanization and custom machine services have developed rapidly in China,which can influence rice production efficiency in the future.We calculate technical efficiency,allocative efficiency,and scale efficiency using data collected in 2015 from a face-to-face interview survey of 450 households that cultivated 3 096 plots located in the five major rice-producing provinces of China.We use a one-step stochastic frontier model to calculate technical efficiency and regress the efficiency scores on socio-demographic and physical land characteristics to find the influencing variables.Variables influencing technical efficiency are compared at three different phases of rice cultivation.We also calculate technical efficiency by using the Heckman Selection Model,which addresses technological heterogeneity and self-selection bias.Results indicate that:(1) the average value of technical efficiency using a one-step stochastic frontier model was found to be 0.74.When self-selection bias is accounted for using the Heckman Selection Model,the average value of the technical efficiency increases to 0.80;(2) mechanization at the chemical application phase has a positive effect on technical efficiency,but mechanization does not affect efficiency at the plowing and harvesting phases;(3) machines are overused relative to both land and labor,and high machine input use on the small size of landholding has resulted in allocative inefficiency;(4)rice farmers are overwhelmingly operating at a sub-optimal scale.Future policies should focus on encouraging farmland transfer in rural areas to achieve scale efficiency and allocative efficiency while promoting mechanization at the chemical application phase of rice cultivation to improve technical efficiency.
Keywords:technical efficiency,allocative efficiency,scale efficiency,rice farmers,stochastic frontier function
1.lntroduction
Rural reforms and open policies implemented in China in 1979 resulted in massive temporary migration of rural labor to urban areas.As a part of the broad-based market reform policies,the government of China relaxed the Hukou registration system to some extent to allow temporary labor migration to urban areas (Wanget al.2019).With the substantial difference in earnings between urban and rural areas after the 2000s,rural labor migration to urban areas accelerated (Yanget al.2013).As a result,the labor supply in rural areas has been declining,which has implications for agricultural productivity in the country (Zhanget al.2011).
One of the consequences of rural to urban migration is that farmers have started to purchase a large number of small and general-purpose machines for their own,joint,or custom use.From 1978 to 1988,the use of small tractors increased by 3.54 times.Machine uses in agriculture continued to grow registering 47.5% between 1988 and 1995(Jiet al.2012).One of the reasons for the rise in machine use is the opening of the machine use custom service,which began in Jiangsu Province in 1998.In 2003,farmers started the Combine Service Enterprise (CSE) Cluster.The CSE provided harvesting services in 12 provinces,reducing the burden of high fixed costs associated with machine and equipment purchases to farmers.The CSE’s initial success is fueled by a government subsidy (up to USD 10 000 per machine) to help less-resourceful farmers participate in the growing cluster (Yanget al.2013).In the midst of massive rural to urban migration,agricultural mechanization and custom service started to take a foothold in 2004.
It is widely believed that in the past two decades,mechanization has been the most important reason for the steady growth of agricultural production in China despite small farm sizes,high land fragmentation,and wage increase (Yanget al.2013;Wanget al2016;Abayet al.2019).The Chinese government emphasized mechanization in a circular released in December 2018.1http://english.www.gov.cn/policies/latest_releases/2018/12/29/content_281476456734454.htmAccording to the circular,the country will increase investment in research and development as well as the manufacturing of suitable machinery to increase agricultural productivity.The No.1 Central Document for 2020 proposes improving the agricultural production service system for smallholders.On February 12,2020,the Ministry of Agriculture and Rural Affairs of China proposed to improve and optimize subsidies for the purchase of agricultural machinery and promote the whole process of agricultural mechanization.2http://www.moa.gov.cn/govpublic/FZJHS/202002/t20200212_6336975.htmThe government plans to achieve that through the large-scale supply of agricultural mechanization and custom services that should fuel economies of scale in farming practices.
The development of agricultural machinery and other states of agriculture in China makes the need to assess mechanization’s effect on farm productivity.First,China has been experiencing a massive migration of rural laborers to urban areas.The situation of a large number of laborers working on small parcels of land for agricultural production no longer exists.The low land/labor ratio has been changing and will rise further with rural–urban migration,which may bring about farm efficiency changes.Second,the country has been experiencing rapid market and economic growth.Since 2004,there has been rapid farm mechanization in the areas of ownership and rental.Also,there has been rapid development of farm mechanization services that combine the provision of specialized labor and the services of large harvesting machines (Yanget al.2013;Wanget al.2016).However,little is known about whether and how mechanization changes the cost and output of small farmers’ agricultural production.Agricultural mechanization and its service may affect farm productivity.In particular,researchers and policymakers would like to know whether small farm households could increase their productivity through mechanization and custom machine services.
Many studies (Jiet al.2012;Wanget al.2016;Zhanget al.2017;Yiet al.2019) exist on mechanization and custom service and their effects on agriculture production efficiency in China.Most of these focus on the effects of mechanization on agricultural labor use.Wanget al.(2016) state that the relative price of machines against agricultural labor (wage)is the main driving force promoting mechanization in recent years.The substitution between labor and machine seems to be rather smooth,which supports the use of machines in agricultural production.They also note the role of farm size in determining technological efficiency.Jiet al.(2012)analyze the relationship between mechanization and labor by differentiating the role of owned machinevs.custom machine services.They indicate that agricultural labor input and small-sized machinery investment are gross complements rather than substitutes when machinery services are available.
On the other hand,an increase in off-farm employment is more likely to reduce the possibility of owning small-sized machinery,mainly due to substitution effects caused by the availability of market machinery services.Zhanget al.(2017) find mechanization leads to the division of labor.As the custom service is readily available for hire,migratory workers do not need to rush home during the peak crop growing seasons (planting and harvesting).The smallholder farmers can maintain their competitiveness despite their small and fragmented land size.Yiet al.(2019) find that mechanization and custom services are used to substitute labor to increase agricultural total factor productivity (TFP)and profitability.However,mechanization is not likely to increase crop yield significantly.
The above research mainly focuses on the relationship between mechanization and labor use.Some of these studies noted the critical role of farm size on mechanization.Our article contributes to the existing literature in three ways.First,considering the heterogeneity of the machine adoption by farmers and selection bias presence,we recalculate the technical efficiency using Heckman selection model.Second,we analyze the adoption of machinery at the laborintensive and technology-intensive stages and examine the use and influence of agricultural mechanization at different production stages.Third,we take farm size as an important factor to examine the farmers’ scale efficiency,and calculate allocative efficiency to determine whether the machinery input has been overused (or underused) with respect to land.These issues have not been analyzed in unison for Chinese rice producers in the past.
Our major finding is that the small land size per household and a large amount of agricultural machinery input cause allocative inefficiency.The emphasis on agricultural mechanization at labor-intensive phases of cultivation plus the existence of small size and fragmentation of the land cannot significantly improve technical and scale efficiencies.Future policies should focus on promoting chemical applications by machines to improve rice farmers’productivity.
We organize the remainder of this paper as follows.Section 2 provides detailed information related to the data and the estimation method used in the paper.Results from efficiency calculations are shown in Section 3.Conclusions and policy implications of our findings are presented in Section 4.
2.Data and methods
2.1.Data source
We conducted a face-to-face interview survey of farmers located in the five major rice-growing provinces of China between July and October 2015.The sampled farmers were selected in three stages.First,a set of eight counties was selected from five major rice-growing provinces.Second,two villages were randomly selected from each sampled county,except in Gaozhou and Dianbai counties,Guangdong Province,where we selected only one village each.Finally,about 30 rural households were randomly selected from each sampled village.We collected information from 450 rice farmers and their 4 659 plots.3The five provinces surveyed are the among the major rice growing provinces in China.During the survey,we asked,identified,and separated plots with rice production from non-rice production plots.Inputs (chemicals,fertilizer,machine use,labor,etc.) used for only rice production plots are considered in this study.We also removed non-rice production plots from consideration.Our final sample consisted of 3 096 rice plots cultivated by 450 farmers.
The survey was about farm households’ activity for cultivating rice in 2014.We collected information on sociodemographic and farm-related characteristics.Because farmers could grow more than one crop in each year and the production of different crops may need different inputs and production technologies,we treat the production of each crop as separate observations.We collected farm-level and plot-level data.The farm-level data are used to describe the farm’s overall characteristics.The plot-level data are used to describe what particular crops are grown and their input application.We use the amount of rice produced as output,and plot size,capital investment in machines,seed,fertilizer,chemicals,and labor farming time as inputs.These variables are used to calculate the technical and scale efficiencies of rice cultivation.We also use numbers of migrants,family size,numbers of children and elderly,the average educational level of adults in the household,age,education and health status of household head,and the plot size and land source to identify variables influencing technical efficiency.We use input prices to estimate allocative efficiency.Given that we are focusing on rice production only,we removed plots without rice production.Our final sample consists of 3 096 plots cultivated by 450 farmers.
2.2.Sample description
Description of input and output variablesAs shown in Table 1,on average a farmer harvested a total of 7.37 tons of rice from cultivated land.The average size of land cultivated by a farmer was 12.07 mu41 ha=15 mu.,out of which the farmer owned 6.4 mu and the remaining was transfer-in land5Land transfer has been increasing in the country after the implementation of the land titling policy in 2013 (Zhu et al.2020)..Farmers cultivated an average of 6.88 plots.Farmers spent 5 601.14 CNY61 USD=6.91 CNY (as of 8/24/2020).on machine use,including both their own machines and the hiring of machines from a custom service agency.Expenditures on seed,fertilizer,and chemicals were 941.58,2 210.36,and 1 660.77 CNY,respectively.The labor input is measured by working days on rice production in 2014,which was 193.47 days on average,including farm household and hired laborers.To calculate rice farmers’ allocative efficiency,we use the price of inputs.The average land transfer price was 295.41 CNY mu–1,and the average custom services machine use expense was 94.59 CNYmu–1.The average price of seed,fertilizer7Fertilizer use is calculated based on fertilizer conversion,which is the actual content of nitrogen (N),phosphorus (P2O5) and potassium(K2O).The price of fertilizer is equal to the total cost of purchasing fertilizer divided by the amount of primary nutrient content.Given different fertilizers have different N,P2O5,and K2O compositions,we decided to use fertilizer expenses rather than fertilizer quantities in the efficiency calculation.and chemical that rice farmers purchased were 53.78,0.62 and 114.48 CNY kg–1,respectively.The average price for daily labor was 172.62 CNY.
Description of rice farmers adopting agricultural machinesThe adoption of agricultural machinery by farmers is shown in Table 2.There are two aspects of agricultural machines use.One is when farmers purchase machine/equipment and use for their own crop production only.Machine value in that situation can be measured by the initial asset purchase price minus depreciation (plus salvage value) based on the number of years of use.The other option for machine use is renting machines or hiring custom machine service.The cost for custom service is calculated based on how much farmers paid to hire the service.
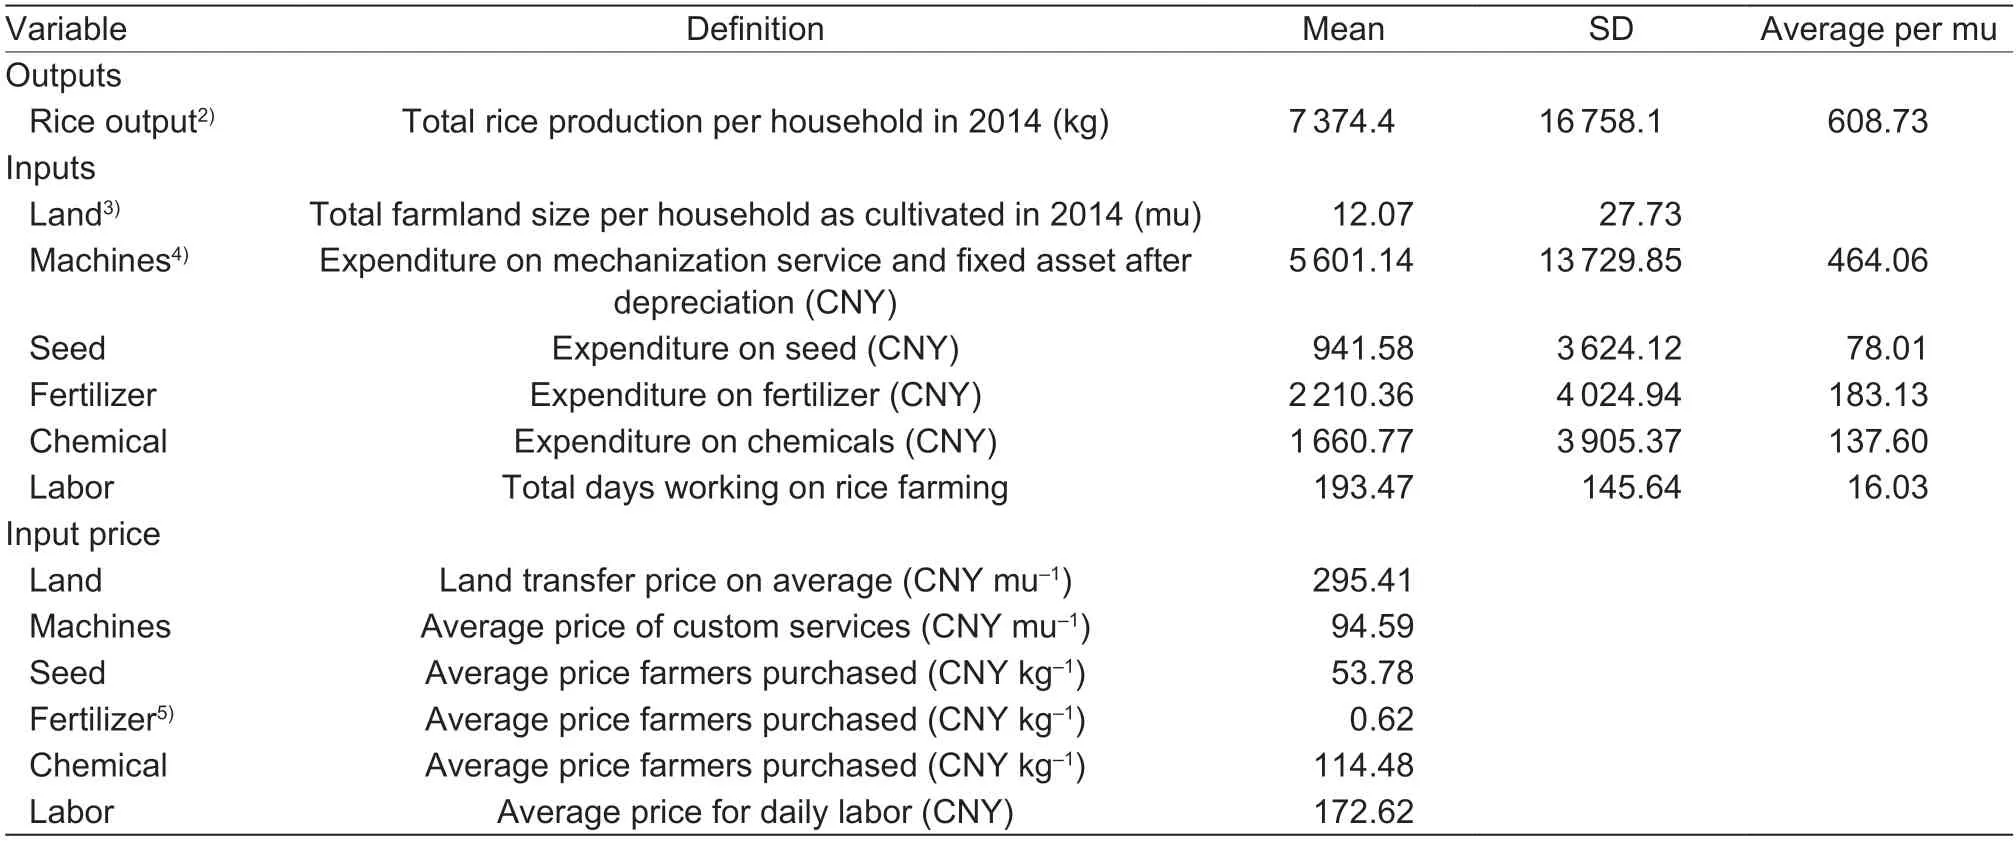
Table 1 Definition and descriptive statistics of variables used in efficiency calculation1)
Due to our emphasis on agricultural mechanization and its impact on efficiency,we subdivide rice cultivation into four phases,viz.,plowing,transplanting rice seedlings,chemical application,and harvesting.Mechanical transplanting of rice is very rare8There were only 17 plots out of 3 096 which used machines for transplanting rice seedlings.in China;rice is either direct seeded or transplanted using manual laborers.9Although the majority of rice production in the past was done using a manual transplanting system,direct seeding is becoming an attractive option because it is water saving and labor saving,and it offers similar rice yield (Liu et al. 2015;Sha et al. 2019;).Therefore,we do not consider the impact of mechanization at the transplanting phase of rice cultivation.
Concerning different phases of cultivation,92,59 and 92%of sample farmers adopted machines in plowing,chemical application,and harvesting.Moreover,57% of them adopted mechanization in all these phases.Additionally,many utilize custom services for machines.Specifically,62,4 and 89%of sample farmers hired a custom service for machines in plowing,chemical application,and harvesting.Only 2% of farmers hired a custom service for machines at all three phases of rice production.We described these numbers in detail later but those can be found in Table 2.We find that agricultural mechanization is more common at the laborintensive phases (plowing and harvesting) than at other phases of rice production.
Variables influencing rice farmers’ technical efficiencyBased on the previous study (Cai and Yan 2019),we include two different groups of influencing variables for technical efficiency:household socio-demographic characteristics and farmland characteristics.In all,there are 10 explanatory variables included in the model.Descriptivecharacteristics and the definitions of these variables are presented in Table 3.
We define the migrant variable as the number of adults in the household who work in other cities for more than six months.As shown in Table 3,there are 1.68 migrants on average in each household.In addition,we use family size,the number of children and elderly,and the adults’ average education to describe the rice farmers’ characteristics.The average household has about five family members.The adults’ average education in the household is 6.53 years of schooling.Given that in China children under the age of 6 and the elderly above age 80 need almost complete care (Qiaoet al.2015),we include a variable representing dependent population of the household in the regression model.On average,there are 0.47 children under six years old and 0.07 elderly over 80 years old in each household.We use age,education,and health variables to describe the household heads’ characteristics.The household head is on average 54.6 years old and has 6.77 years of schooling with health status of 1.46.10Health status is the self-reported response by the household head during the survey.The survey question asked the health question and provided three different options:=1 if household head’s health is good;=2 if household head’s health is normal;=3 if household head’s health is poor.

Table 2 Farmers adopting agricultural machines using self or custom operation at different phases of cultivation
In China,the farmland size per household is not only small but is also divided into many small plots.Fragmentation is the result of both the natural endowment of a collective and the consequences of the Household Responsibility System(HRS).Land fragmentation is one of the most important characteristics of farmland,and it affects rice farmers’productivity (Rao 2018;Wanget al.2018).Following Wanget al.(2018),we use land size per plot to show the problem of land fragmentation.This variable equals to total farmland area in mu divided by the total number of plots.The smaller the land size of the plot,the more serious is the fragmentation problem.Another variable reflecting the characteristics of land is land transfer.If the land is transferred-in,its quality may be different from that of land assigned to the farmer by the collective.There are only 6.9% sample farmers who have transferred-in land from market,relatives,or friends.
2.3.Empirical model
The Cobb–Douglas (CD) production function describes the transformation relationship from input to output (Kumbhakaret al.2015).Many studies (Zhanget al.2015;Imadet al.2019) describing the grain production have used the CD production function.More importantly,we need to derive the input demand function for calculating allocative efficiency(Kumbhakaret al.2015).This is possible analytically for some functions,such as the CD production function.However,it is not possible (analytically) for most production functions,including the translog.For such functions,one can compute the extent of the overuse (or underuse) of inputs numerically by solving systems of equations.These numerical solutions can then be used to compute the impact of allocative inefficiency on cost.Therefore,for the ease of calculation,we use the CD production function.
Based on the CD production function,we calculate technical efficiency (TE),allocative efficiency (AE),and scale efficiency (SE) for rice farmers.TE measures the ability of a particular rice farming household to produce the maximum feasible output from a given bundle of inputs or produce a given level of output using the minimum feasible amounts of inputs.SE is a measure inherently related to the returns to scale of a technology at any specific point in the production process.It can measure how close an observed farm is to the optimal scale (Madau 2015).AE measures the ability of a technically efficient rice farming household to use inputs in proportions that minimize production costs given input prices.AE is calculated as the ratio of the minimumcosts required by the rice farming household to produce a given level of outputs and the actual cost of the rice farming household adjusted for TE (Watkinset al.2014).There is a lack of studies that have estimated Chinese rice farmers’allocative efficiency.Therefore,we calculate the input allocative efficiency for machines and labor (relative to land).
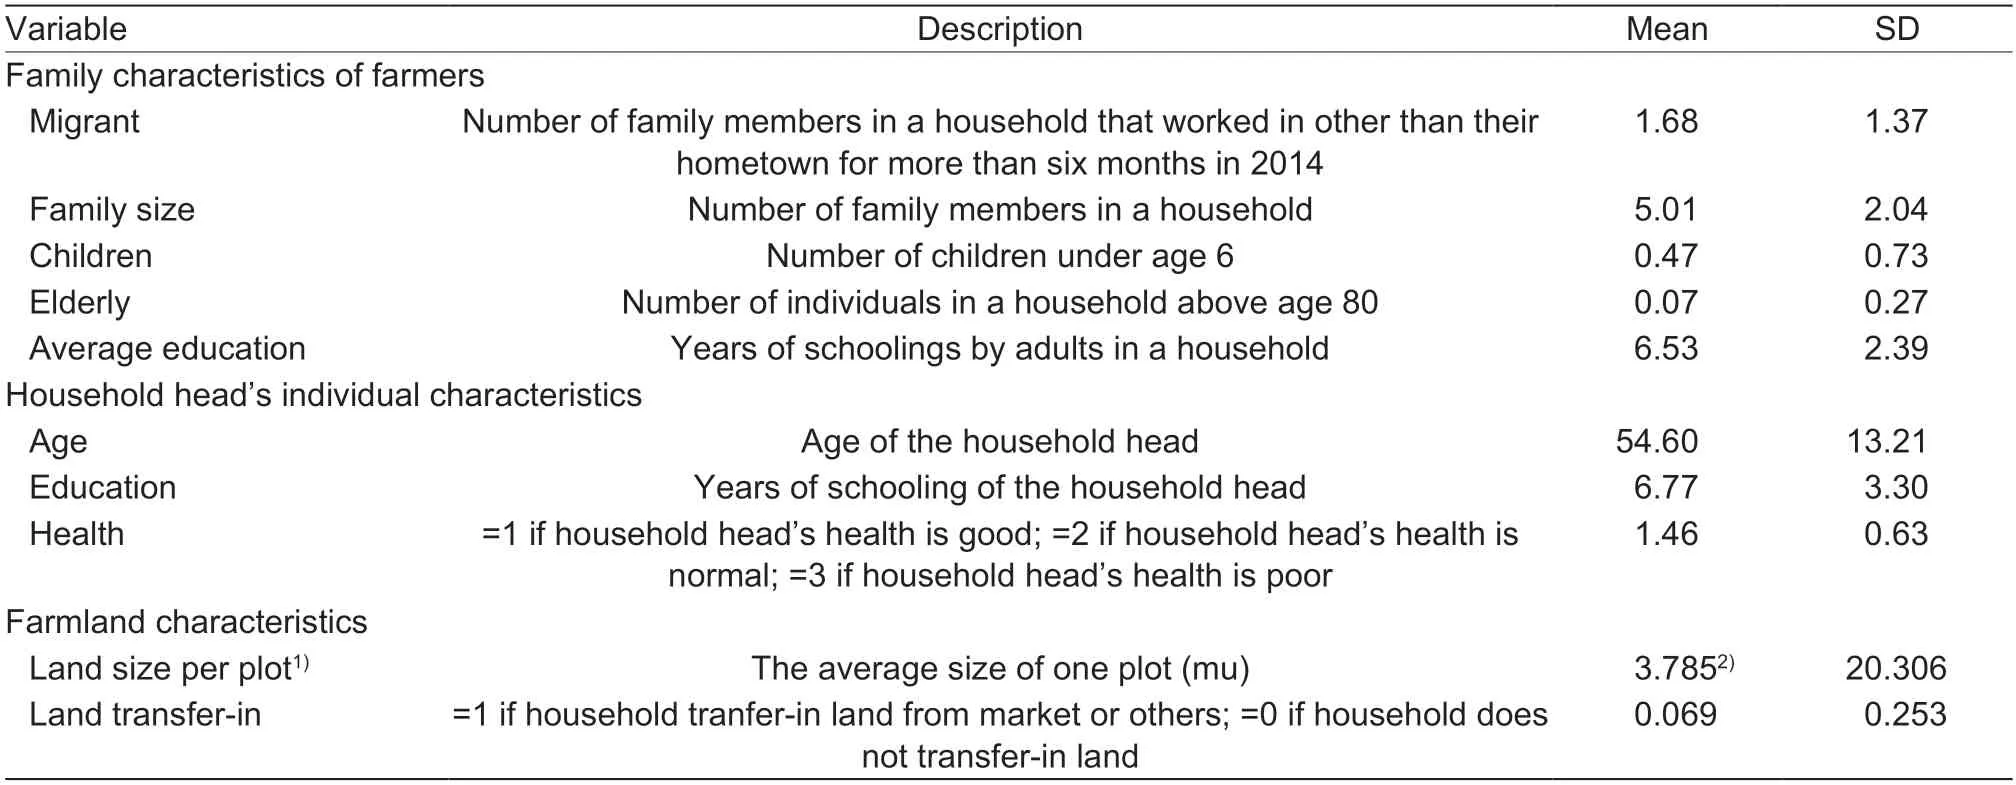
Table 3 Descriptive statistics of socio-demographic variables affecting farmers’ technical efficiency
One-step stochastic frontier modelWe use a one-step stochastic frontier model (SFM) developed by Wang and Schmidt (2002) to calculate technical efficiency and find the influence of socio-demographic and plot characteristics on efficiency values.
To determine the variables affecting the TE,the relationship between efficiency and its potential determinants needs to be modeled and estimated first.The TE is calculated as:

Theuiis for the technical inefficiency item.We assumeui,a non-negative random variable,follows a non-negative truncated normal distributionui~N(mi,),and the variables affecting efficiency are independently distributed.Therefore,the technical efficiency’s effective variables models are as follows:

TheXjis exogenous socio-economic-demographic variable that influence TE;δjis a parameter to be estimated.Ifδj<0,it means that the variable has a positive influence on TE.Ifδj>0,it means that the variable has a negative influence on TE.wiis a random error term.
The one-step SFM estimators are based on a correctly specified model and the estimators are asymptotically optimal.Some recent papers (Yang Jet al.2016;Yanet al.2019;Zhouet al.2019) have adopted a one-step SFM approach to calculate the TE of grain producing farms in China.
Allocative efficiencyIn a cost minimizing framework,input allocation is optimal if producers allocate inputs in such a way that input price ratios equal the ratio of their marginal products.The cost minimization problem for a rice farmer is:

wherewis the vector of input prices,xis the vector of inputs,yis the output,vis the random error,anducaptures the output-oriented inefficiency.The first-order conditions of the above problem can be expressed as:

wherewjs=wje§jand §j≠0 is allocative inefficiency for the input pair (j,1).That is,a farmer is allocative inefficient when he or she fails to allocate inputs in a way that equates the marginal rate of technical substitution (MRTS) with the ratio of the respective input prices.
However,estimation that accounts for allocative inefficiency is not straightforward with the widely adopted dual approach (which consists of a cost function and the first-order conditions).This is because estimation of the cost system is difficult (a closed-form expression of the likelihood function is not possible).Schmidt and Lovell (1979) show that the cost frontier problem can be reformulated as a primal problem that enables the estimation of the model parameters.It starts from the production function and uses a system consisting of the production function and the first-order conditions of cost minimization.The system is algebraically equivalent to the cost system for self-dual production functions.And it starts from the CD production function:

and the first-order condition of cost minimization,viz.,

For the CD production function,the algebraic formula can be derived.In our paper,the production function and the first-order conditions (FOCs) for the CD production function are:

whereyistands for the output for theith rice farmer,vis the random error,anducaptures the output-oriented inefficiency.Thexi1andwi1represent land input and land rental prices for theith rice farmer,respectively.Thexij,andwijrepresent a column vector of input and input price,respectively.Thej=2,…,6 stands for machine,labor,seed,fertilizer and chemical input.
Allocative inefficiency,§j,for the input pair (j,1) can be obtained from the residuals of the FOCs of eq.(7).The sign of§jshows whether inputjis overused or underused relative to land input.
Scale efficiencyIt is important to calculate scale efficiency because a farm could be efficient from the technical and allocative sense but it may not efficient scale wise.Scale efficiency is calculated based on the economies of scale.
Given SFM is based on the CD production function,

The input elasticity ofxjis given by

which is constant for all observations but varies across inputs.
RTS are given by

Using the value of RTS,we can observe all three returns to scale.If RTS>1,the farmers operate with increasing returns to scale;if RTS=1,they operate at constant returns to scale;if RTS<1,they operate with decreasing returns to scale.
3.Results and discussion
3.1.Technical efficiency
The distribution of the TE score of surveyed rice farmers by using one-step SFM (Table 4).The average TE score is 0.74.The result implies that on average rice farmers can reduce about 26% of their inputs to produce the same amount of output as an efficient farm located on the production frontier.Our average TE score compares to the lower range of values obtained by previous studies on rice production in China (Tanet al.2010;Maet al.2014;Yang Z Het al.2016;Zhanget al.2016).Tanet al.(2010) use data collected from rice producers in 2000 from South-East China and find TE scores to be 0.91,0.80 and 0.89 for early rice,mid-season rice and late rice,respectively.In a study by Maet al.(2014) using data collected from rice farmers in southeastern China in 2008,they find the TE score to be 0.84.Yang Z Het al.(2016) report a TE score of 0.84 based on the data collected from rice farmers in Hubei Province in 2013.Zhanget al.(2016) find TE scores of rice producers in Jiangsu Province to be 0.77,0.72 and 0.75 in 2002,2006 and 2010,respectively.
Approximately 70% of the farmers had a TE score of 0.70 or higher (Table 4).The minimum and maximum TE scores are 0.21 and 0.94,respectively.The large range in the efficiency score indicates heterogeneity among rice farmers.Therefore,it is helpful to find critical variables influencing the TE score in order to improve rice farmers’ efficiency.
The estimated results of technical efficiency and its influencing variables are shown in Table 5.There are two parts in Table 5.Panel 1 is the production frontier estimate for rice farmers,and Panel 2 is the result of the influencing on technical efficiency.The second column in this table shows an estimate of the base model without dummy variable for adoption by machinery.Columns 3–5 show the effects of mechanization at three different phases of cultivation(plowing,chemical applications,and harvesting) by putting the dummy variables used by the machine separately.
The column titled“Base model”in Panel 1 of Table 5 shows the rice production efficiency model.The parameter estimation shows the elasticity of production for inputs;i.e.,it shows the percentage change in output when there is a one percent change in a given input.The results show that all inputs,except labor,are statistically significant.Of all the inputs,output elasticity of land is the largest one.Otherstudies have also found the contribution of land to be the highest in the rice production function (Tanet al.2010;Yang Jet al.2016).The output elasticity of land is around 64%and significant at a 1% level.This means that,in comparison to other inputs,increased land input will increase output the most.Other inputs,like fertilizer and chemical expenses,are important contributors to rice production output with a combined value equaling 35%.The added fertilizer and chemical input can compensate for the negative effect of labor scarcity and promote the improvement of arable land use intensity (Zhanget al.2015;Liuet al.2016;Huet al.2019).However,in our case the estimate of machines’output elasticity is only 1.1%.It indicates that machine use has a limited effect on output.Our result is consistent with recent papers published using Chinese data (Maet al.2014;Zhanget al.2016;Yiet al.2019;Zhouet al.2019).Maet al.(2014) find that the output elasticity of fertilizer is 25.4%.Zhouet al.(2019) find that mechanization and custom services are used to substitute for labor to increase farm productivity and profitability,although mechanization is not likely to increase crop yield significantly.In our study elasticity of labor is not significant,which is also similar to the findings by Zhanget al.(2016).
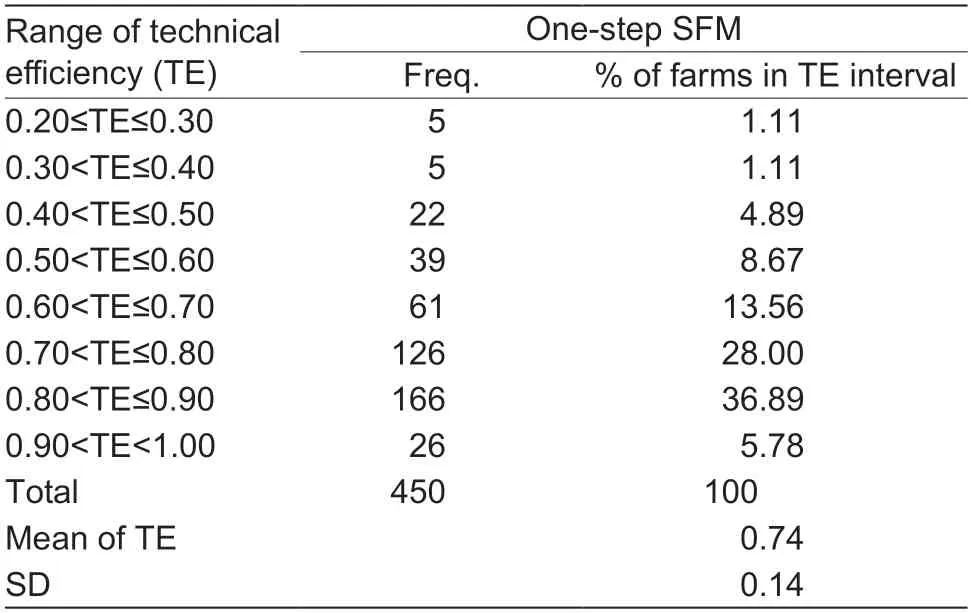
Table 4 Distribution of rice farmers’ technical efficiency scores by one-step stochastic frontier model (SFM)
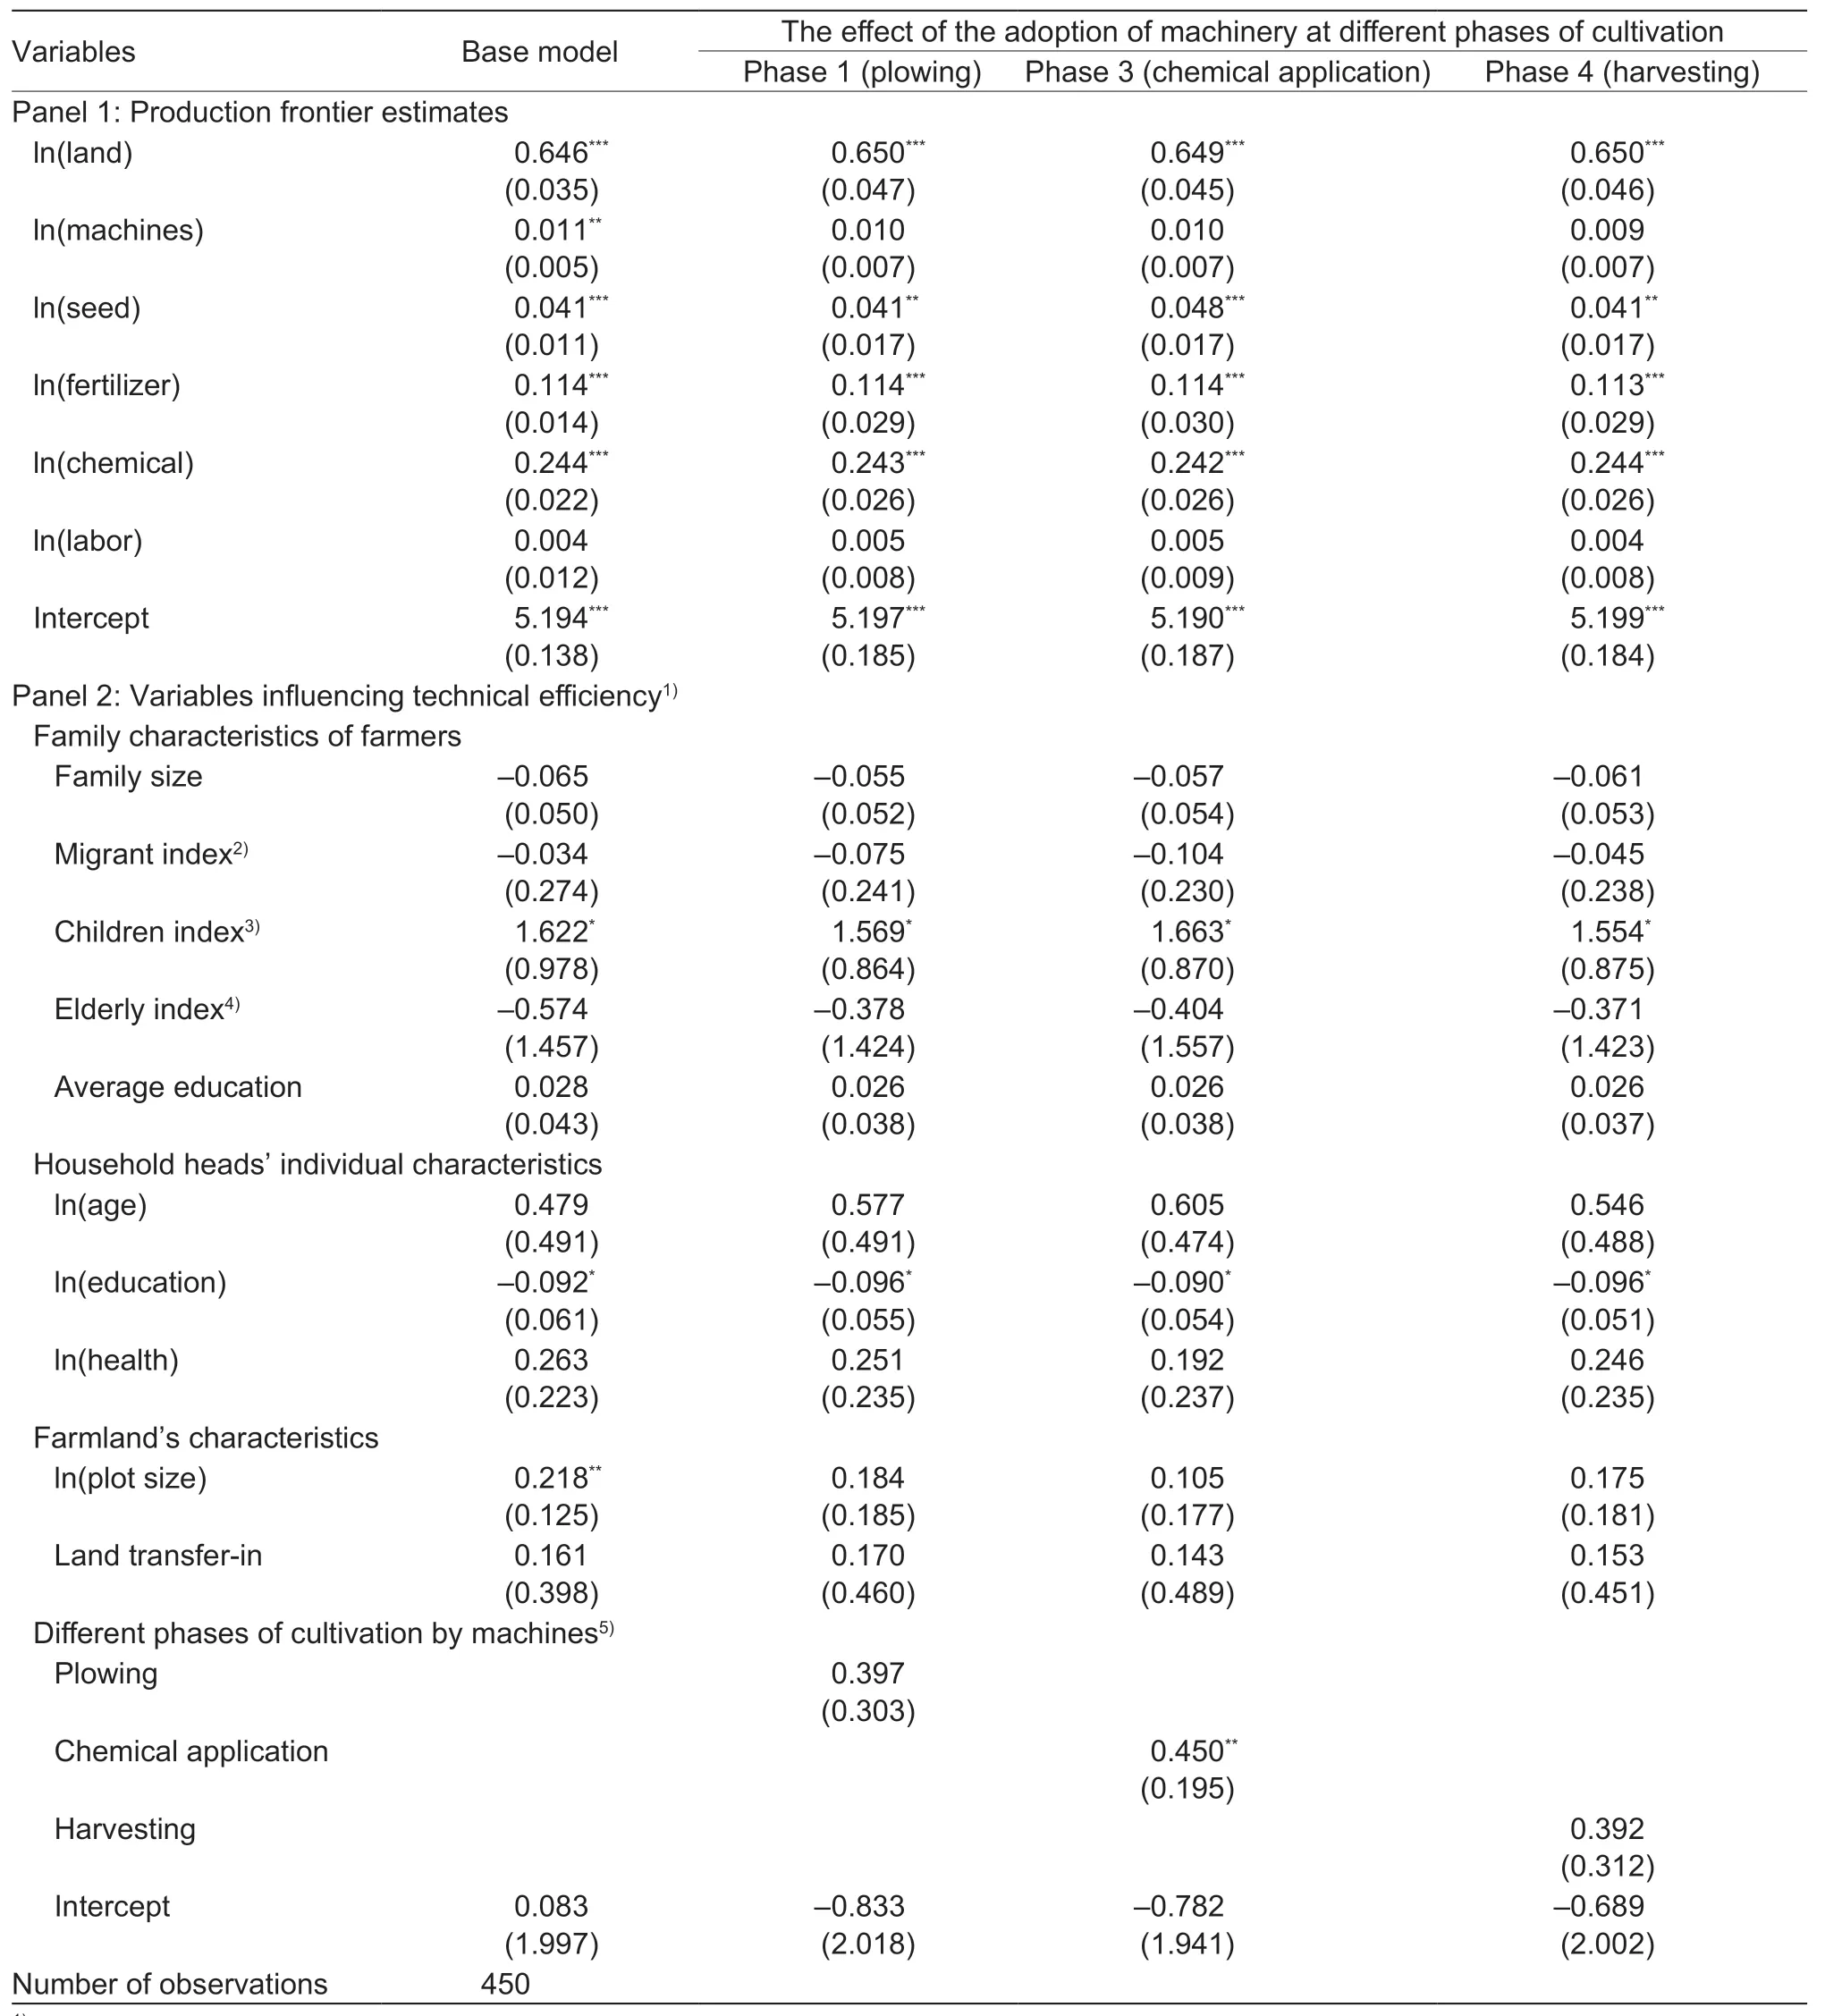
Table 5 Technical efficiency and variables affecting rice farmers’ technical efficiency in the study area
The column titled“The effect of adoption of machinery at different phases of cultivation”in Panel 1 of Table 5 shows the specific phase of cultivation for which the model parameters are estimated.These phases are plowing,chemical applications,and harvesting.A dummy variable is added to each phase of production that reflects the use of machinery at that phase.The parameters obtained at three phases are not much different from the base model.However,the elasticity of machine use is not significant at all the three phases of cultivation.It may be that by adding dummy variables for agricultural machinery,the significance of the impact of mechanical input on output is reduced.
3.2.The effect of farmers’ adoption of machinery on technical efficiency
Panel 2 of Table 5 shows variables influencing technical efficiency.It is estimated for the base model and three specific phases,viz.,plowing,chemical application,and harvesting.The purpose of distinguishing different phases is to measure the effect of mechanization on technical efficiency under different phases of cultivation.We categorize explanatory variables into the family characteristics of farmers,household heads’ individual characteristics,farmland’s characteristics,and dummy variables representing different phases of cultivation.We estimate the impact of variables on the inefficiency.11Notice as written in eq.(2),the model describes variables affecting inefficiency.We change the positive and negative sign (change the positive to negative and the negative to positive) of coefficients and explain the influence of variables on technical efficiency in Table 5 and in text.
The first category of variables is the family characteristics.These variables are family size,migrant index,children index,the elderly index and average education of adults.The coefficient associated with the variable“children index”to efficiency effect is 1.622,and it is significant.The coefficient indicates that the more children there are to take care of in a household,the higher the TE score.In rural China,parents temporarily migrate to the city to work and leave their children with grandparents,resulting in many three generational households (Chenet al.2016).In our sample,76.65% of surveyed households have migrant workers.Some studies (Liuet al.2016;Qianet al.2016;Yang Jet al.2016;Zhanget al.2016;Zhonget al.2019)have explained the influence of parental migration and childcare on agricultural production.Zhanget al.(2016)find a positive and significant effect of off-farm employment on the level of farm technical efficiency.Liuet al.(2016)find that added fertilizer and pesticide inputs can ultimately compensate for the negative effect of labor scarcity.Yang Jet al.(2016) find that the remittance from migrant workers relaxes the capital constraint;farmers can buy more fertilizer,chemicals or machines/machine services.In addition,the need for domestic work pushes more capital input (fertilizer,chemical or machines) to substitute labor,and then that may improve TE.
The second category of variables is household heads’individual characteristics.As shown in panel 2 of Table 5,the household head’s education level has a negative effect on TE,and it is significant at 10%.This means that farmers with more years of schooling adversely affect technical efficiency.Zhanget al.(2016) explain this result by stating that a higher level of education helps farmers to find off-farm jobs easily.Off-farm employment affects the TE of farms,as the household head is not able to spend lots of time in farming,thereby resulting in a negative effect on farm efficiency.
Many studies (Tanget al.2015;Zhanget al.2016;Shaet al.2019) indicate that land fragmentation is an important negative determinant of TE.Land fragmentation can be measured by land size per plot.In our study,the plot size has a positive impact on TE,and it is significant at the 5%level.The result shows that if land fragmentation is low,the TE gets higher,which is consistent with previous research.
The last few rows of Table 5 show the estimated results of variables that affect TE at the three production stages of machinery adoption.Some studies (Chenet al.2012;Dong 2017) divide the agricultural production process into labor substitution-oriented and technology-oriented production phases,and analyze the mechanical outsourcing service behavior at these phases.On the basis of these studies,we divide rice production into labor-intensive and technology-intensive phases.Mechanization at the plowing and harvesting phases,which are labor-intensive phases,does not have a significant effect on TE.Only mechanization at the chemical application phase,which is a technology-intensive phase,has a positive effect on TE,and it is significant at a 5% level.Chemical application using precise machinery (including drones or variable rate application precision chemical sprayers) can increase yield as well as save chemical costs for farmers.12http://bianke.cnki.net/Web/Article/BJNY201207047.htmlPromoting chemical application using precise spray technology has the potential to substantially improve TE for farmers.
3.3.Technical efficiency accounting for technological heterogeneity and self-selection
In Section 2,we use the one-step SFM to estimate the TE of farmers.However,it ignores the endogenous problem of input and technological heterogeneity,which may lead to self-selection bias.As Shee and Stefanou (2015) point out,if a firm observes some part of its efficiency and productivity,its input choices may be influenced,resulting in a simultaneity problem in the stochastic production frontier estimation.In our study,farmers may observe a variety of productivity and efficiency influencing variables and adjust their inputs quickly,such as labor and materials.That would lead to a biased likelihood estimation of the stochastic production frontier models.To control for selection bias,Heckman(1979) proposes a two-step procedure,namely the Heckman Selection Model (HSM),to obtain the inverse Mill’s ratio(IMR),which is then used as an additional regressor in the second-stage model.Similarly,Lee (1978) controls for selection bias using an endogenous switching regression model.We recalculate TE scores using the HSM.
From Section 3.1,we know that the mechanical adoption behavior of farmers at the chemical application phase is the most different among all production phases,and their adoption behavior has a significant impact on TE.Therefore,we pay attention to farmers’ adoption behavior at the chemical application phase and try to eliminate their selection bias.Following Heckman (1979) and Lee (1978),the probability that a household chooses to adopt machines at the chemical application phase is estimated by probit model.The first step of the HSM is to calculate the IMR,which is obtained from the linear prediction of the probit model.The results of the probit model for mechanization adoption on the chemical application phase are shown in Table 6.The results show three variables that family size,plot size and market distance have a significant impact on the behavior of the farmers’ choice of mechanical chemical application.The variable market distance,which means the distance from a farmer’s home to market,is used to identify the model and is not included in the second step of regression.
TheIMRis defined as:

if the household adopt machines at the chemical application phase,whereφandφdenote the nomal density and the cumulative normal distributions,respectively.
In the second step,theIMRis included among the exogenous variables of the production frontiers to correct for possible selection bias.The production function for theith farmer is specified as:

where theQiis the amount of rice harvested,Xjiis a vector of observations on inputj,theα’s are unknown parameters to be estimated,vis a random error term,anduis a nonnegative random variable representing technical inefficiency.The technical inefficiency effects model for farmeriis defined as:

whereZjis a vector of observations on variablejthat is expected to have an impact on the level of technical efficiency,theδ’s are unknown parameters to be estimated,andeis a random error term.
The TE scores distribution by using the HSM are shown in Table 7.The average score is 0.8,which is higher than the result calculated using the one-step SFM.Compared with previous studies (Tanet al.2010;Maet al.2014;Yang Z Het al.2016;Zhanget al.2016),this score is at an intermediate level.The proportion of farmers with high TE score is relatively high,accounting for 50.67% of farmers whose TE value is between 0.9 and 1.
3.4.Allocative efficiency
As shown in Table 8,the mean values of machines andlabor’s allocative inefficiency are negative (–1.300 and–0.726,respectively),and their expectations are 0.273 and 0.484,respectively.Both of them have expectations below 1,and land/machines and land/labor ratios are on average lower than the cost minimizing ratios.This result shows both machines and labor are overused relative to land.This result also shows that machines are overused relative to both land and labor.13Farmers may be overusing machines,perhaps unknowingly,to address labor shortages or to maximize profits,the latter could be explained by using the Averch-Johnson hypothesis (Averch and Johnson 1962).This hypothesis says firms overcapitalize to expand the volume of profit.When looking at each farmer’s allocative efficiency,we find that about 34% of rice farmers overused machines relative to both labor and land.This indicates that land should be expanded to match the machine use to improve allocative efficiency.
3.5.Scale efficiency
The majority of rice producers are scale inefficient.The value of rice farmers’ returns to scale is shown in Table 9.The mean value of RTS is 1.093,and scale efficiency value is found to be 1/1.093=0.91.The value implies farmers are operating under a sub-optimal scale and are inefficient in their resource utilization.We find that only three farmers were operating at decreasing returns to scale.All other farmers were operating at increasing returns to scale.Farmers who are operating at increasing returns to scale should increase their size of operation,whereas farmers who are operating under decreasing returns to scale should reduce the size of the operation.Given so many farms are operating at increasing returns to scale,rice farmers should increase their scale of production to improve scale efficiency.

Table 6 Results of the Probit model for mechanization adoption on the chemical application phase
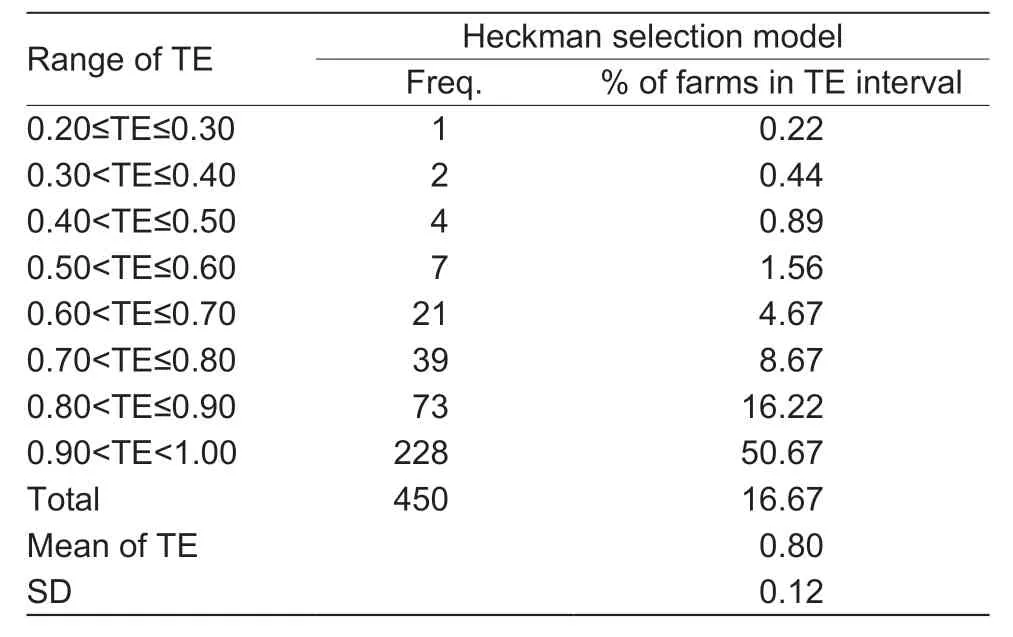
Table 7 Distribution of rice farmers’ technical efficiency (TE)scores by Heckman selection model

Table 8 Allocative efficiency of rice farmers in the study area

Table 9 Returns to scale of rice farmers in China
4.Conclusion and policy recommendations
We measured how mechanization has influenced farm efficiency in rice production in the Chinese context.We calculated technical efficiency and found socio-demographic and plot characteristics influence efficiency scores.To solve the problem of self-selection bias,we recalculated TE using the HSM.We also calculated allocative efficiencyand scale efficiency.
We found that the average TE score calculated by the one-step SFM was 0.74.When we calculated TE using HSM,the average TE score was 0.8.The output elasticities of land and machine input were around 64 and 1.1%,respectively,and both were significant.These elasticity values indicate that increased land input increases output,but machine use had a limited effect on output.The mechanization and custom services are primarily used to substitute for labor,and those are less likely to increase yields.Comparing machines use at different phases of rice cultivation;we found the impact of mechanization on TE is different.At the plowing phase,mechanization had no significant impact on TE.At the chemical application phase,mechanization had a positive impact on TE.Chemical applications by machines could save inputs and thus improve farm productivity.The value of scale efficiency is 0.91.More than 99% of farmers had increasing returns to scale,and they were operating under a sub-optimal scale.About 34% of farmers overused machines relative to landholding size.Although rice farmers had adopted machines in the rice production process,many were not technically efficient because of their small farmland size.The emphasis on agricultural mechanization at laborintensive phases of cultivation (plowing and harvesting),plus the small size and fragmentation of the land,results in farmers using agricultural machinery that cannot significantly improve technology efficiency and scale efficiency.
Given these realities and the study results,two policies can be implemented to improve rice farmers’ productivity in China.The first policy that the government can implement is the continuous facilitation of farmland transfer to achieve optimal production scale.Land transfer market development would be crucial to bringing this to reality.About 59% of sample farmers adopted machines in chemical applications.Specifically,only 4% of sample farmers hired a custom service for machine use.The use rate of mechanized chemical applications is low,so efficient application of chemicals can increase farm profit and improve environmental quality.Therefore,the second policy is to promote mechanized chemical applications.
Acknowledgements
The authors acknowledge the financial support from the National Social Science Foundation of China (14BGL094),the Rice Research System in Guangdong Province,China(2019KJ105) and the EU Project H2020 Program (822730).Paudel’s time on this paper was supported by the United States Department of Agriculture (USDA),National Institute of Food and Agriculture (NIFA) funded Hatch projects(#94382 and #94483).
Declaration of competing interest
The authors declare that they have no conflict of interest.
杂志排行
Journal of Integrative Agriculture的其它文章
- Monilinia fructicola on loquat:An old pathogen invading a new host
- Farmers’ risk preference and fertilizer use
- Simple method for extracting the seasonal signals of photochemical reflectance index and normalized difference vegetation indexmeasured using a spectral reflectance sensor
- Winter wheat yield estimation based on assimilated Sentinel-2 images with the CERES-Wheat model
- Monthly composites from Sentinel-1 and Sentinel-2 images for regional major crop mapping with Google Earth Engine
- Response of carbon footprint to plastic film mulch application in spring maize production and mitigation strategy
