Simple method for extracting the seasonal signals of photochemical reflectance index and normalized difference vegetation indexmeasured using a spectral reflectance sensor
2021-06-02JaeHyunRYUDohyeokOHJaeilCHO
Jae-Hyun RYU,Dohyeok OH,Jaeil CHO
Department of Applied Plant Science,Chonnam National University,Gwangju 61186,Republic of Korea
Abstract A spectral reflectance sensor (SRS) fixed on the near-surface ground was developed to support the continuous monitoring of vegetation indices such as the normalized difference vegetation index (NDVI) and photochemical reflectance index (PRI).NDVI is useful for indicating crop growth/phenology,whereas PRI was developed for observing physiological conditions.Thus,the seasonal change patterns of NDVI and PRI are two valuable pieces of information in a crop-monitoring system.However,capturing the seasonal patterns is considered challenging because the vegetation index values estimated by the reflection from vegetation are often governed by meteorological conditions,such as solar irradiance and precipitation.Further,unlike growth/phenology,the physiological condition has diurnal changes as well as seasonal characteristics.This study proposed a novel filtering method for extracting the seasonal signals of SRS-based NDVI and PRI in paddy rice,barley,and garlic.First,the measurement accuracy of SRSs was compared with handheld spectrometers,and the R2 values between the two devices were 0.96 and 0.81 for NDVI and PRI,respectively.Second,the experimental study of threshold criteria with respect to meteorological variables (i.e.,insolation,cloudiness,sunshine duration,and precipitation) was conducted,and sunshine duration was the most useful one for excluding distorted values of the vegetation indices.After data processing based on sunshine duration,the R2 values between the measured vegetation indices and the extracted seasonal signals of vegetation indices increased by approximately 0.002–0.004 (NDVI) and 0.065–0.298 (PRI) on the three crops,and the seasonal signals of vegetation indices became noticeably improved.This method will contribute to an agricultural monitoring system by identifying the seasonal changes in crop growth and physiological conditions.
Keywords:photochemical reflectance index,normalized difference vegetation index,vegetation,remote sensing,spectral reflectance sensor
1.Introduction
Observation data based on spectral reflectance have been widely used to monitor crop conditions and estimate the crop yield (Aparicioet al.2000;Maet al.2001;Sims and Gamon 2002;Frelset al.2018;Jeonget al.2018).Such information includes crop behaviors caused by abiotic and biotic factors,such as disease,water,and heat stress(Koganet al.2004;Suárezet al.2008;Ohet al.2018).The ratio vegetation index (RVI),which is a well-known simple ratio (SR),was developed using the reflectance of the red and near-infrared (NIR) spectra (Birth and McVey 1968),which is denoted as NIR/red.Various vegetation indices have also been created by considering the spectral reflectance properties of vegetation.They can be classified as structural,biochemical,and physiological vegetation indexes depending on the characteristics and functions of the vegetation.
Spectral reflectance has been observed at various spatial scales,such as in the leaf,stand,and canopy of a crop (Ryuet al.2018),using optical devices such as radiometers and spectrometers aboard a drone,or in an airborne or spaceborne vehicle.Airborne and spaceborne detections are advantageous for repeated measurement of the reflectance within a wide area.However,such vehicles have a critical limit for the achievable temporal resolution,owing to a non-routine flight schedule and interrupted observations as a result of meteorological conditions,such as clouds,precipitation,and aerosols.As a result,acquiring phenological information throughout each growth stage of the crop using airborne and spaceborne remote sensing is difficult (Nguy-Robertsonet al.2013).However,spectral reflectance devices installed near the ground surface can be used to continuously measure the reflectance in crops and estimate the vegetation index.In addition,the sensors used for ground-based monitoring of crops can identify seasonal changes in the vegetation index of the crops (Ryuet al.2010;Joet al.2015).For example,ground-installed sensors can detect rapid changes in the growth of crops during their reproductive stage (Leeet al.2015).
Most ground-installed spectral reflectance sensors are used to observe the normalized difference vegetation index (NDVI),one of the representative vegetation indices,and monitor the seasonal changes in vegetation growth(Kimet al.2019).Given that NDVI is associated with growth parameters such as plant height,leaf area index,and a fraction of the vegetation (Haboudaneet al.2004;Zhenget al.2018;Ryuet al.2020),the crop growth and developmental states can be represented by the seasonal changes of NDVI.However,the NDVI partially indicates the structure and green mass of vegetation,excluding the biochemical and physiological states,because it uses red and NIR reflectance by applying (NIR–Red)/(NIR+Red)(Tucker 1979;Gaoet al.2003).The red and NIR reflectance is suitable for distinguishing between live vegetation and soil (Zhanget al.2019).To monitor such a vital vegetation activity,additional vegetation indices based on other spectral reflectance wavelengths are also needed.The soil-adjusted vegetation index (SAVI) and enhanced vegetation index(EVI) were developed to reduce the soil and atmospheric influences (Huete 1988;Hueteet al.2002).These vegetation indices capture the structural characteristics of vegetation due to the NIR reflectivity in their calculations(Ryuet al.2020).
The photochemical reflectance index (PRI),which is calculated as:(Reflectance at 531 nm–Reflectance at 570 nm)/(Reflectance at 531 nm+Reflectance at 570 nm),indicates biochemical and physiological characteristics of vegetation.The reflectance at 531 nm decreases more than that at 570 nm as a response to light (Gamonet al.1992;Van Wittenbergheet al.2018),and can efficiently represent the ratio of CO2uptake to the amount of absorbed light energy,as well as various stress conditions because changes in the carotenoid pigments in foliage are sensitive to the 531 nm wavelength (Nakajiet al.2008).PRI is also known to reflect both diurnal and seasonal variations (Sims and Garmon 2002).The diurnal variation of PRI is a response to the intensity of light.The instant response of PRI to light is associated with the photosynthetic performance such as the actual photochemical efficiency,light use efficiency (LUE)(Castro and Sanchez-Azofeifa 2018),non-photochemical quenching (NPQ) (Alonsoet al.2017;Chouet al.2017),and xanthophyll cycle pigment epoxidation state (EPS) (Gamonet al.1992,2015;Wenget al.2006) for various vegetation species (Zhanget al.2016).
By contrast,a seasonal change in the PRI is related to changes in the pigment pool size (Sims and Gamon 2002;Gitelsonet al.2017).A phenological long-term PRI has a strong correlation with the chlorophyll-to-carotenoid ratio(Gamon and Berry 2012;Gamonet al.2015;Zhanget al.2016).The ratio of two such pigments is used to indicate the conditions during the vital activities of vegetation (Chouet al.2017).An increase in carotenoid relative to chlorophyll has been observed when vegetation is aging or under environmental stresses,or when the leaves have wilted(Pen Uelaset al.1995;Yanget al.2017).The reflectance at 531 nm is associated with carotenoid (Nakajiet al.2008;Gitelsonet al.2017).Chlorophyll decreases relative to carotenoid when the leaves are subjected to various stresses and thus,the PRI decreases owing to a relative increase in the reflectance at 570 nm.Thus,the seasonal change of PRI will be useful to detect the abnormal physiological conditions under the stress situations,e.g.,disease,salt,water,cold and heat stresses (Pen-Uelaset al.1995;Ryuet al.2020).Indeed,in a previous study,PRI was used to indicate the state of a disease throughout the season (Ohet al.2018).Due to these advantages,some spectral reflectance sensors to measure the PRI are often installed near the ground surface.
When the seasonal signal is extracted from the vegetation index data measured on a time-scale of minutes-to-hours,a smoothing method has been usually used.However,if the outlier data is not excluded before the smoothing,the estimated seasonal signal of vegetation index is influenced by the distorted values.Thus,the distorted data should be excluded for extracting the seasonal signal of a vegetation index.Indeed,although diurnal and seasonal PRI characteristics would be used differently depending on their purpose,PRI is difficult to interpret because its seasonal pattern is made up of the continuation of diurnal changes(Magneyet al.2016).Thus,the criteria for extracting the seasonal signal of a vegetation index should be set,for PRI in particular.
This study hypothesized that the seasonal signals of vegetation indices during the crop growth period are impacted by meteorological phenomena such as solar irradiance and precipitation.In particular,the minimum PRI value from the diurnal signal on a sunny day,indicating the activation of the photo-protection mechanism,should be investigated to evaluate the seasonal state of the crop.This study aims to extract the seasonal signals of the vegetation indices while considering the meteorological conditions.For this purpose,first,spectral reflectance sensors were installed near the ground surface to monitor the conditions of paddy rice,barley,and garlic crops.Second,the accuracy of the vegetation indices measured using spectral reflectance sensors was validated based on field spectrometer-retrieved vegetation indices.Next,the meteorological variables of insolation,cloudiness,sunshine duration,and precipitation were assessed for their usefulness in extracting the seasonal PRI and NDVI using the sensors.Finally,the extracted seasonal signals were identified through the moving average patterns based on a comparative analysis.
2.Materials and methods
2.1.Study area and crops
Three types of crops were grown in Gwangju (35°10´26´´N,126°53´56´´E) and Gosan (33°16´27´´N,126°10´55´´E) in the Republic of Korea (Fig.1).In Gwangju and Gosan,the mean air temperature and cumulative precipitation were 14.1 and 15.6°C,and 1 372 and 1 144 mm during a 30-year period(1988–2017),respectively (KMA,https://data.kma.go.kr/cmmn/main.do).The maximum air temperature occurs in August,and the minimum air temperature is in January or February.Precipitation occurs mostly during the summer.
Paddy rice plants were planted in June and harvested in October during a 2-year period.The cultivar of the paddy rice used in 2017 was Saenuri and that used in 2018 was Ilmi,and the planting population per area (planting distance)was approximately 18 plants m–2(15 cm×30 cm).The growth periods of paddy rice were June 15,2017 to October 17,2017 and June 1,2018 to September 27,2018 (Table 1).Based on the number of tillering and plant height from growth investigations,the reproductive phase of paddy rice began around July 20 in 2017 and July 2 in 2018.As the heading stage dates were August 24,2017 and August 12,2018,the ripening phase of paddy rice began after these dates.
The cultivation periods of barley and garlic extended from late autumn to the following spring.The cultivar of barley was Hinchal ssalbory and the seeding per area was 14 g m–2.The planting date was November 6,2017,and the barley was harvested on May 16,2018 (Table 1).Growth and development of barley were temporally stopped during the dormant stage due to the cold air temperature.After March 3,2018,barley regrew and the growth parameters such as plant height and vegetation index increased.The heading stage was April 16,2018.
The cultivar of garlic was Hongsan,and the planting density per area (planting distance) was approximately 63 plants m–2(11 cm×15 cm).The planting date was November 6,2017 and the differentiation stage of garlic began after the dormant stage that was finished about late February 2018(Table 1).The bulbing stage was checked as early April 2018.Finally,the garlic was harvested on June 4,2018.
2.2.Meteorological variables for data processing criteria
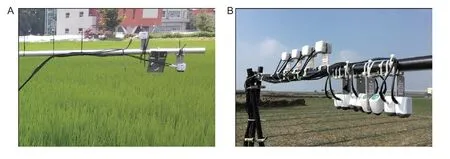
Fig.1 The spectral reflectance sensors were installed to monitor the conditions of paddy rice and barley in Gwangju (A) and garlic in Gosan (B).
The PRI and NDVI measurements may be affected by solar radiation conditions because the reflectance is calculated using the ratio between the solar irradiance and radiance.In particular,the PRI reacts sensitively based on the intensity and duration of light.Thus,the diurnal variation of the PRI has to be considered to obtain the seasonal PRI signal.In this study,the meteorological variables related to radiation,such as the insolation,cloudiness,sunshine duration,and precipitation,were evaluated to exclude the distorted PRI and NDVI values.They are the critical variables that can possibly influence the optical measurements directly or indirectly.The insolation represents the solar radiation directly,and the sunshine duration can also indicate the solar radiation condition using a ratio of sunshine time in given period.The cloudiness and precipitation represent the typically weaker conditions of solar radiation indirectly.In addition,water drops from precipitation should influence the accuracy of the sensor and the condition of the target surface.Thus,insolation,cloudiness,sunshine duration,and precipitation were selected to test for SRS data extracting.However,the impacts of atmospheric humidity and aerosols were ignored because the distance between the target and the optical instrument is under 1.8 m.
The hourly meteorological data measured from the Korea Meteorological Administration (KMA) were acquired(https://data.kma.go.kr/cmmn/main.do).The distance between the study area and the meteorological station was approximately 680 m in Gwangju,and approximately 2 800 m in Gosan.Next,insolation and cloudiness were calculated as the mean values from 11:00 to 14:00 at local time.To exclude the distorted values of PRISRSand NDVISRS,the insolation threshold was set to 300 W m–2for a 3-h period(11:00 and 14:00 at local time) because the reflectance of the target should be accurately measured under a higher solar irradiance and lower solar zenith angle (SZA) for the day (Rundquistet al.2014).The Cropscan radiometer(CROPSCAN Inc.,Rochester,MN,USA) has an insolation threshold of 300 W m–2for dealing with the measurement conditions by avoiding uncertainty under low solar irradiance(Van Leeuwenet al.2015).The range of cloudiness associated with the solar irradiance is from 0 to 10,which is a relative value.According to KMA,cloudiness is classified as clear (0–2),lightly cloudy (3–5),cloudy (6–8),and deeply cloudy (9–10) (Wonet al.2010).The high incoming radiation from bright and white clouds under a cloudy sky can cause a negative effect when measuring the reflectance (Rundquistet al.2014).In this study,the cloudiness threshold was set to 6 based on the cloudiness classification,excluding cloudy and deeply cloudy conditions.The sunshine duration under direct solar radiation above 0.12 kW m–2following the KMA definition was measured for 3 h between 11:00 and 14:00 at local time.In this study,the threshold of sunshine duration was evaluated under different conditions because this variable has not been widely considered in previous studies.Precipitation can directly influence an upwardlooking SRS and/or indirectly influence the measured value from a downward-looking SRS.Waterdrops on an upwardlooking SRS sensor and stagnant water on the surface distort the sensed crop conditions.Thus,precipitation that precedes an observation can also affect the results.When the cumulative precipitation from a local time of 0:00 to 14:00 is greater than zero,the data measured from the PRISRSand NDVISRSwere excluded in this study.
2.3.Ground optical measurements
The reflectance values for paddy rice,barley,and garlic were observed using spectral reflectance sensors (PRISRSand NDVISRS,METER group,Inc.,Pullman,USA) (Table 2).SRSs were used to measure the PRI and NDVI vegetation indices based on the reflectance from the crop canopies,and they consist of hemispherical upward-and downwardlooking (field stop) sensors.The PRISRS(NDVISRS) sensors have central wavelengths of 532 and 570 nm (650 and 810 nm),respectively (Table 3) (Eitelet al.2019).The four wavelengths have a full-width half-maximum bandwidth of 10 nm.The field of view (FOV) of the hemispherical upward-and downward-looking sensors are 180° and 36°,respectively.The PRISRSand NDVISRSsensors were installed at heights of approximately 1.5 and 1.8 m,respectively,above the ground for paddy rice/barley and garlic.The data measured from the SRSs were recorded using data loggers(EM50 and EM60,METER group,Inc.,Pullman,USA) every 1 or 2 min (Fig.2).
In previous studies,diode-based sensors were used to measure the red and NIR reflectance,and they captured the seasonal change of NDVI for the grass and paddy rice (Ryuet al.2010;Kimet al.2019).However,a white reference panel was required to track the diurnal signal of the PRI(Gamonet al.2015;Castro and Sanchez-Azofeifa 2018),which is the source of the seasonal signal of this index.Experiments on the ideal cosine response of a photodiode sensor such as an SRS are always conducted under direct light (Garrityet al.2010) and thus,the normalized response under different meteorological conditions can appear different.Thus,an Avantes AvaSpec-ULS2048L spectrometer (Avantes BV,Apeldoorn,Netherlands) was used to validate the data from the SRSs.The optical bench of the spectrometer was a symmetrical Czerny-Turner,with a 75-mm focal length,and the spectrometer has 2 048 CCD detectors.The wavelength range of the spectrometer is from 300 to 1 100 nm,and the spectrum sampling interval is approximately 0.576 nm at 700 nm.The FOV of the spectrometer is 23°,which is smaller than the 36° of an SRS field stop.The reflectance was calculated using the solar irradiance and radiance measured simultaneously with two spectrometers.One spectrometer estimated the solar irradiance from the sky hemisphere through the reflectance of a Lambertian white reflectance panel (RS50 White Reflectance Standard,StellarNet Inc.,Florida,USA)with >97% reflectivity,and the other spectrometer measured the radiance reflected from the target.In addition,the crosscalibration coefficient between the two spectrometers was considered when the reflectance is calculated.At each observation point (see Table 1),the solar irradiance and radiance were measured simultaneously 10 times,and this measurement cycle was repeated thrice.

Table 1 Cultivation and phenological information of the paddy rice,barley,and garlic
The measured value of reflectance is affected by the SZA and viewing zenith angle (VZA) (Jacksonet al.1990;Shikada and Miyakita 1992).In this study,to minimize the effect of SZA-and VZA-induced shadow area,the vegetation index values measured when SZA was the lowest during the day were used.In addition,the VZA of SRSs was set to nadir (Ransonet al.1985;Jacksonet al.1990).In Gwangju,the minimum values of diurnal SZA at solar noontime are distributed from 11.73° during the summer solstice to 58.61°during the winter solstice for a 1-year period,where the solar noontime was from 12:16 to 12:47.The response of the spectral irradiance sensor changes depending on the incident angle (Mekaoui and Zibordi 2013).Further,solar irradiance measurement is unreliable as SZA increases,which is particularly unacceptable at an SZA higher than 60°to 70° (Garrityet al.2010;Niet al.2018).Thus,an optical measurement is conventionally applied in the vicinity of solar noontime between 12:00 to 13:00 on clear sunny days.This minimizes the effect of the SZA during the solar noontime.In this study,the daily values of the PRISRSand NDVISRSsensors were estimated as the mean values using data measured for solar noontime±1.5 h (Fig.3).In addition,another daily mean of PRISRSand NDVISRS,measured between 11:00 and 14:00 at local time,was estimated.Data from the PRISRSand NDVISRSsensors,calculated using two methods based on the criteria of the SZA and the local time,showed a high correlation that was close to 1.0 (Fig.4).The root mean square errors (RMSEs) of the PRISRSand NDVISRSsensors were 0.0017 and 0.0022,respectively.Indeed,the time difference between solar noontime±1.5 h and the local time of 11:00 to 14:00 was insignificant.The maximum difference in time between the criteria of the SZA and the local time was 10 min during the growth period of paddy rice and 17 min for the growth durations of barley and garlic.Although the PRI can decrease quickly within 5 min after responding to strong solar irradiation (Van Wittenbergheet al.2018),such a change was not critically large as a physiological reaction(Gamon and Berry 2012;Van Wittenbergheet al.2018).This means that the use of the local time,which is an easier method than considering the SZA,can be accepted for field SRS measurements.

Table 2 Optical observation information on the paddy rice,barley,and garlic

Table 3 Sensor specifications of spectral reflectance sensor (SRS) and spectrometer
In Gwangju,the PRISRSand NDVISRSdata related to paddy rice were obtained from nine observation points in 2017 (Jun.21 to Oct.15) and 2018 (Jun.1 to Sep.26),and the data related to barley were observed from two points (Nov.11,2017 to May 15,2018).In Gosan,the PRISRSand NDVISRSdata on garlic were observed after the winter (Feb.27,2018 to May 14,2018).
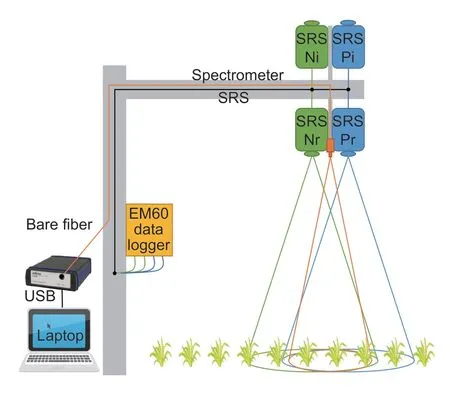
Fig.2 Illustration of measurement area depending on field of view (FOV).The spectral reflectance sensor (SRS) was connected to an EM60 data logger,and the FOV of the downward-looking SRS was 36°.A spectrometer was used to verify the SRS data,and the FOV of the spectrometer was 23°.
3.Results
3.1.Verification of PRISRS and NDVISRS using spectrometer data
The PRISRSand NDVISRSdata were verified using spectrometer measurements on the three crops (Fig.5).In addition,the least significant difference (LSD) analysis(P-value<0.05) was conducted to assess the influence of the SZA on the differences in the PRI and NDVI from the two instruments (Fig.6).The data were separated at 10-degree intervals of SZA.The coefficient of determination(hereafter,R2) between the PRISRSand PRISpectrometerwas 0.817 (P-value<0.01).The RMSE of the two PRIs was 0.083 (Fig.5-A),and reached 0.023 after bias correction using the equation ofY=0.966X–0.079 (Fig.5-C).Normalized RMSE (NRMSE),which was calculated as RMSE/(Ymaximum–Yminimum)×100,between bias-corrected PRISRSand PRISpectrometerwas 12.6%.A significant difference between PRISRSand PRISpectrometeroccurred in the ranges of 10<SZA≤20 and 50<SZA≤60,whereas the other ranges did not show a significant difference underP-value<0.05(Fig.6-A).These results meant that PRISRSas measured gave a reasonable performance in this study although the impact of SZA existed in the range of 50<SZA≤60.
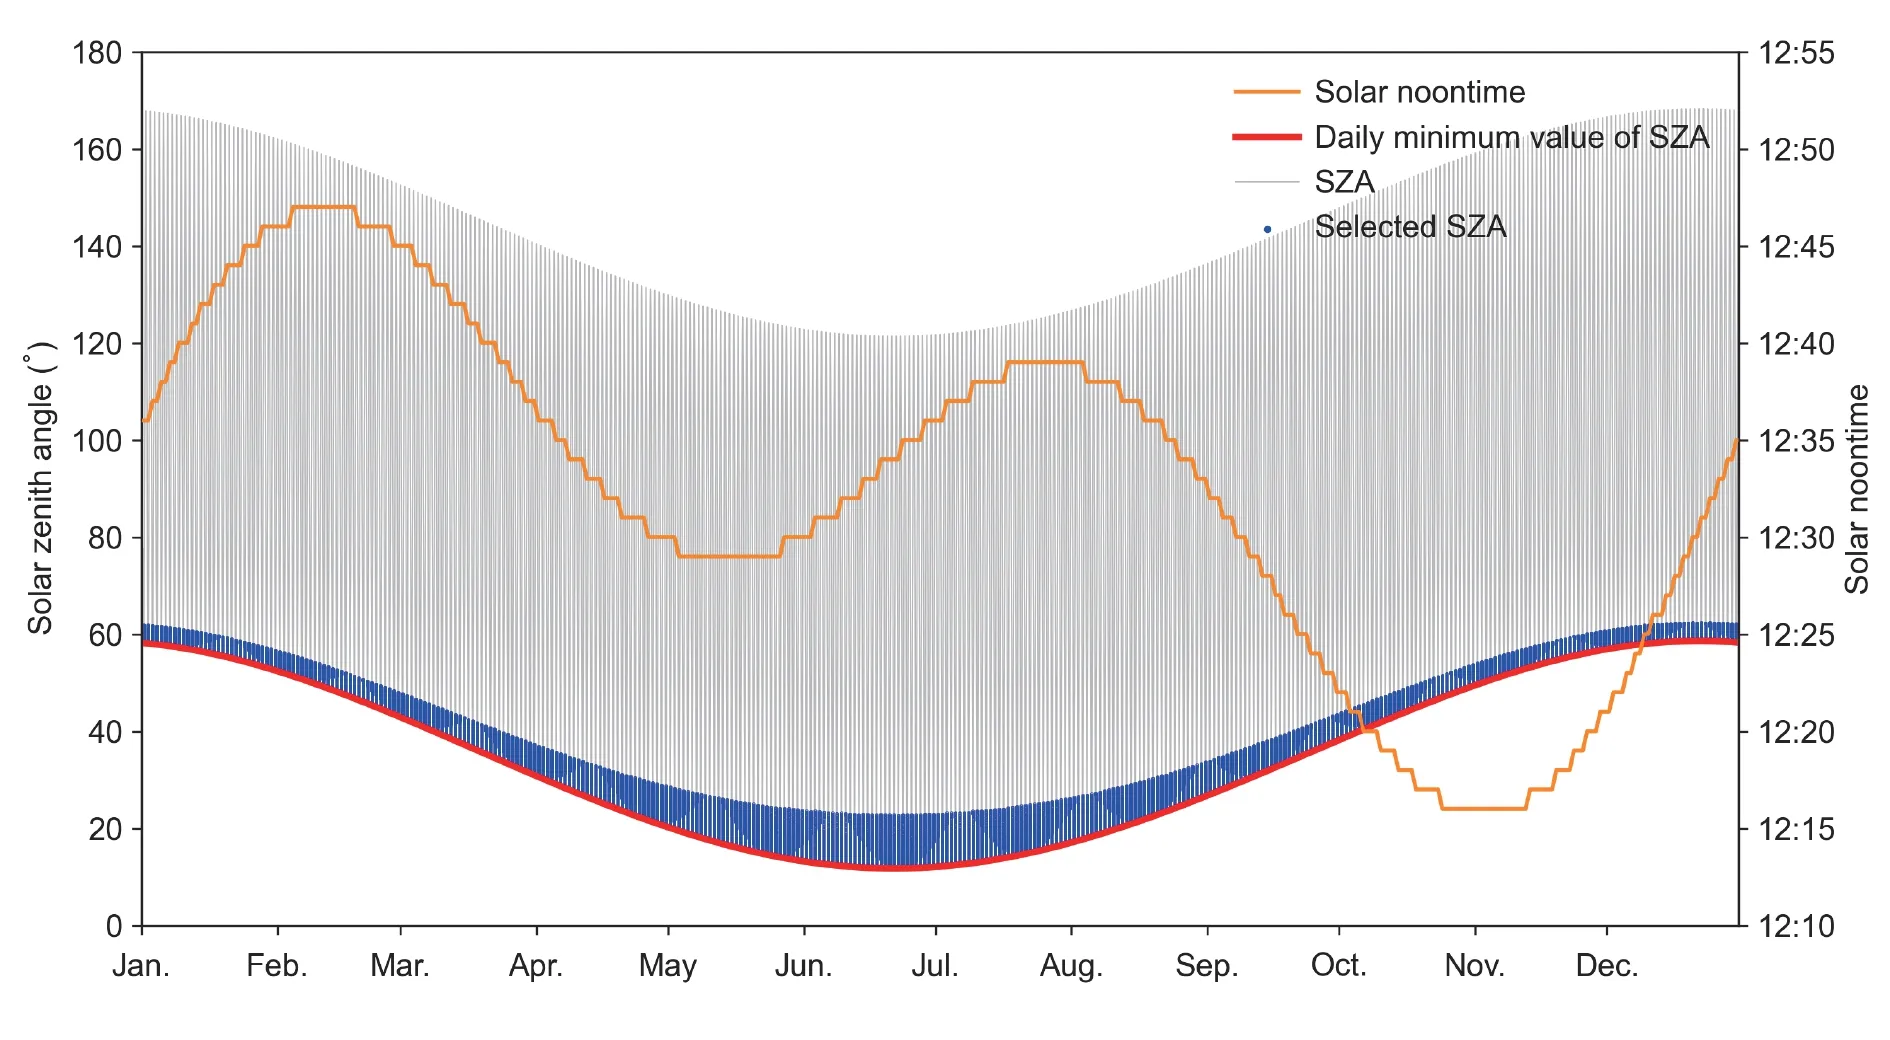
Fig.3 Diurnal and daily changes of solar zenith angle (SZA) in Gwangju located in the Republic of Korea in 2017.
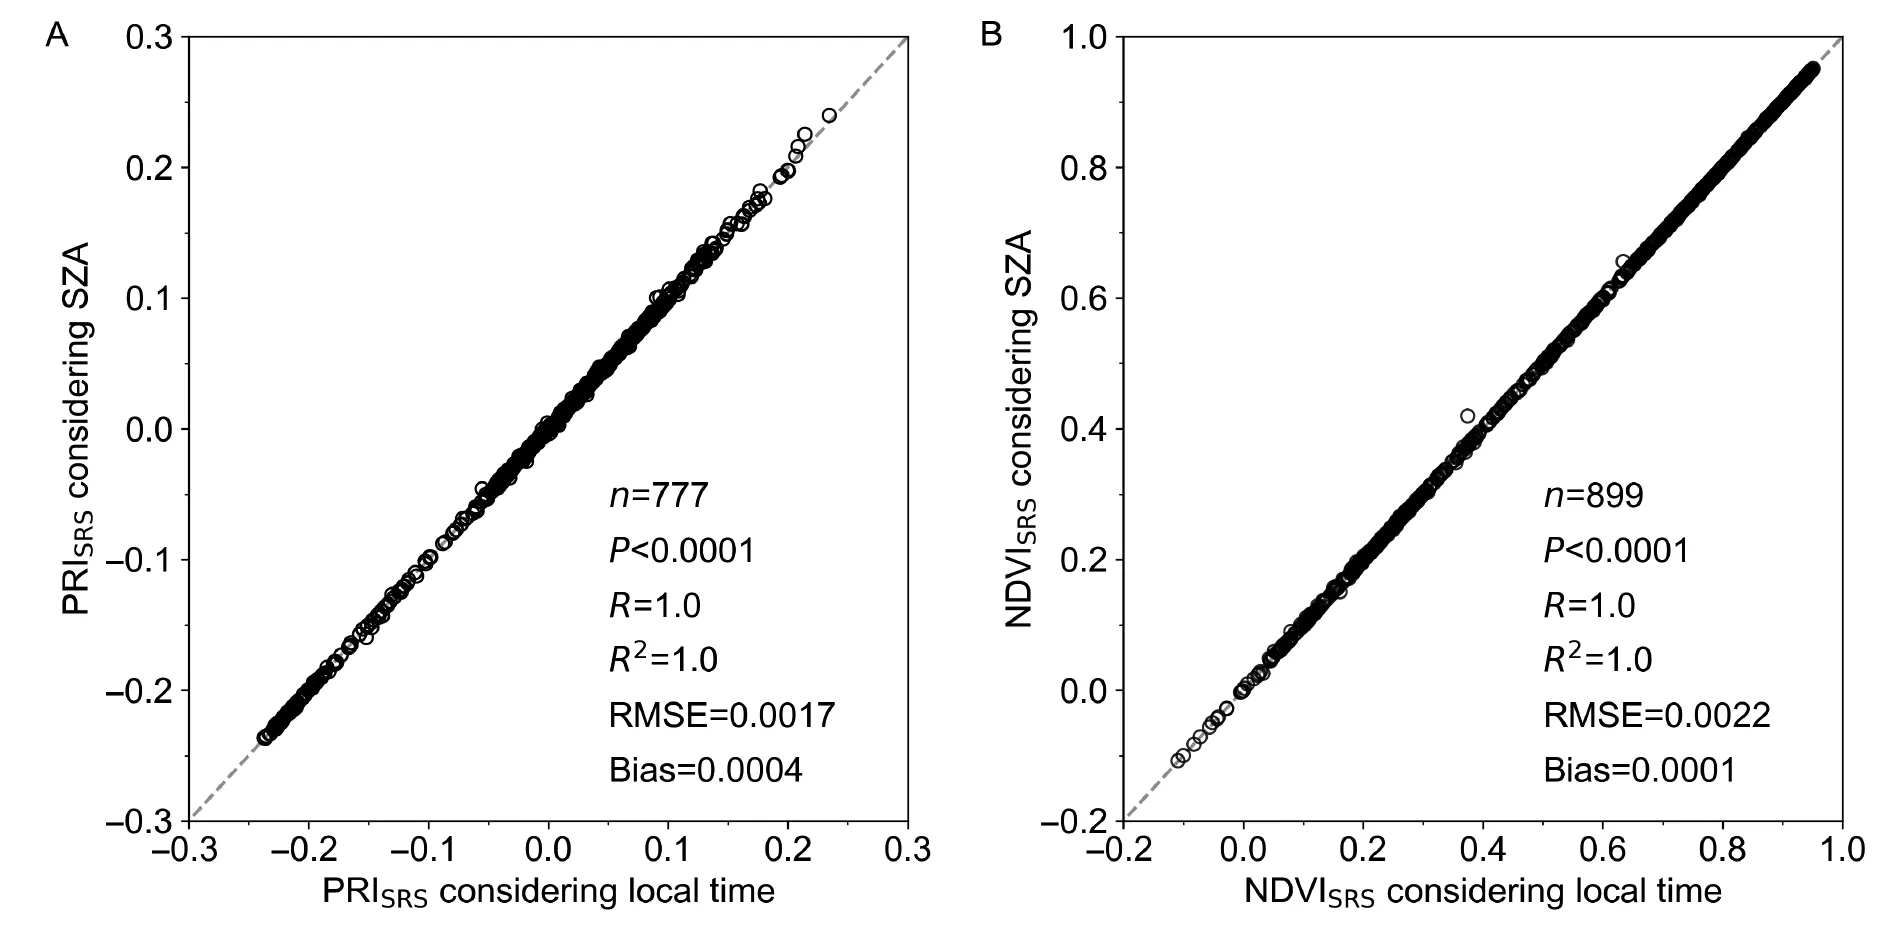
Fig.4 Relationship between vegetation indices from spectral reflectance sensor (SRS) considering the local time and the solar zenith angle (SZA).A,photochemical reflectance index (PRI).B,normalized difference vegetation index (NDVI).
There was a highR2value of 0.962 (P-value<0.01)between NDVISRSand NDVISpectrometer(Fig.5-B).The RMSE of the NDVIs measured by the two instruments was 0.104,which decreased to 0.054 when bias correction was conducted using the equation ofY=0.983X+0.099 (Fig.5-D).NRMSE between bias-corrected NDVISRSand NDVISpectrometerwas 5.63%.The absolute value of the bias in the NDVIs was similar to that in the PRIs,although the sign of the bias between the PRI and NDVI was different.According to the LSD analysis,the differences in the NDVISRSand NDVISpectrometerdepending on the SZA do not have a statistical significance (Fig.6-B).These results indicated that the main factor for the difference in NDVI measured by the two optical devices was not SZA.
3.2.Criteria for excluding distorted PRISRS and NDVISRS data
Meteorological variables were evaluated to exclude the distorted PRISRSand NDVISRSdata and extract the seasonal pattern of vegetation indices for paddy rice during 2018.Insolation,cloudiness,sunshine duration,and precipitation were used as variables to consider the effect of meteorological conditions on the optical measurement time.First,the PRISRSvalues below the 300 W m–2threshold of insolation were also excluded.However,although some PRISRSvalues were excluded based on the insolation threshold when only the insolation was used,other distorted PRISRSvalues such as those during a rainy period were not excluded (Fig.7-A).The distortion of the PRISRSdata against the ideal seasonal pattern increased during the rainy period owing to the effect of low irradiation and the measurement error from rainwater (Table 4).When the threshold value of insolation was increased from 300 to 600 W m–2,the distorted PRISRSdata were clearly excluded (Appendix A).However,the threshold value of insolation cannot be set consistently because the maximum insolation for a particular day is variable depending on the season.Excessive data may be excluded when the standard of insolation for summer to winter crops was applied as a way to exclude the distorted PRISRSdata.
Second,cloudiness was also evaluated to identify the acceptable measured data.Such types of data under the effect of clouds were excluded.The PRISRSvalues were not used when the cloudiness was greater than 6 (Fig.7-B).When the threshold value of cloudiness was lowered,the measurement data were excluded (Appendix B).The method for PRISRSextraction using cloudiness has an advantage in that a constant threshold value is set.However,obtaining a continuous value for cloudiness is difficult in the specific study area (Table 4) because current observations of cloudiness by the naked eye or satellite data with a high spatial resolution are unsuitable.
Third,the initial threshold of sunshine duration was set to 1.8 h (60%) during a 3.0-h (11:00 to 13:00 at local time) period with reference to the standard for cloudiness(threshold value of 6 (60%)).Using the threshold of sunshine duration,the critical distorted values of the PRISRSdata were effectively excluded (Fig.7-C),and this variable has the advantage that it can use a constant threshold value throughout the year in the same area because the sunshine duration is a variable expressed through normalization from zero to one for a 1-h period.In addition,this variable is generally measured using a KMA automated synoptic observing system (ASOS).
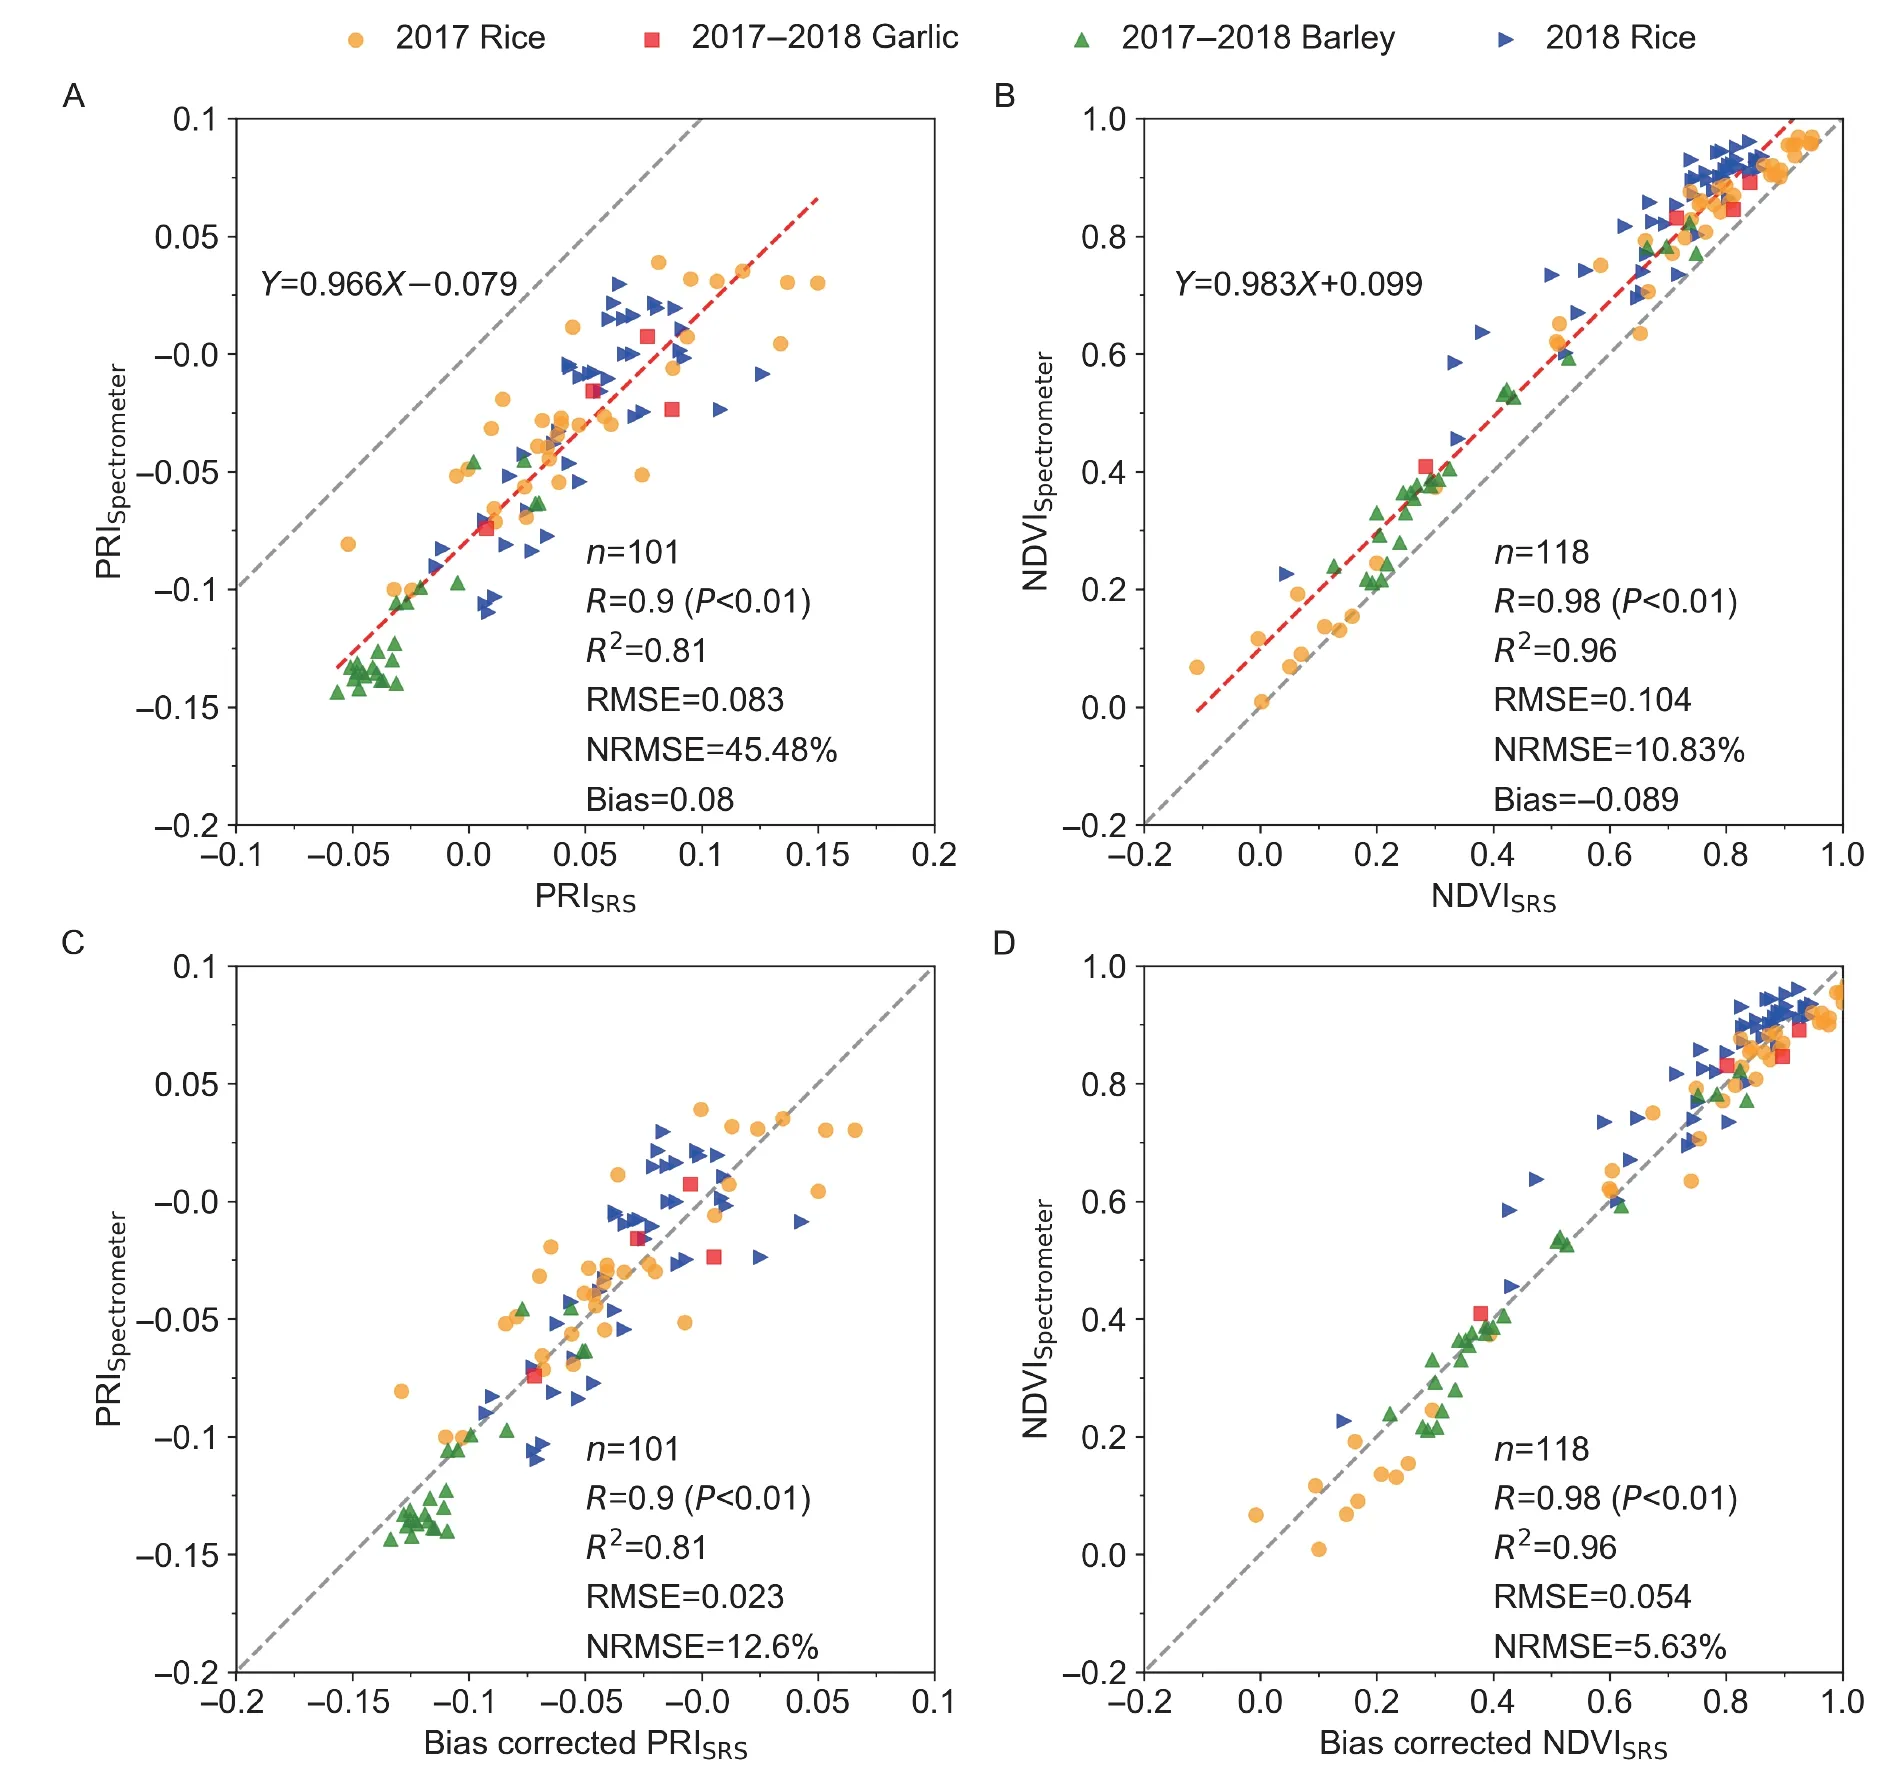
Fig.5 Relationship between spectral reflectance sensor (SRS)-based and spectrometer-based vegetation indices.The dashed gray (red) line represents the 1:1 line (trend line).A,photochemical reflectance index (PRI).B,normalized difference vegetation index (NDVI).C,bias corrected PRI.D,bias corrected NDVI.
Fourth,the cumulative precipitation from 0:00 to 14:00 at local time was used to process the PRISRSdata.When the precipitation exceeded 0 mm,the values of the PRISRSdata were considered as distorted (Fig.7-D).This variable can have a constant threshold value,and continual observation is possible using a rain gauge.However,although there are some advantages to this,it cannot exclude distorted values that occur on a cloudy day.The strengths and weaknesses of the four meteorological variables are summarized in Table 4.
To evaluate the meteorological variables,which were used as the threshold for selecting the acceptable SRS data,the relationship between the non-processed SRS vegetation indices and the temporally smoothed SRS vegetation indices was assessed for paddy rice cultivated in 2018.The smoothing was applied as a moving average of ±4 days to analyze the behavior of the vegetation indices at each phenological stage of the crops.The case using sunshine duration as the threshold had the best statistical result for PRISRS.The correlation coefficient,R2,RMSE,and bias between the processed and smoothed data were 0.970,0.941,0.008,and 0.000 (Table 5),respectively.According to this statistical performance,the sunshine duration will be a valuable meteorological variable to exclude the distorted data based on the seasonal pattern of the vegetation indices.
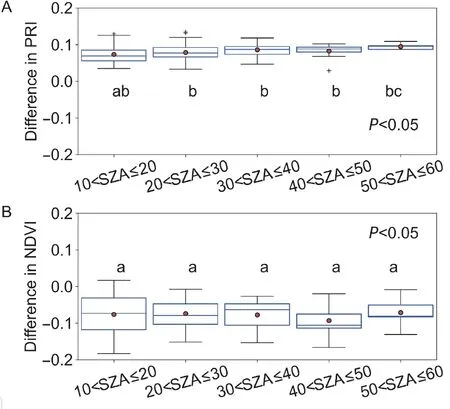
Fig.6 Box plots on the differences in spectral reflectance sensor (SRS)-based and spectrometer vegetation indices depending on the solar zenith angle (SZA) (significance level:0.05).A,photochemical reflectance index (PRI).B,normalized difference vegetation index (NDVI).+indicates the outliers.
The NDVISRSdata were less influenced by the meteorological threshold criterion than the PRISRSdata.In an open canopy,low radiation and/or precipitation clearly affected the measurement of the NDVISRS.However,in a closed canopy,the seasonal signal of the measured NDVISRSdid not change significantly through the processing with any meteorological variables.Indeed,in the statistical results involving the relationship between NDVISRSand the smoothed NDVISRS,the correlation coefficient,R2,RMSE,and bias were not significantly different among the four meteorological variables.
3.3.Processing PRISRS and NDVISRS based on sunshine duration
The sunshine duration was adopted as the threshold variable for processing the PRISRSand NDVISRSdata through three steps.First,the data measured between +1.5 and–1.5 h at solar noontime or between 11:00 and 14:00 at local time were selected.Next,the top and bottom 15% of values of the SRS data were excluded to minimize any measurement errors.Third,the PRISRSand NDVISRSdata were filtered using the threshold of the sunshine duration.In this study,using these three steps,the time series of the two vegetation indices were represented as seasonal values.
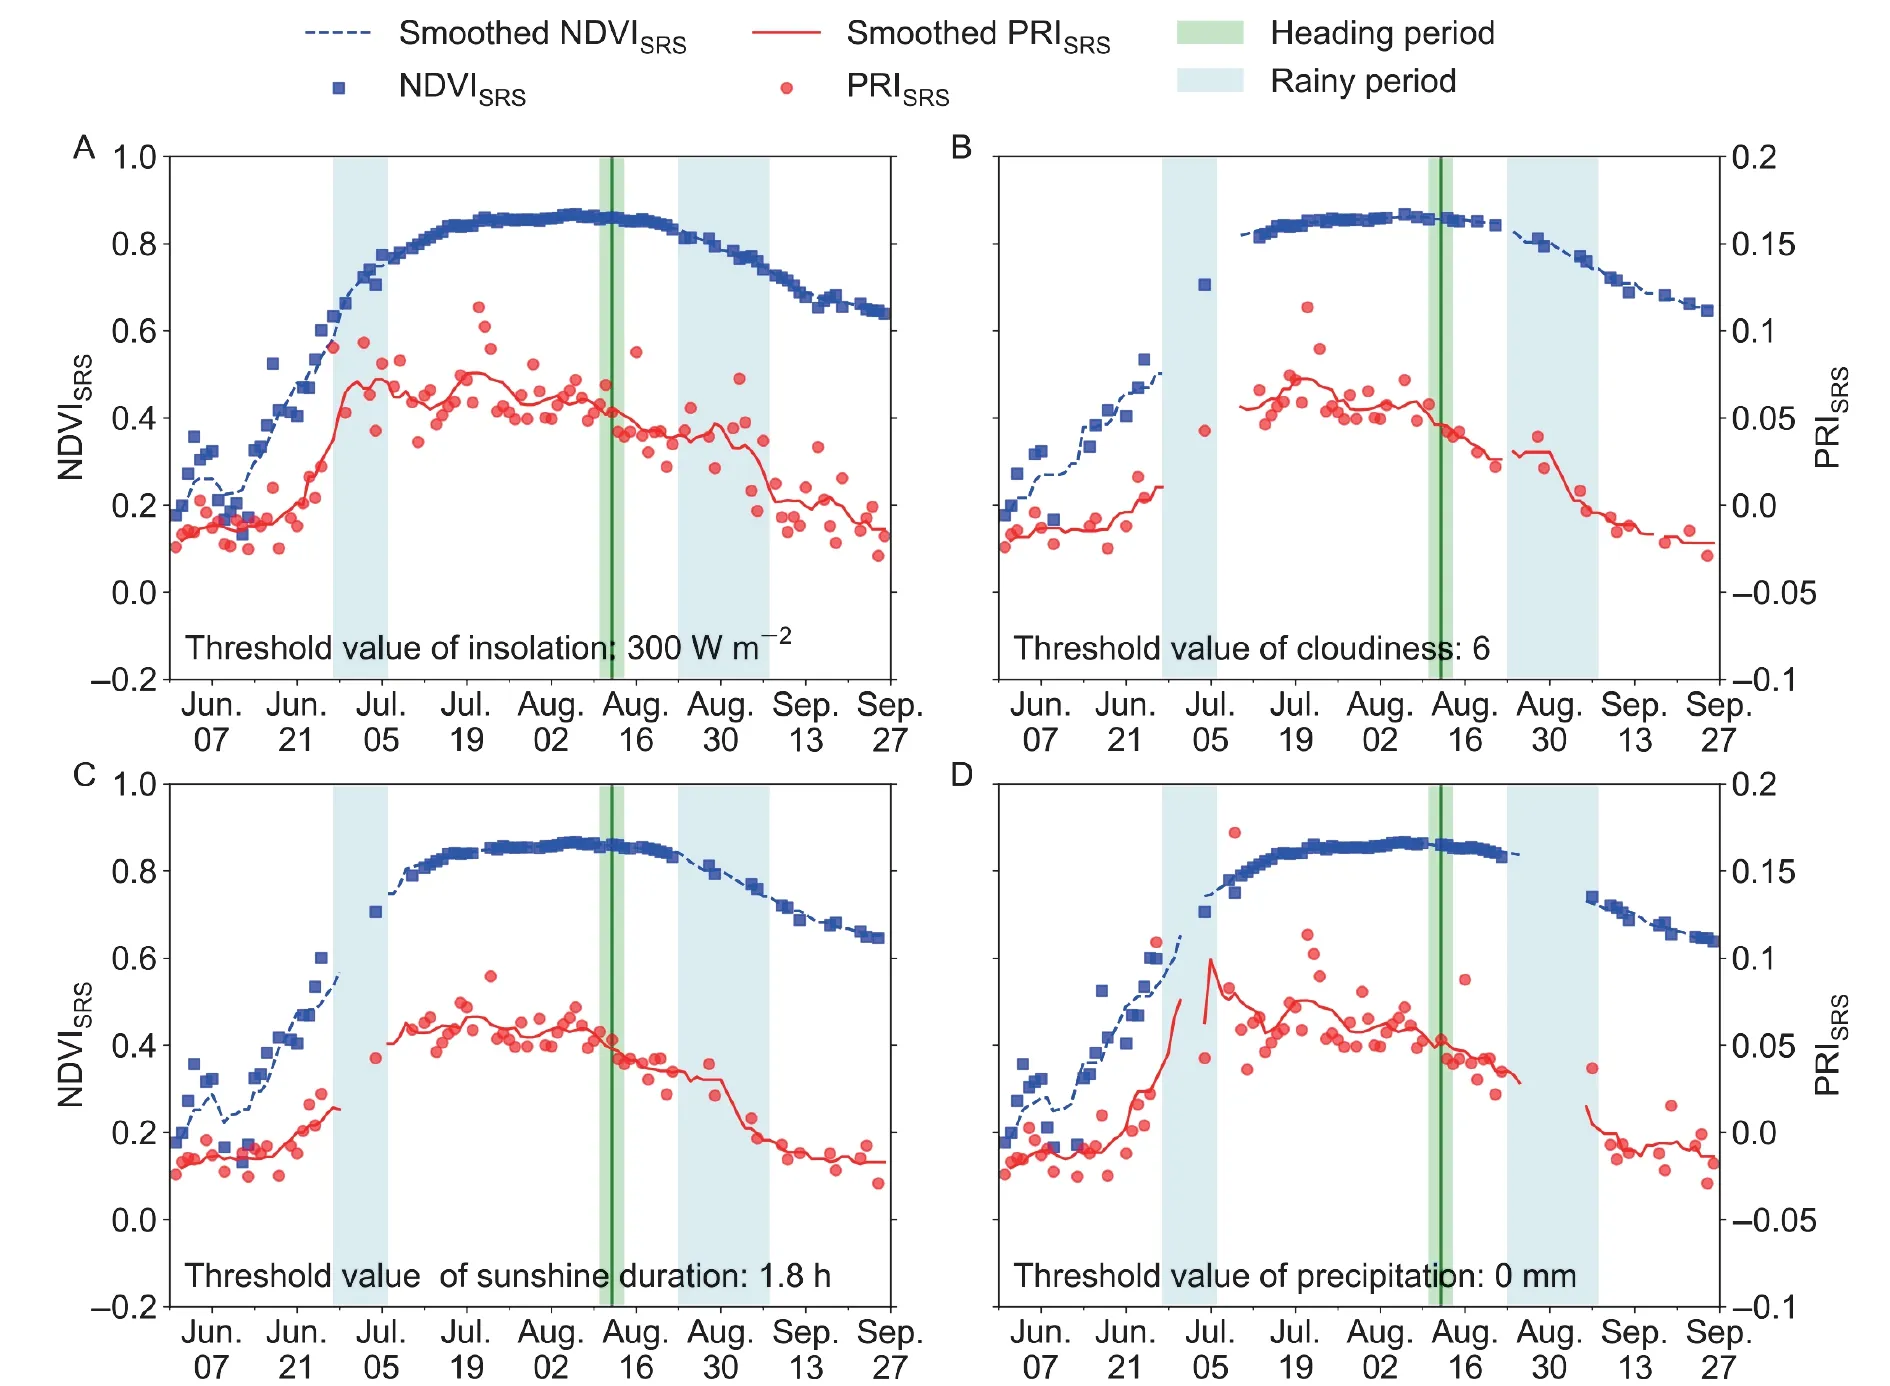
Fig.7 Time series of PRISRS and NDVISRS data processed using insolation (A),cloudiness (B),sunshine duration (C),and precipitation(D).NDVI,normalized difference vegetation index;PRI,photochemical reflectance index;SRS,spectral reflectance sensor.
The effect of the threshold values (every 0.3 h from 0 to 3.0 h) of sunshine duration on the seasonal patterns was evaluated with respect to paddy rice for 2018 (Fig.8).When the threshold was not applied,the PRISRSand NDVISRSdata had distorted values,particularly during the rainy periods(Fig.8-A).When the threshold of the sunshine duration,which is 0.3 h (10%),was applied,the distorted values of the NDVISRSdata during two rainy periods were mostly excluded(Fig.8-B).In addition,the number of remaining distorted values of the PRISRSdata was decreased more than in the non-processed case.As the threshold value of the sunshine duration was increased,the values of the distorted PRISRSand NDVISRSwere excluded more gradually.Given that the radiation affected the crop consistently for approximately 3.0 h (100%),Fig.8-K indicates that the time series on the PRISRSdata theoretically reached the minimum values of the PRI for a 1-day period.
In this study,the threshold of the sunshine duration used to represent the seasonal PRISRSpattern with the distorted values excluded was set to 1.8 h (60%) during a 3.0-h period (11:00 to 13:00 at local time) (hereafter,SD1.8 h in PRISRS).The processed and smoothed PRISRSdata showed a high correlation coefficient (0.990) and low RMSE (0.005)compared to the results of the 3.0 h threshold (100%) in this study area.Given that the phenological and physiological characteristics of NDVI are not sensitive to the light intensity or exposure time,the sunshine duration threshold for the NDVISRSdata,which was set to 0.3 h (10%) during a 3.0-h(100%) period (11:00 to 13:00 at local time) (hereafter,SD0.3hin NDVISRS),and is lower than the threshold of the PRISRSdata,was used to effectively extract the seasonal pattern of NDVI.
The PRISRSand NDVISRSdata were processed for the three crops,paddy rice,barley,and garlic,based on the SD1.8hthreshold in the PRISRSdata and the SD0.3hthreshold in the NDVISRSdata.Fig.9 shows the time series of the PRISRSand NDVISRSdata before and after processing.For 2017,the smoothed pattern of the non-processed PRISRSdecreases slowly before the heading period in the paddy rice,even under stress-free environments,but the smoothed pattern of the processed PRISRSshows a sharp decrease during the heading stage (Fig.9-A and B).In addition,the PRISRSdata observed for paddy rice in 2018 have some distorted values,particularly during the rainy period (Fig.9-C and D).The PRISRSdata during the rainy period from Aug.23 to Sep.7,2018 show an opposite trend against the decreasing PRI after the heading stage.However,when the sunshine duration threshold criterion of Fig.9-B was also applied to the paddy rice data of 2018 (Fig.9-D),a decreasing trend was continuously maintained after the heading stage.
The relationship between the observed PRISRSdata and the smoothed PRISRSdata with and without processing were analyzed depending on the crop type.The results of nine observation points on paddy rice for the 2-year period were investigated to express the noticeable seasonal signals of the PRISRSdata (Fig.10).Before processing,theR2value between the observed PRISRSand smoothed PRISRSdata was 0.884,but this improved to 0.949 after the SD1.8hthreshold process.In addition,the RMSE decreased from 0.017 to 0.009.Unlike the PRISRSdata,the observed NDVISRSand smoothed NDVISRSdata without the SD1.8hprocess had a highR2value,which was close to the post-processing value(Fig.10-B).In the case of the NDVI,theR2and the RMSE between the observed NDVISRSand smoothed NDVISRSdata were 0.988 and 0.028 without the SD1.8hprocessing,and changed to 0.986 and 0.029 with the processing.
In the case of barley,between 2017 and 2018,distorted values of the PRISRSdata appeared owing to the precipitation and low radiation,and they were excluded effectively using the SD1.8hthreshold (Fig.9-C and D).Statistical approaches regarding the relationship between the observed PRISRSand smoothed PRISRSdata indicate that the seasonal PRI signal becomes more noticeable (Fig.10-A) just as in the case of paddy rice.TheR2value between the PRISRSand smoothed PRISRSdata increased from 0.787 to 0.895,and the RMSE decreased from 0.017 to 0.008.These results indicate that the sunshine duration effectively excluded the distorted values measured by the SRS sensors.In contrast,the NDVISRSdata were statistically changed through the SD0.3hthreshold process (Fig.10-D).TheR2and RMSE of the NDVISRSdata without and with the processing for barley were 0.980 and 0.022,and 0.978 and 0.024,respectively.

Table 5 Statistical results of the relationship between spectral reflectance sensor (SRS)-based vegetation indices and SRS-based smoothed vegetation indices for paddy rice after processing using each meteorological variable
These effects of the SD1.8hdata for the PRI and SD0.3hfor the NDVI threshold processes in rice and barley also appeared in garlic (Fig.9-E and F).The correlation between the non-processed and smoothed PRISRSdata was higher than that between the processed and smoothed PRISRSdata owing to the removal of the distorted values corresponding to rainy and low-radiation days.After processing,the correlation between the observed PRISRSand smoothed SRS data for the PRI showed improved statistical values,in which theR2increased from 0.599 to 0.897 and the RMSE decreased from 0.024 to 0.006 (Fig.10-E).In the NDVISRSdata for garlic,the effect of the process was also low,and similar to the effects for rice and barely (Fig.10-F).
4.Discussion
4.1.Difference between SRS-based and spectrometerbased vegetation indices
SRS-based vegetation indices were evaluated using spectrometer-based vegetation indices.The PRISRSand NDVISRSdata showed significant correlations with the PRISpectrometerand NDVISpectrometerdata,but with some bias.Five reasons can be attributed to this.First,the sensor specification can cause differences in the NDVI and PRI values (Langeet al.2017).In particular,the FOV of the sensor and the distance between target and sensor affects the reflectance values (Balzaroloet al.2011;Zhaoet al.2015),and the mean deviation of red and NIR bands was lower under wide FOV of the sensor (Zhaoet al.2015).The FOV of the SRS was 36°,whereas that of the field spectrometer was 23°.The different FOVs of the optical devices create a difference in their measurements of the footprint area.The footprint of the spectrometer was narrow,although the observation was conducted at a similar height (Fig.2).The footprint of the SRS is approximately 1.6-times wider than that of the spectrometer.If the optical measurement is conducted at a height of 100 cm,the diameter of the footprint is approximately 65 cm for the SRS and 41 cm for the spectrometer.Therefore,in this study,the NDVISpectrometervalue was higher than the NDVISRSvalue because the FOV of the NDVISRSsensor included a noncrop covered space as well,owing to the planting distance that was used.
The second is the problem of sensor calibration.The dual optical devices of upward-looking and downwardlooking sensors were used to measure the irradiance and radiance for both SRSs and spectrometer.Given that the performances of SRSs do not coincide perfectly,the crosscalibration coefficient using the ratio with a 99% reflective white panel improved the accuracy of the reflectance values calculated from the down-welling irradiance and upwelling radiance (Gamonet al.2006,2015).In the literature,the midday PRISRSand NDVISRScorrected using cross-calibration agreed well with spectrometer-based vegetation indices for a pine stand (Gamonet al.2015).However,it is challenging to apply the cross-calibration coefficient throughout the growth period of the crop because the white panel cannot be installed outside due to the contamination caused by dust and precipitation.In this study,the cross-calibration coefficient using the white panel was applied when the spectrometer-based vegetation indices were calculated,while it was not used on the SRS-based vegetation indices.Thus,the characteristics of the uncorrected SRS-based vegetation indices could be represented as the bias.The uncorrected PRISRSvalue was overestimated compared to the PRISpectrometervalue,which is consistent with previous studies (Gamonet al.2015;Castro and Sanchez-Azofeifa 2018).

Fig.8 Time series of PRISRS and NDVISRS data processed depending on the threshold of sunshine duration for paddy rice in 2018.A,non-processed data.B–K,thresholds of 0.3 h (B),0.6 h (C),0.9 h (D),1.2 h (E),1.5 h (F),1.8 h (G),2.1 h (H),2.4 h (I),2.7 h(J),and 3.0 h (K),respectively.NDVI,normalized difference vegetation index;PRI,photochemical reflectance index;SRS,spectral reflectance sensor.
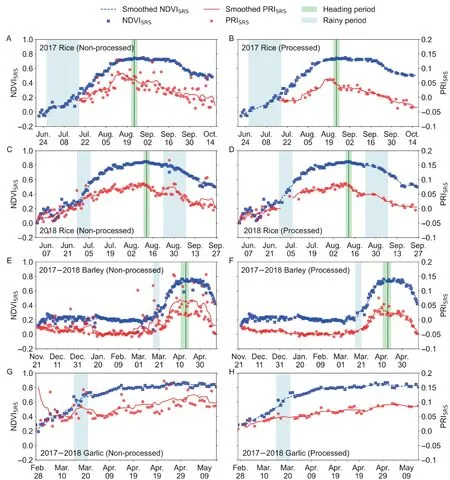
Fig.9 Time series of daily PRISRS and NDVISRS before and after processing using sunshine duration for paddy rice,barley,and garlic.A,C,E and G,time-series of non-processed daily PRISRS and NDVISRS,respectively.B,D,F and H,time-series of processed daily PRISRS and NDVISRS,respectively.NDVI,normalized difference vegetation index;PRI,photochemical reflectance index;SRS,spectral reflectance sensor.
The third is the spectral resolution of the sensors.It was reported that the PRI value measured using a reflectivity sensor of relatively broad bandwidth (>10 nm) is higher than that using a narrow-band spectrometer (1 nm) in cropland(Gamonet al.2015;Castro and Sanchez-Azofeifa 2018;Ryuet al.2018).The recalculated PRISpectrometervalues(broad band) based on 10 nm bandwidth at 532 and 570 nm were increased under the open canopy but decreased under the closed canopy compared with PRISpectrometervalues (narrow band).Therefore,the slope of the relationship between the two optical devices should be varied depending on the bandwidth of the PRI.However,it was not more significant than the effects of different sensor FOVs and sensor calibration on the difference of PRIs between the two optical devices.
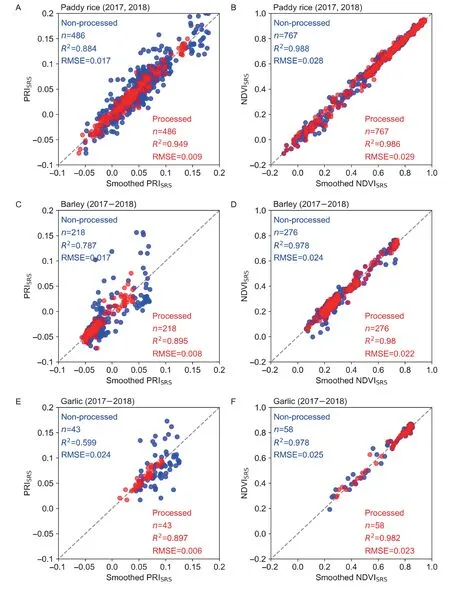
Fig.10 Relationship between SRS-based vegetation indices and smoothed SRS-based vegetation indices.A and B,vegetation indices for paddy rice at nine stations in 2017 and 2018.C and D,PRISRS and NDVISRS for barley at two stations in 2017–2018.E and F,vegetation indices for garlic at one station in 2017–2018.NDVI,normalized difference vegetation index;PRI,photochemical reflectance index;SRS,spectral reflectance sensor.
The fourth reason for the measurement error was the difference in the optical measurement time.According to Battudeet al.(2016),NDVIs measured by satellites had a high correlation with each other when the measurement intervals were small.In this study,the mean value of the PRISRSwas from 11:00 to 14:00 based on local time.By contrast,the mean value of the PRISpectrometerwas from 11:00 to 14:00.Although SRS and spectrometer measurements were conducted near the solar noontime,the shadow areas caused by SZA and VZA can be different depending on the weather conditions.When the fraction of shaded leaves increases for measuring the footprint,the PRI value of the vegetation increases (Ryuet al.2017).Indeed,the PRI is highly affected by the light intensity and exposure time to light (Van Wittenbergheet al.2018).Therefore,the relative error in the PRI was larger than that in the NDVI after bias correction.The NRMSE of the PRI was approximately 12.6%,and that of the NDVI was approximately 5.63%.
The fifth reason is the difference between the applied methods of measurement.The accuracy of the ground optical measurement depended largely on the installation of the sensor (Balzaroloet al.2011).The SRS was mounted on a small tower,whereas the spectrometer was a hand-held optical instrument (Fig.2).The reflectance measured by the spectrometer could be influenced by external humaninduced factors.
4.2.Seasonal signals of vegetation indices
Different meteorological variables were tested to determine the acceptable threshold for eliminating distorted measurement values from the seasonal trend after evaluating the accuracy of the SRS with a spectrometer.Seasonal PRI and NDVI signals were extracted when considering the threshold value of sunshine duration.The seasonal NDVI signal was stably observed even without data processing.Given that the NDVI is associated with the number and structure of the leaves (Van Leeuwenet al.2015;Moslehet al.2015),it did not change significantly during the day,particularly under a closed canopy.The NDVI measurements were scattered against the seasonal trend only during the rainy periods.By contrast,the diurnal and seasonal PRI signals were affected not only by the rainy periods but also by the intensity and exposure time of light.This is consistent with previous studies (Gamon and Berry 2012;Zhuet al.2019).Insolation,cloudiness,sunshine duration,and precipitation were associated with the light both directly and indirectly.Among these,the sunshine duration was the most useful for extracting the seasonal signal of the vegetation indices,particularly for the PRI.The PRI appeared to show a relatively high value under insufficient light exposure owing to the insensitive activation of the physiological photo-protection mechanism (Zhuet al.2019).In addition,surface reflectance can increase,owing to the light scatter under cloudy conditions (Rundquistet al.2014).Thus,the PRI on a cloudy day did not represent the seasonal signal because it has a relatively high value compared to the PRI on a sunny day.Cloudiness excluded the distorted value of PRI on a cloudy day,but it is more important to ascertain whether the clouds obscure the sun.
The measured leaf-scale PRI values under exposure to strong light showed a decreasing tendency and were saturated within approximately 10 min due to the activation of the photo-protection mechanism (Gamonet al.2015;Van Wittenbergheet al.2018).However,in our field measurements,the canopy-scale PRI at noon did not decrease to the ideal minimum value,similar to the laboratory test on a single leaf,during a single day (Ryuet al.2018).The light penetration into the crop canopy was dependent on the SZA and thus,the PRI values of the upper and lower leaves can respond differently (Zhanget al.2017;Zhouet al.2017).Further,the minimum diurnal value of the PRI appeared at different times depending on the leaf angle,even for the same leaf height inside the canopy and the same meteorological environment (Ryuet al.2018).In other words,the photo-protection mechanism of the leaf at a particular time was differentially activated depending on the direction of the leaf surface due to the difference in the absorbed light energy.Besides,the PRI in the canopy scale was also affected by the shadow effect of neighboring crops.For example,the PRI for a forest is higher than that for cropland because the shadow intensity for a deeper canopy depth is more significant(Ryuet al.2017).Thus,representative seasonal trends of the canopy-scaled PRI required exposure to sunlight for a longer duration than the leaf-scaled PRI at solar noontime to minimize the shadow effect of canopy structure.Therefore,standardizing the degree of exposure to sunlight during each growth stage should be considered essential.In this sense,the sunshine duration was a more useful variable than insolation or cloudiness.
5.Conclusion
The seasonal signals in PRISRSand NDVISRSdata were extracted by testing the threshold criteria of several meteorological variables.The threshold of sunshine duration was the best for excluding the distorted values in the PRISRSand NDVISRSdata as compared with the other meteorological variables,and the processed seasonal PRI and NDVI signals distinguished each growth phase of the crops.These results will be helpful for processing data before analyzing the seasonal pattern of vegetation index measured continuously from an optical sensor fixed on the near-surface ground.The extracted seasonal signal of the vegetation index can be used:1) to monitor crop conditions in each growth stage and 2) to validate the vegetation index measured by a ground-installed sensor or unmanned aerial vehicle.In further work,crop observations under various stress conditions,such as a heatwave or disease,will be necessary to reveal the usability of ground-based optical sensing data.
Acknowledgements
This research was supported by the Rural Development Administration (PJ013821032020),Republic of Korea.
Declaration of competing interest
The authors declare that they have no conflict of interest.
Appendicesassociated with this paper are available on http://www.ChinaAgriSci.com/V2/En/appendix.htm
杂志排行
Journal of Integrative Agriculture的其它文章
- Receptor-like kinase OsASLRK regulates methylglyoxal response and content in rice
- Heredity and gene mapping of a novel white stripe leaf mutant in wheat
- Construction of a high-density adzuki bean genetic map and evaluation of its utility based on a QTL analysis of seed size
- Effects of temperature and solar radiation on yield of good eatingquality rice in the lower reaches of the Huai River Basin,China
- Difference in corn kernel moisture content between pre-and postharvest
- The effect of elevating temperature on the growth and development of reproductive organs and yield of summer maize
