Winter wheat yield estimation based on assimilated Sentinel-2 images with the CERES-Wheat model
2021-06-02LIUZhengchunWANGChaoBIRutianZHUHongfenHEPengJINGYaodongYANGWude
LIU Zheng-chun ,WANG Chao,BI Ru-tian ,ZHU Hong-fen ,HE Peng ,JING Yao-dong ,YANG Wu-de
1 College of Resource and Environment,Shanxi Agricultural University,Taigu 030801,P.R.China
2 National Experimental Teaching Demonstration Center for Agricultural Resources and Environment,Shanxi Agricultural University,Taigu 030801,P.R.China
3 College of Agriculture,Shanxi Agricultural University,Taigu 030801,P.R.China
Abstract Assimilating Sentinel-2 images with the CERES-Wheat model can improve the precision of winter wheat yield estimates at a regional scale.To verify this method,we applied the ensemble Kalman filter (EnKF) to assimilate the leaf area index(LAI) derived from Sentinel-2 data and simulated by the CERES-Wheat model.From this,we obtained the assimilated daily LAI during the growth stage of winter wheat across three counties located in the southeast of the Loess Plateau in China:Xiangfen,Xinjiang,and Wenxi.We assigned LAI weights at different growth stages by comparing the improved analytic hierarchy method,the entropy method,and the normalized combination weighting method,and constructed a yield estimation model with the measurements to accurately estimate the yield of winter wheat.We found that the changes of assimilated LAI during the growth stage of winter wheat strongly agreed with the simulated LAI.With the correction of the derived LAI from the Sentinel-2 images,the LAI from the green-up stage to the heading–filling stage was enhanced,while the LAI decrease from the milking stage was slowed down,which was more in line with the actual changes of LAI for winter wheat.We also compared the simulated and derived LAI and found the assimilated LAI had reduced the root mean square error (RMSE)by 0.43 and 0.29 m2 m–2,respectively,based on the measured LAI.The assimilation improved the estimation accuracy of the LAI time series.The highest determination coefficient (R2) was 0.8627 and the lowest RMSE was 472.92 kg ha–1 in the regression of the yields estimated by the normalized weighted assimilated LAI method and measurements.The relative error of the estimated yield of winter wheat in the study counties was less than 1%,suggesting that Sentinel-2 data with high spatial-temporal resolution can be assimilated with the CERES-Wheat model to obtain more accurate regional yield estimates.
Keywords:data assimilation,CERES-Wheat model,Sentinel-2 images,combined weighting method,yield estimation
1.Introduction
In the context of market globalization,timely estimation of crop yields at regional to global scales is of prime importance for managing agriculture and determining food pricing and trading policies (Lobellet al.2003;de Wit and Diepen 2007;Curnelet al.2011).Crop growth models can be used to accurately simulate the growth and development process of crops at a single point scale and predict the yield (Joneset al.2003;Nearinget al.2012).At the regional scale,the crop models that rely on spatial inputs are typically confronted with large uncertainties in the spatial distributions of crop genetic parameters,soil properties,and meteorological factors.These factors affect crop growth (e.g.,leaf area index (LAI) and biomass) and final yield.Satellite remote sensing is beneficial for crop monitoring over a large area.Integrating remote sensing information with crop models using data assimilation methods can effectively solve the problem of obtaining regional input parameters for crop models (Launay and Guerif 2005;Huanget al.2019b).This assimilation can improve the accuracy of yield estimations by crop models on a regional scale.Data assimilation methods use remote sensing data as observations to recalibrate crop model parameters or use updated methods to integrate remote sensing observation data with model simulation state variables to optimize the crop models and improve the accuracy of estimation in model simulation state variables(LAI,biomass,yield,etc.) (de Witet al.2007).Curnel (2011)used the four-dimensional variational algorithm to assimilate the LAI derived from remote sensing data and WOFOST model to optimize the input parameters of the WOFOST model,including the life span (in days) of leaves growing at 35°C (SPAN),the sum of effective temperatures from emergence to anthesis (°C d) (TSUM1),and the seedling emergence date.Their results showed that the accuracy of corn yield estimation assimilated by remote sensing data and the WOFOST model was increased by 25–50%,compared with the accuracy of the WOFOST model alone in estimating corn yield.de Witet al.(2007) used the ensemble Kalman filter (EnKF) algorithm to assimilate the soil moisture derived from microwave remote sensing and the WOFOST model to correct the water balance process of the crop model.They estimated the yields of winter wheat and corn in Germany,France,and other regions using the corrected WOFOST model.The results showed that the EnKF assimilation algorithm improved the estimation accuracy of the crop yields.Based on the studies mentioned above,the assimilation of remote sensing information and crop models is an effective way to achieve high-precision yield estimation at a regional scale (Dorigoet al.2007;Denteet al.2008;Becker-Reshefet al.2010;de Witet al.2012;Chenet al.2018;Huanget al.2019b).
Previous studies have confirmed that when assimilating remote sensing information into crop models for regional yield estimation,the errors and frequencies of remote sensing information impact yield estimation results.Improved accuracy of the final yield simulations occurs when more remote sensing data are inputted into the models because the crop growth state variables (i.e.,LAI and biomass) are better parameterized (Curnelet al.2011;Chenget al.2018;Huanget al.2019a).Casaet al.(2012)forced LAI data into a crop model which compensated for a lack of detailed knowledge on management practices or soil characteristics.However,the errors and frequency of LAI observations can impact the estimation of agronomic variables.Curnelet al.(2011) found that the moment of assimilation,the level of uncertainty of remotely sensed data,and the time step between the assimilated LAI observations,all influenced assimilation performance when remote sensing LAI observations were available every 3 days to 1 week.In that study,the assimilation accuracy was reliable,and the error of the model was less than 10% for the yield estimation using the assimilation approach.This shows that the assimilation performance depends strongly on the LAI retrieval accuracy and the scaling correction.
The assimilation of crop models and remote sensing information with high spatial and temporal resolution is crucial for improving the accuracy of yield estimation.Currently,the commonly used remote sensing data for assimilation into crop models are Landsat and MODIS,which have a low temporal or spatial resolution.For example,the high temporal resolution (4–8 days) of MODIS images meets the requirements of crop model assimilation for the frequency of remote sensing information,but the relatively low spatial resolution (250–1 000 m) will result in mixed pixels.As a result,the winter wheat MODIS-LAI has been found to be lower than the field measurements (Donget al.2016;Huanget al.2016).Landsat images are not collected frequently enough (16 days) to allow accurate estimation of LAI for crop models,and the quality of Landsat images is affected by weather and cloud cover.Moreover,Landsat cannot provide sufficient frequency of observations during the growth stage of winter wheat (Launay and Guerif 2005;Donget al.2016).However,Sentinel-2 data,an Earth Observation Satellite of the Copernicus Project (GMES) from the European Space Agency,are ideal for assimilation with crop models because of the high spatial (10 m) and temporal resolution (5 d)(Verrelstet al.2014;Belgiu and Csillik 2018).Researchers have tried to assimilate Sentinel-2 data with crop models for yield estimation since this method has promising application potential (Teweset al.2020;Wagneret al.2020).
The DSSAT model is driven by light,temperature and water.Different modules have been developed for different crops,including CERES-Wheat,CERES-Maize,CERES-Rice,and CERES-Barley (Joneset al.2003).CERES-Wheat is specially developed for wheat and aims to simulate the growth and development of wheat.In this study,field observation data (seed weight and dry biomass at the maturity stage) were used to calibrate the genetic parameters of the CERES-Wheat model.The application of this model in China is relatively mature (Xieet al.2017).Therefore,we used the CERES-Wheat model to simulate the growth and development of winter wheat in this study.
In this study,the LAI retrieved from Sentinel-2 were assimilated into the CERES-Wheat model.Three counties in the southeast of the Loess Plateau in China with scattered farmland and small plots were used as the study area.We used field measurements and survey data from 2017 to 2019.The EnKF algorithm was used to assimilate the derived LAI from Sentinel-2 images and the simulated LAI from the CERES-Wheat model.We weighted the LAI at different growth stages by comparing the results from an improved analytic hierarchy process,an entropy method and a normalized combination weighting method.We constructed a model with the measured yield from winter wheat to accurately estimate crop yield.This study evaluates the assimilation of high spatial-temporal resolution remote sensing data and the growth state variables simulated by the CERES-Wheat model,and constructs a high-precision yield estimation model.
2.Materials and methods
2.1.Study area
The research areas are located in the southeast of the Loess Plateau in China and included three counties:Wenxi County,Xinjiang County and Xiangfen County(110°59´33´´–111°40´31´´E,35°9´38´´–36°03´14´´N,altitude between 184–1 535 m).The study area is characterized by a warm-temperate continental monsoon climate with an average annual rainfall of 450–600 mm,an annual average temperature of 12–14°C and a frost-free period of 160–190 days.The crops in this region are mainly wheat in winter and maize in summer.As the main crop in the study area,the planting area of winter wheat is 1.08×10⁵ha,accounting for 73.31% of the farmland area.Winter wheat is planted in early October,germinates 5 or 6 days after sowing and is harvested in early June of the following year.The main growth stages for winter wheat include the green-up stage(from early March to mid-March),the jointing stage (from late March to mid-April),the heading–filling stage (from late April to early May) and the milking stage (from mid-May to late May).
2.2.Data
Field measurementsThere was a total of 45 sampling points in the study area (Fig.1-B).In September 2017,10 points were selected (red dots in Fig.1-B) for soil samples.Soil samples were taken for physical and chemical analyses before winter wheat sowing.The soil profile was divided into 7 layers (0–10,10–20,20–50,50–80,80–120,120–160,and 160–200 cm).The physical and chemical properties of each layer of the soil profile were measured in the laboratory,including wilting point (cm3cm–3),field water holding capacity(cm3cm–3),bulk density (g cm–3),organic carbon content (%),clay content (%),silt content (%),total nitrogen (mg kg–1),available potassium (mg kg–1),available phosphorus (mg kg–1),ammonium nitrogen (mg kg–1),pH,cation exchange capacity (cmol kg–1),and soil moisture content (cm3cm–3).These properties were used as the soil input parameters for the CERES-Wheat model.
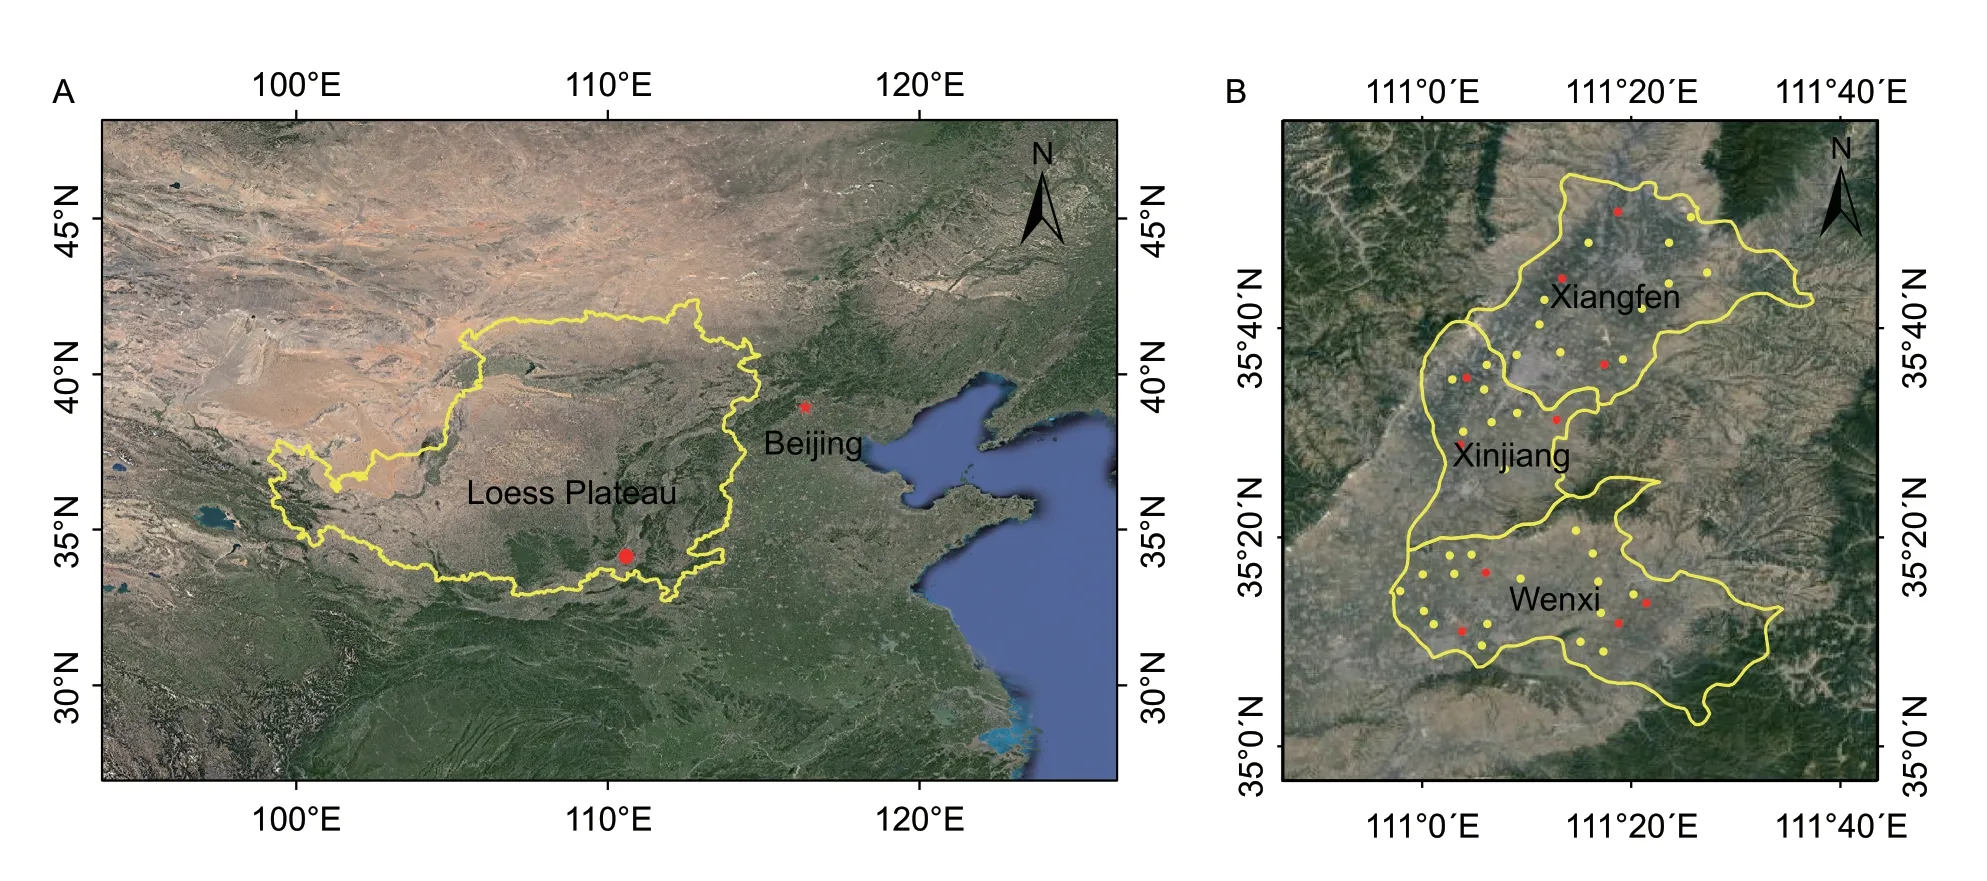
Fig.1 The geographical location and sampling points of the study area.A,the location of the study area in the Loess Plateau,China.B,the location of the field measurement points in the three counties and the red points are the sampling points for assimilation.
LAI and soil moisture were measured on March 19 and April 16,2018,and March 17,and April 19,2019.LAI was measured using dry weight,and the moisture content of 0–20 cm soil was measured by the drying method.During the maturity of winter wheat in 2018 and 2019,the measurement of yield was sampled within a 1 m×1 m area.The samples were dried,threshed,and weighed to calculate the yield (kg ha–1).In addition,field management data were collected from 2017–2019.This included wheat varieties,planting dates,maturity dates,planting methods,planting density,fertilization dates and amounts,and irrigation dates and amounts,and detailed information is shown in Table 1.In this study,the measured and field management data from 2018 were used to calibrate the CERES-Wheat model.The data from 2019 were used to conduct the assimilation for regional winter wheat yield estimation.
Sentinel-2 dataSentinel-2 data were downloaded from the European Space Agency’s data sharing website (https://scihub.copernicus.eu/).The Sentinel-2 images have a temporal resolution of 5 d,and a spatial resolution of 10 m in the red and near-infrared bands.Sentinel-2 images with cloud content <10% from the main growth stage of winter wheat were chosen for seven dates:March 17,April 1,April 16,April 26,May 11,May 21,and May 26 in 2019.
2.3.LAI derived from Sentinel-2
It has been shown that there is a good quantitative relationship between normalized difference vegetation index (NDVI) and LAI (Haboudaneet al.2004;Manna and Raychaudhuri 2020).We first calculated the NDVI of the seven Sentinel-2 images.Then we obtained the corresponding NDVI values on March 17,2019,for the 45 locations in the field based on their geographic coordinates.We further established a regression model between NDVI and LAI from field measurements on the same day (eq.(1)).The regression model had a determination coefficient (R2) of 0.52 and the root mean square error (RMSE) of 0.9955 m2m–2,which was statistically significant (P<0.01).The LAI of the seven Sentinel-2 images was derived according to eq.(1):

2.4.CERES-Wheat model
Based on the mass and energy transfer theory between soil,crop and atmosphere,the CERES-Wheat model uses light,temperature,water,and soil characteristics as environmental driving variables to simulate a series of crop physiological and biochemical processes such as photosynthesis,respiration,and transpiration.The model evaluates the relationships of these factors with environmental conditions such as weather (atmosphere)and soil at a daily scale during the whole growth stage of the crop using physical and mathematical methods.It artificially reproduces the growth and development of crops(Joneset al.2003;Quet al.2019).The parameter inputs of the model include meteorological (the daily maximum and minimum temperatures,the daily total precipitation and the daily solar radiation),soil,crop variety,and field management data.The meteorological data (maximum and minimum temperatures,precipitation and sunshine hours) in this study are measured data from meteorological stations in Xiangfen County,Xinjiang County,and Wenxi County,and the solar radiation data are estimated from sunshine hours according to Pohlert’s method (Pohlert 2004).Soil physical and chemical parameters and field management data were measured and surveyed in the study area.
Application of the CERES-Wheat model at a regional scale requires regional calibration,which is the process of determining representative varieties for a specific area (Fanget al.2011;Jinet al.2016).In the CERES-Wheat model,the genetic parameters (P1V,P1D,P5,G1,G2,G3,and PHINT)of seven varieties of winter wheat are shown in Table 2.P1V,P1D,and P5 determine the phenological phase of winter wheat.G1,G2,G3,and PHINT affect the yield of winter wheat together (Joneset al.2003).The calibration of genetic parameters generally uses a“trial-and-error”method(Xieet al.2017;Liet al.2018).Using the calibrated genetic parameters to model the 10 red sampling sites in Fig.1 in 2018,the RMSE of the simulated LAI and the measured LAI was 1.1243 m2m–2,and the average relative error (ARE)was 12.45%.The RMSE between simulated and measured values of yield was 622.23 kg ha–1,and the ARE was 7.76%.The difference between the simulated harvest date and the actual harvest date was less than 4 days.This suggests that the calibrated CERES-Wheat model has high simulation accuracy.The genetic parameters of the calibrated winter wheat are shown in Table 2.

Table 1 Field management information for 2017–2019
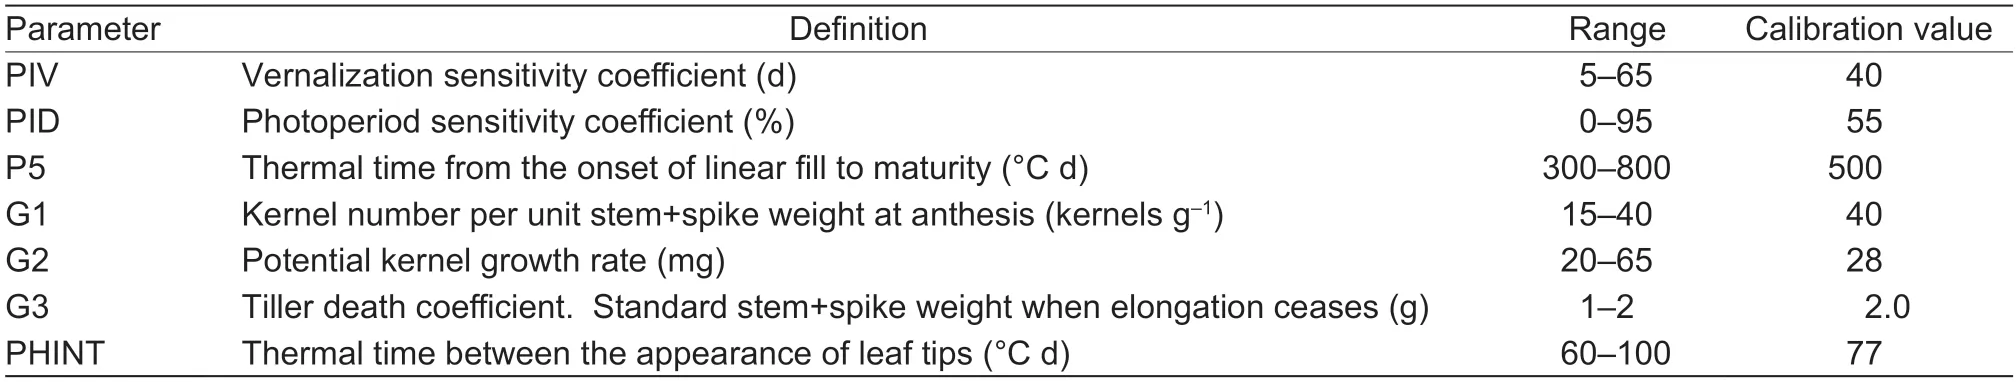
Table 2 Calibration values of genetic parameters of crop varieties in the CERES-Wheat model
2.5.EnKF assimilation algorithm
The EnKF is a Monte Carlo variant of the Kalman filter(Evensen 2003) which is able to incorporate availableobservations sequentially in time.The basic idea of the EnKF assimilation algorithm is to estimate the covariance between the state variable and the observed variable from the forecast set,and then use the observed data and covariance to update the forecast set by analytical equations (de Wit and Diepen 2007;Wanget al.2013;Huanget al.2016).
The basic filter update step in an EnKF for each ensemble member can be defined as:
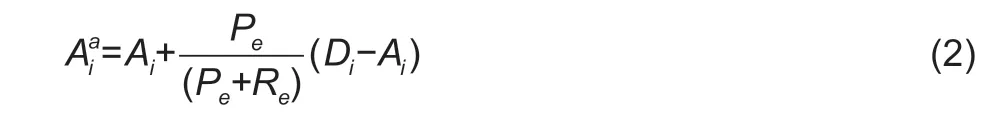
whereAiaandAiare the analyzed and forecasted LAI for ensemble memberi,PeandReare the variances on the modelled LAI and the“synthetic”LAI,respectively,andDiis the perturbed LAI value used to update ensemble membersi.
The assimilation process follows a series of steps.First,the standard errors of simulated LAI of the CERES-Wheat model (SlLAI),derived LAI of remote sensing (RsLAI),and the measured LAI were calculated asPe=0.17×LAI m2m–2,Re=0.13×LAI m2m–2.Based on the standard deviationPeof SlLAI,SlLAI was then perturbed by the Monte Carlo method to generate forecast setAiat theitime when the winter wheat green-up stage was simulated by the CERES-Wheat model.Then,according to standard deviationReof RsLAI,RsLAI data were perturbed to generate the same size of data as the observed setDi.TheAiandDiwere substituted into the process of assimilation (eq.(2)) to give the assimilation LAI(DaLAI) atitime.We then used the DaLAI value to update the simulated LAI of CERES-Wheat model atitime and ran to thei+1 moment.
2.6.Yield estimation of winter wheat
Improved analytic hierarchy processThe improved analytic hierarchy process is a mathematical tool for systematic analysis.The weights are determined by constructing a comparison matrix,a transfer matrix,and a quasi-uniform consistency matrix.In this study,the growth stage of the winter wheat was divided into four main stages:green-up stage,jointing stage,heading–filling stage,and milking stage.A comparison matrixB(bij) was established according to the impact of LAI on yield at each growth stage (Bellver and Mellado 2005;Zhanget al.2016;Sunet al.2017).
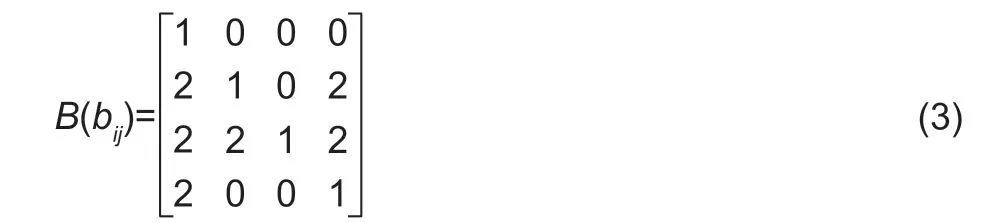
where 0 means that theith growth stage is less important than thejth growth stage,1 means that theith growth stage is as important as thejth growth stage,and 2 means that theith growth stage is more important than thejth growth stage important.
Based on the calculation of the importance coefficientsof the four growth stages,we obtained a judgment matrix Cijfor the main growth stages of winter wheat:
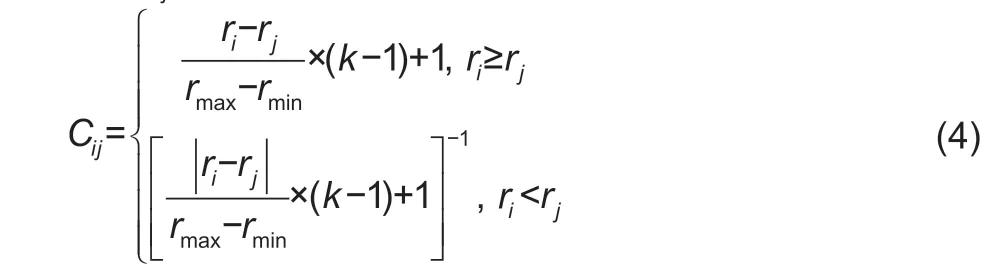
where According to Cij,we calculated the transfer matrix and the quasi-uniform consistency matrix.We then obtained the weights of each growth stage of winter wheat by normalizing the quasiuniform consistency matrix.
The entropy methodWe used the LAI data of the four growth stages to construct a data matrixA(aij)n×4(nis the number of samples),and calculated the entropy valuehjand the difference coefficientgjof each growth stage (Rubinstein 1999;Xieet al.2017):
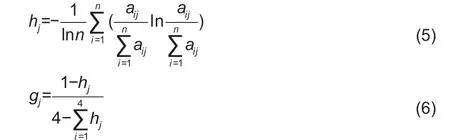
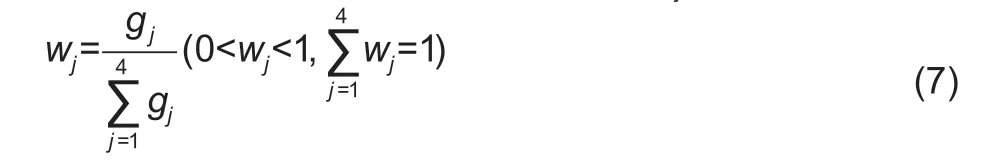
The weight (wj) at thejth growth stage was obtained by normalizing the coefficient of differencegj:
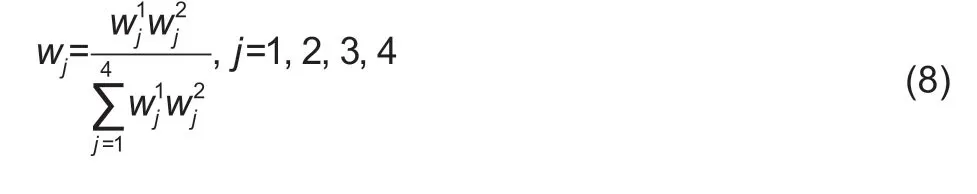
The normalized-combined weighting methodCompared to separate subjective and objective weighting methods,the combined weighting method can fully reflect the data information.Setting the weight of thejth growth stage determined by the subjective weighting method (improved analytic hierarchy process) waswj1and the weight of thejth growth stage determined by the objective weighting method(entropy method) waswj2.Then the weight of thejth growth stage,wj,was determined by the normalized combination weighting method (Malczewski 2000;Zhang and Zhou 2011):
3.Results
3.1.Comparison of simulated and assimilated variables
The CERES-Wheat model can simulate variables of the daily growth and changes in the growth status for winter wheat(i.e.,LAI and biomass).The SlLAI curve showed that the LAI at 150 days after sowing reached about 0.4 m2m–2.The SlLAI gradually increased and reached a peak around 200 days after sowing.Then SlLAI decreased.The SlLAI decline period can be divided into two stages.In the first stage,the heading–filling–milking stage from the 200th to the 230th day after sowing,SlLAI showed a relatively slow decline.In the second stage,the harvest period from around the 230th to the 240th day,SlLAI declined sharply (Fig.2).
The RsLAI and the SlLAI simulated by the CERES-Wheat model were assimilated using the EnKF algorithm to obtain DaLAI.DaLAI maintained the changing pattern of SlLAI.The DaLAI increased rapidly from the green-up stage to the heading–filling stage and reached the maximum at about 200 days after sowing.DaLAI and SlLAI reached their maximum values at the same time.Then DaLAI began to decrease.During the green-up stage to the heading–filling stage of the winter wheat,SlLAI was lower than the measured LAI.Using RsLAI to correct the simulation curve,we found the values of DaLAI increased substantially and were closer to the measurements in the field.After the peak of LAI was reached,SlLAI decreased more rapidly.Using RsLAI to correct SlLAI,we found the decline of DaLAI slowed down,which was more in line with the actual change of LAI during the winter wheat filling stage (Fig.2).
Using field-measured LAI on March 17,2019,and April 19,2019,we established linear regression equations between SlLAI,DaLAI or RsLAI and measured LAI,and calculated the RMSE (Fig.3).The regressions between SlLAI,DaLAI or RsLAI and the measured LAI passed the significance level test of 0.01.DaLAI had the smallest RMSE,followed by RsLAI.SlLAI had the largest RMSE.DaLAI was the closest to the field measured LAI,followed by RsLAI.The changes of SlLAI were consistent with those of the measured LAI for winter wheat,but the simulated values were different from the measurements.The accuracy of DaLAI was higher than that of SlLAI and RsLAI,and it was more representative of the actual situation of the winter wheat LAI in the study area.
To estimate the regional yield of winter wheat,we needed to extend the LAI assimilation values at the field scale to the regional scale.Considering factors such as the phenological period of winter wheat and the imaging times of remote sensing images,we selected the derived LAI of the Sentinel-2 images on March 17,April 1,April 16,and May 21,2019,as the LAI at the green-up,jointing,heading–filling,and milking stages,respectively.Regression analysis was performed on those selected LAI and the assimilated LAI at the corresponding dates of the 10 sample points to obtain the assimilated LAI at the regional scale across the phenophase.
3.2.Constructing the model for yield estimation
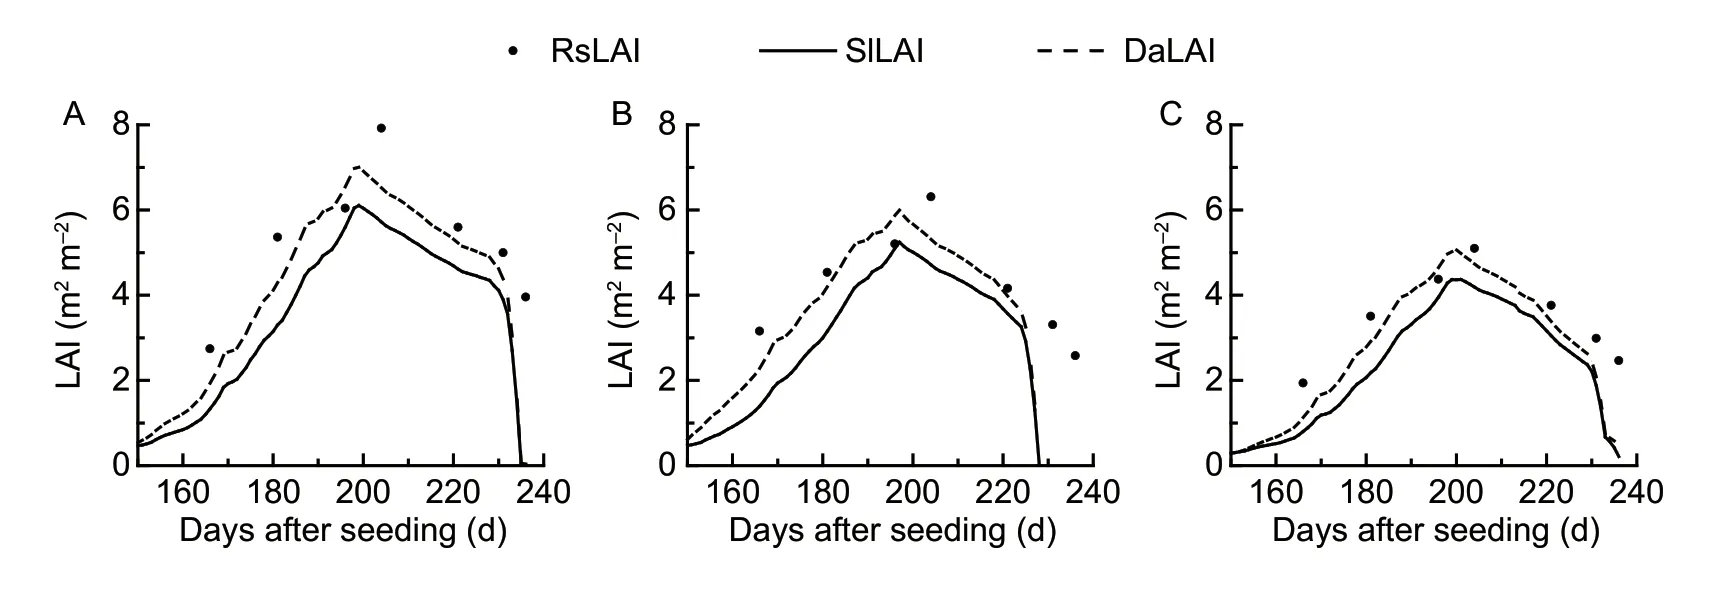
Fig.2 RsLAI,SlLAI and DaLAI results of winter wheat in the three sites of Shanxi Province,China.A,Nanxindian Village of Xiangfen County.B,Zezhang Village of Xinjiang County.C,Su Village of Wenxi County in 2019.RsLAI,the leaf area index (LAI)derived from Sentinel-2;SlLAI,the simulated LAI from CERES-Wheat model;DaLAI,the assimilated LAI.
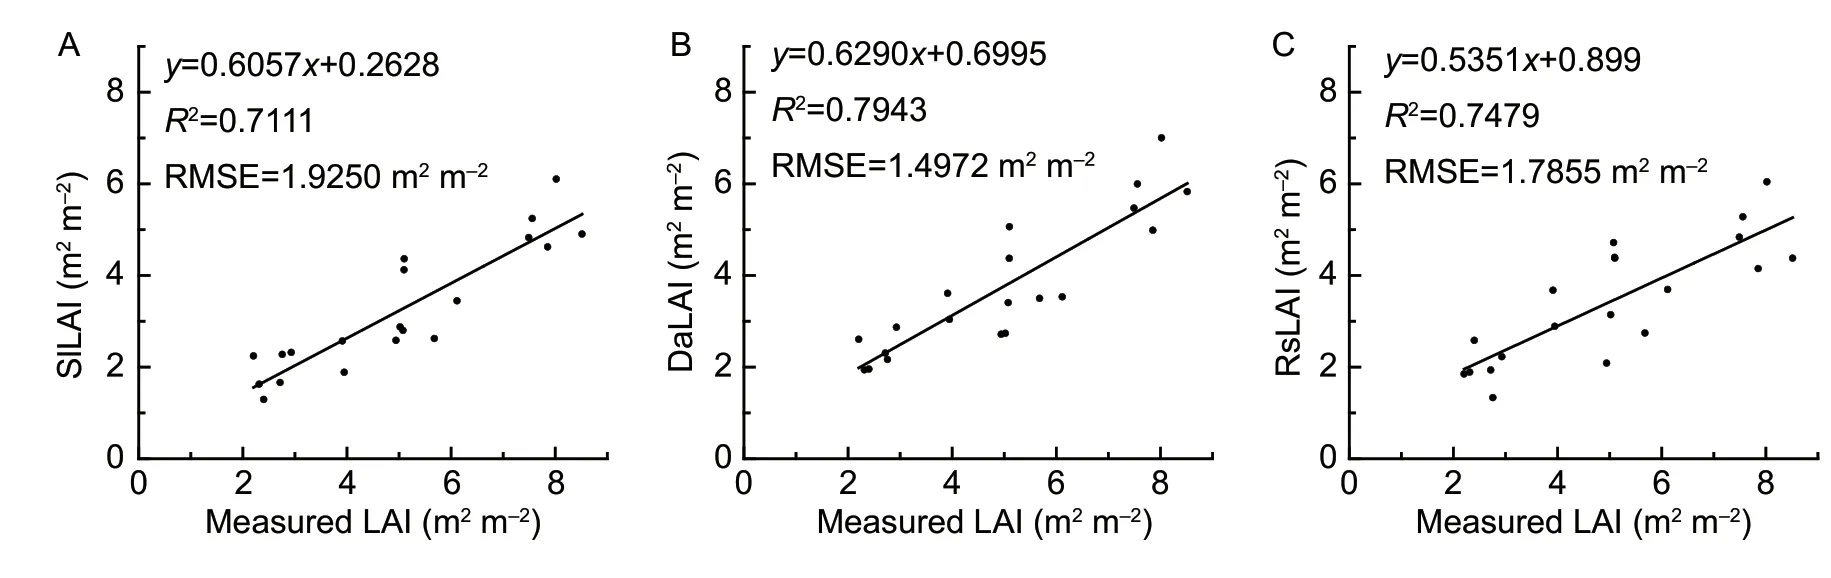
Fig.3 Linear regression of SlLAI and measured LAI (A),DaLAI and measured LAI (B) and RsLAI and measured LAI (C).SlLAI,the simulated LAI form CERES-Wheat model;DaLAI,the assimilated LAI;RsLAI,the LAI derived from Sentinel-2.
The LAI (SlLAI,RsLAI,and DaLAI) at different growth stages were weighted by the three methods of the improved analytic hierarchy method,the entropy method,and the normalized combination weighting method.The weights of the different growth stages of the winter wheat determined by these three weighting methods are shown in Table 3.The weights of the different growth stages of the winter wheat determined by the entropy method are similar,which does not reflect the contribution of LAI of different growth stages to the yield of winter wheat.The weights determined by the analytical method and the normalized combination weighting method are more reasonable.Winter wheat has a small number of leaves,a small leaf area,and a small contribution to the yield at the green-up stage.From the jointing stage to the heading–filling stage,the number of leaves increases to the maximum and the leaf area is the largest.It can best indicate the difference in the growth status of winter wheat.When the leaves turn yellow during the milking stage,the LAI index starts to decline,and its contribution to yield decreases.
Different weighting methods were used to assign weights to the LAI across the four main growth stages of winter wheat.The weighted LAI was obtained by linear combination.Then a one-dimensional linear regression model of weighted LAI and measured yield was established across the different weighting methods and different types of LAI.The results are shown in Table 3.LAI of the four growth stages (green-up,jointing,heading–filling,and milking stage) are labeled sequentially asx1,x2,x3,andx4,respectively.Xin the yield estimation model used weighted values by taking the weights ofx1,x2,x3,andx4as the coefficients of the linear combination.Then linear regression was used to obtain the yield estimation model between the measurements and the weighted LAI(X).Taking the linear regression equation between measured yields and SlLAI from the improved analytic hierarchy process as an example,the weights of LAI of different growth stages were linearly combined to obtain a weighted LAI,which was:X=0.0550x1+0.2630x2+0.5640x3+0.1180x4.Then a linear regression equation of yield (y) and weighted LAI(X) was established,which was:y=1648.5X–678.94.TheR2and the RMSE were obtained.Other yield estimation models were built following the same steps.
Based on comparison among the nine models for yield estimation in Table 3,we found that when the weighting method is the same,the yield estimation model constructed by weighted DaLAI showed the highestR2and the lowest RMSE value.The weighted RsLAI showed a moderateR2.Its RMSE value was also moderate.The weighted SlLAI showed the lowestR2and the highest RMSE value.These results indicate that the estimated yield of weighted DaLAI fitted well with the measurements.The accuracy of the estimated yield model was high.For the same type of LAI,theR2of the yield estimation models constructed using the three weighting methods were,in order from high to low:the normalized combination weighting method,improved analytic hierarchy process,and entropy method.The RMSE of the models from small to large is the normalized combined weighting method,improved analytic hierarchy process,and entropy method.The accuracy of the yield estimated model from the normalized combined weighted method was the highest,followed by the improved analytic hierarchy process,and the lowest was from the entropy method.These results show that the yield estimation model constructed by weighted DaLAI of the normal combination weighting method has the highestR2and the smallest RMSE,and is therefore the optimal yield estimation model in the study area.
3.3.Regional estimated yield of winter wheat
Based on the LAI assimilation data at each growth stage and the weighted DaLAI of the normalized combination weighting method,the estimated yield model was constructed asy=1335.0X–338.76.The yield of winter wheat in 2019 was estimated from the model in the study area (Fig.4).The estimated average yields of winter wheat in Xiangfen,Xinjiang and Wenxi counties were 5 266,5 116,and 4 412 kgha–1,respectively.The statistics from the Shanxi Provincial Bureau of Statistics showed that the average yields of winter wheat in Xiangfen,Xinjiang,and Wenxi counties in 2019 were 5 746,5 497,and 4 707 kg ha–1,respectively.The relative errors between the estimated average yields and the statistical average yield in the counties were 0.08,0.05,and 0.06%,respectively,which indicated a high accuracy of estimation.
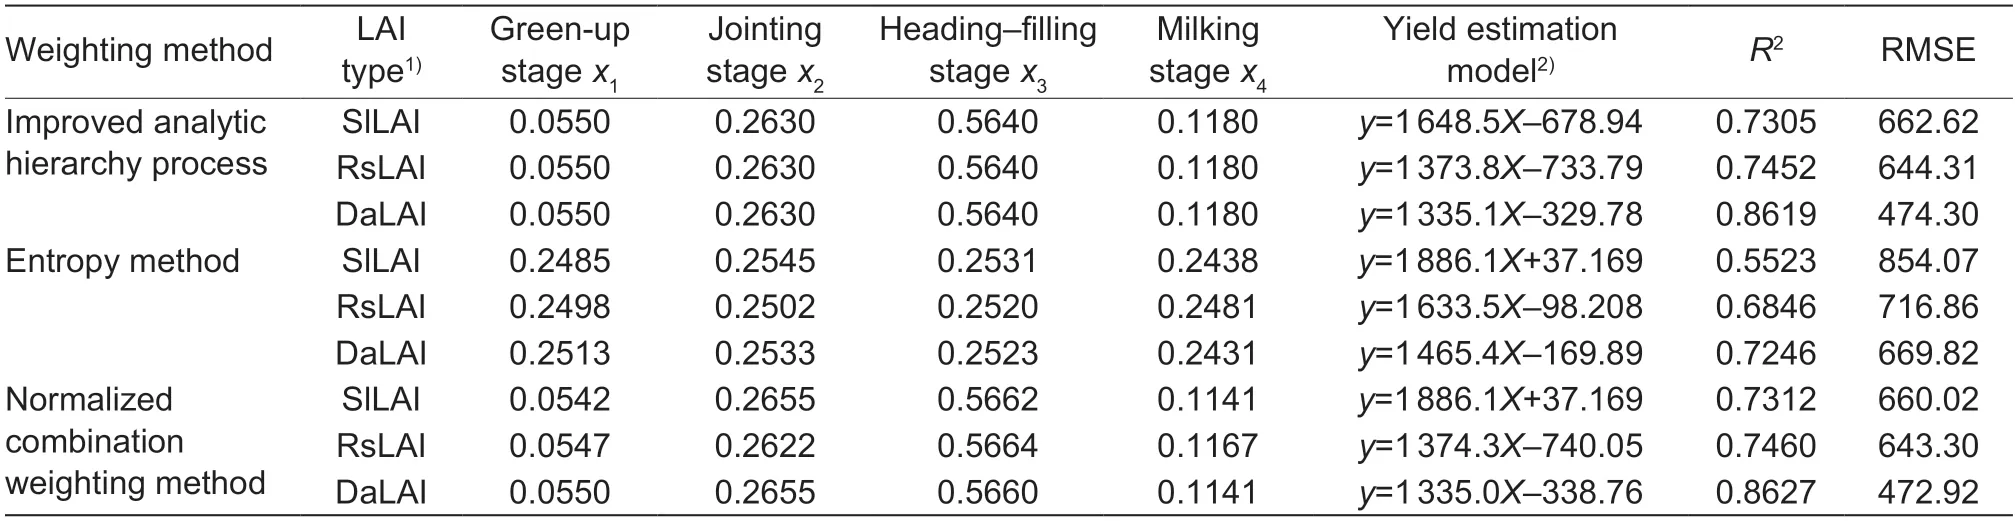
Table 3 LAI weights and yield estimation models for different growth stages of winter wheat determined by the three tested methods
4.Discussion
4.1.Improvement of the LAI accuracy using EnKF assimilation
Results from previous studies have shown that the assimilation of remote sensing data with high spatialtemporal resolution into crop models can significantly improve the accuracy of LAI estimation (Curnelet al.2011;Casaet al.2012;Xieet al.2017).The temporal resolution of Sentinel-2 data used in this study is 5 d and the spatial resolution is 10 m.There were 20 dates of Sentinel-2 images in the main growth stage of winter wheat from March 1 to June 10 in 2019.There were seven images which had less than 10% cloud cover.These images were available at different winter wheat growth stages.The derived LAI of the Sentinel-2 images has a spatial resolution of 10 m.This high spatial resolution reduces the influence of other land types on the winter wheat LAI,ensuring more pixels with winter wheat only,thus maintaining high accuracy of the derived LAI.With high-accuracy,high-frequency LAI derived from Sentinel-2 images assimilated into the CERES-Wheat model,the assimilated LAI were similar to the measured data (Figs.2 and 3),resulting in high-accuracy estimates of winter wheat yield.
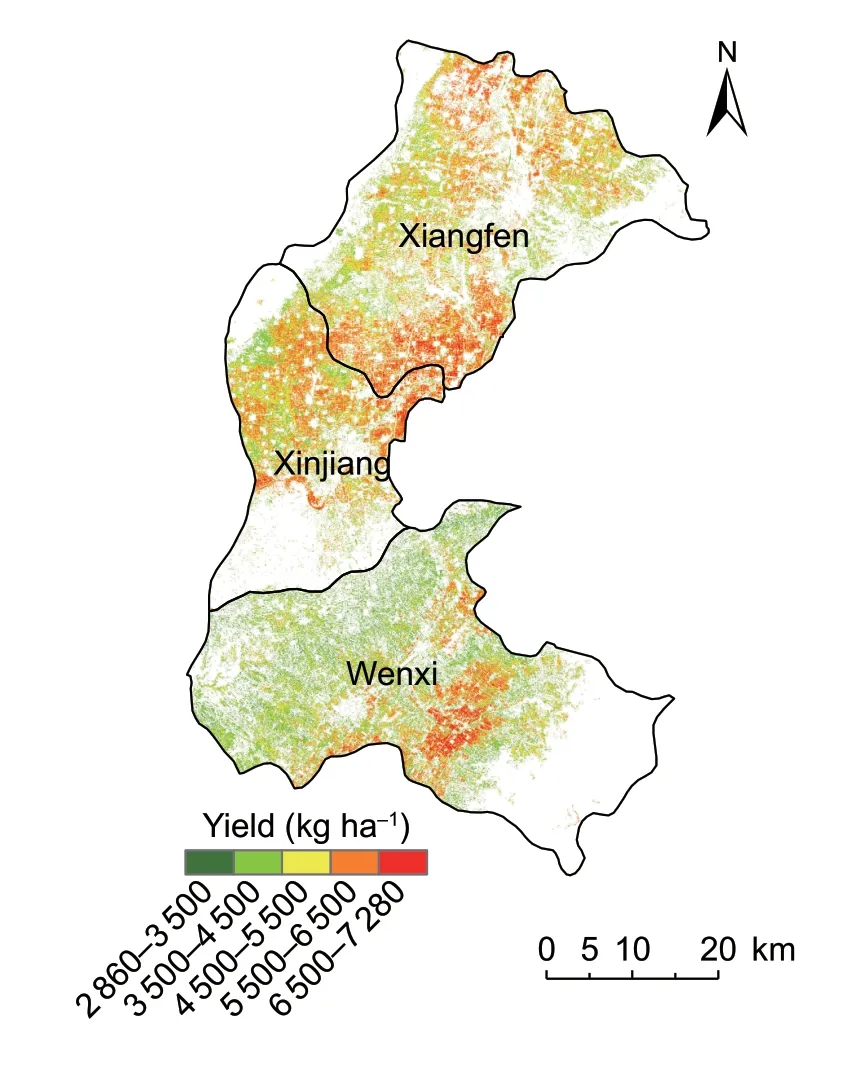
Fig.4 Yield distribution of winter wheat in Xiangfen,Xinjiang and Wenxi counties of Shanxi Province,China in 2019.
Casaet al.(2012) found that the longer the observation period and more observation data inputted into the STICS model,the better the LAI dynamic adjustment.This was achieved by using measured LAI data instead of remote sensing data to assimilate into the STICS model in northern France.Curnelet al.(2011) found that the accuracy of assimilated estimated yield was the highest when the frequency of LAI was 3 to 7 d.They achieved this by incorporating the derived LAI of SPOT-HRV into the WOFOST model and adjusting the input frequency of LAI.Donget al.(2016) found that the estimates and measurements of biomass were in good agreement;they used a data fusion algorithm STARFM to fuse Landsat and MODIS data that captured the spatial resolution of Landsat data and the temporal resolution of MODIS data,and further assimilated the fused data into a crop model.Huanget al.(2016) found that the spatial resolution of the MODIS-LAI products was too low for crop modelling,and the insufficient spatial resolution resulted in underestimation of simulated LAI by 60% compared to the measurements.To improve the accuracy of yield estimation,they modified the simulated LAI using measurements or derived LAI from Landsat,and assimilated the modified LAI into the crop model.Xieet al.(2017) used the CERES-Wheat model and LAI data derived from Landsat images to assimilate yield estimation.They found that due to the influence of clouds and rain,there were only three dates of suitable image quality available during the winter wheat growing season.The problem of mixed pixels still existed at 30-m spatial resolution,which can affect the quality of the derived LAI,and result in a lower value for the derived LAI compared to measured LAI.Previous studies have shown that the assimilation of remote sensing data with high spatial-temporal resolution data into crop models is crucial for improving the accuracy of regional yield estimation for winter wheat.However,remote sensing data with low spatial-temporal resolution have been used in many previous studies.In this study,we focused on assimilating high spatial-temporal resolution Sentinel-2 data into the CERES-Wheat model to obtain a more accurate estimate of regional yield (Figs.2 and 3).
4.2.The combination weighting method improves the accuracy of yield estimation
The correlations between LAI and winter wheat yield differed with growth stage.To synthesize the useful information provided by LAI at each growth stage,weighted LAI was calculated according to the contribution of LAI to yield at the different growth stages.The weighted LAI was used to construct a yield estimation model,thereby improving the accuracy of winter wheat yield estimates.The improved analytic hierarchy process is a subjective weighting method,which determines the relative importance of each growth stage of winter wheat based on prior agricultural knowledge and determines the weights of each growth stage by matrix operations (Wanget al.2018b).The entropy method is an objective weighting method which determines the weights according to the LAI matrix of each growth stage.The normalized combination weighting method combines the advantages of subjective and objective weighting methods.It not only reflects empirical knowledge but also captures the objective patterns of the data.The weights determined by the normalized combination weighting method are more realistic than those of other methods.Wanget al.(2018a)combined the improved analytic hierarchy process and grey correlation analysis method to form a combined weighting method.This method determined the weight coefficients of LAI and vegetation temperature condition index (VTCI) in each growth stage of maize.They performed a regression analysis on the constructed growth monitoring index and yield of maize,and found that LAI and VTCI based on the weights of each growth stage accurately estimated maize yield.Xieet al.(2017) used the entropy method to separately analyze the correlations between LAI,biomass or soil moisture at different growth stages and the yield measurements.They applied the combined prediction method of entropy to determine the weights of different variables that can affect winter wheat yield.A comprehensive index was generated and its correlation with the measured yield was analyzed.Their results showed that the accuracy of the yield estimation model for winter wheat using the comprehensive index was significantly higher than that of the estimation model using a single variable.In this study,the normalized combination weighting method was used to determine the weights of LAI at different growth stages.The constructed yield estimation model using weighted LAI and calibrated with measurements was highly accurate.TheR2was greater than the improved analytic hierarchy process and the entropy method.RMSE of this weighting method was less than the other two methods (Table 3),which is consistent with the findings from other studies.Therefore,the normalized combination weighting method can provide more reasonable estimates for the weights of LAI in each growth stage and improve the accuracy of estimated yield.
4.3.Future research prospects
Currently,widely used crop growth models include DSSAT,WOFOST,APSIM and STICS.Due to the complicated mechanisms of the actual crop growth,each of the crop growth models focus on a specific process across multiple crop growth processes to meet different application requirements.For example,the DSSAT model is mainly driven by light energy,while the WOFOST model sets CO2assimilation as the key simulation,and focuses on the formation and quantitative description of yield (Diepenet al.2010).The APSIM model uses soil water as the main driving force and extensively verifies the effects of soil factors on crop growth (Keatinget al.2003).The STICS model considers the impact of management factors on crop growth (Brissonet al.2003).Therefore,integrating multiple crop models can complement the advantages of the different crop models in simulating multiple processes,and can more accurately estimate the interactions between crop growth and factors like soil,weather,water,fertilizer,and management.In some studies,multi-crop model coupling is used to further improve the prediction accuracy of the crop growth model (Martreet al.2015).
The variety differences of crops are important factors that determine the accuracy of the crop model yield estimation.Unfortunately,the wheat variety differences were not considered in this experiment,which is a shortcoming in the research.We will improve the model simulation accuracy of different varieties of crops by focusing on the effect of crop varieties in further research.
5.Conclusion
We compared simulated and derived LAI and found the assimilated LAI had reduced the RMSE by 0.43 and 0.29 m2m–2,respectively,based on the measured LAI.The normalized combined weighting method provided the most reasonable weights.The weights at each growth stage were:0.0550 at the green-up stage,0.2655 at the jointing stage,0.5660 at the heading–filling stage,and 0.1141 at the milking stage.The yield estimation model constructed by the weighted assimilated LAI from the normalized combination weighting method had the highestR2(0.8627) and the lowest RMSE (472.92 kg ha–1),indicating it was the optimal yield estimation model.
Acknowledgements
This work was supported by the National Key Research and Development Program of China (2018YFD020040103) and the National Key Research and Development Program of Shanxi Province,China (201803D221005-2).
Declaration of competing interest
The authors declare that they have no conflict of interest.
杂志排行
Journal of Integrative Agriculture的其它文章
- Monilinia fructicola on loquat:An old pathogen invading a new host
- Mechanization and efficiency in rice production in China
- Farmers’ risk preference and fertilizer use
- Simple method for extracting the seasonal signals of photochemical reflectance index and normalized difference vegetation indexmeasured using a spectral reflectance sensor
- Monthly composites from Sentinel-1 and Sentinel-2 images for regional major crop mapping with Google Earth Engine
- Response of carbon footprint to plastic film mulch application in spring maize production and mitigation strategy