Farmers’ risk preference and fertilizer use
2021-06-02QIAOFangbinHUANGJikun
QIAO Fang-bin,HUANG Ji-kun
1 China Economics and Management Academy,Central University of Finance and Economics,Beijing 100081,P.R.China
2 School of Advanced Agricultural Sciences,Peking University,Beijing 100089,P.R.China
3 School of Economics and Management,Jiangxi Agricultural University,Nanchang 330045,P.R.China
Abstract This study examines the role of farmers’ risk attitudes toward fertilizer use in cotton production in China.Contradicting previous studies,this paper theoretically shows that the relationship between farmers’ risk aversion and fertilizer use is not always monotonic.Field survey data were collected to test this relationship using the Cobb–Douglas production function.Results suggest that when the elasticity of fertilizer use and the probability of achieving the desired effects from fertilizer use are high,risk-averse farmers apply more fertilizer than risk-taking farmers.Conversely,when the elasticity of fertilizer use and the probability of achieving the desired effects are low,risk-taking farmers apply more fertilizer than risk-neutral or risk-averse farmers.
Keywords:risk preferences,fertilizer use,farmers,environment,China
1.Introduction
Previous studies have shown that fertilizers can be regarded as a risk-increasing input,making agriculture riskier than other industries.Apart from market risk,the most important risk is output uncertainty.Owing to variations in weather conditions (e.g.,drought and flood)and other environmental factors (e.g.,pest outbreaks),yield may vary significantly from year to year.Due to output uncertainty,risk-averse farmers apply less fertilizer than other farmers (Pope and Kramer 1979).Similar results have been found by many other studies (Russell 1968;Quiggin and Anderson 1979;McDonald 1989;Leathers and Quiggin 1991;van Herwaardenet al.1998;Sadras 2002;Roosen and Hennessy 2003;Broun 2007;Lobell 2007;Rajsicet al.2009;Picazo-Tadeo and Wall 2011).
However,some other studies (SriRamaratnamet al.1987;Below and Brandau 2001;Sawyeret al.2006;Zhanget al.2006;Nieet al.2012;Huet al.2019;Liet al.2021) have shown that farmers consistently over apply fertilizer.Fertilizer overuse leads to many negative outcomes,such as increased production costs,environmental pollution,and threats to human and animal health.In particular,nonpoint source pollution due to fertilizer overuse,has become a severe problem in many countries (Zhanget al.2006;Sunet al.2012).
To address the apparent paradox-fertilizer being both risk-increasing and over applied-Paulson and Babcock(2010) introduced a model of optimal fertilizer use under uncertainty.They showed that input uncertainty (e.g.,soil quality and rainfall) cause farmers to over apply fertilizer while output uncertainty cause farmers to under apply fertilizer.In other words,uncertainty regarding both inputs and outputs affects the fertilizer use and whether it is over or under application depends on which uncertainty dominates.
Given that the optimal level of fertilizer is the amount applied under conditions of certainty,some studies (e.g.,Pope and Kramer 1979) showed that risk-averse farmers apply less than the optimal level,while other studies(e.g.,Paulson and Babcock 2010) showed the contrary.In addition,all of these studies revealed that risk-averse farmers apply more fertilizer than risk-neutral or risktaking farmers.Therefore,there is a positive relationship between the degree of risk aversion and fertilizer use.
In addition,approaches based on the agronomic theory of limiting-input have shown that over application of an agricultural input,such as technology,may be viewed as a form of self-protection (Paulson and Babcock 2010).From the limiting-input perspective,agricultural production is determined by the most limiting input.Hence,farmers may over-apply fertilizer to ensure fertilizer not to be a limiting input and thus,protect themselves from potentially low yield.According to this theory,the degree of risk aversion has a monotonic relationship with fertilizer use:risk-averse farmers apply the most fertilizer,while risktaking farmers apply the least fertilizer.
However,Roosen and Hennessy (2003) demonstrated that the monotonic relationship between the degree of risk aversion and the optimal rate of fertilizer use is weak.They found that risk-averse farmers apply less fertilizer than risk-neutral farmers,contradicting the findings of previous studies.Non-monotonic relationships between risk aversion and fertilizer use have also been found in other studies (e.g.,Le Cottyet al.2018;Khoraet al.2018;Meyer-Aurichet al.2019;Haileet al.2020).
The previous studies have a couple of research gaps that need to be addressed.First,most of them focused on theoretical analyses.Second,the empirical analyses were based mainly on experimental data.They (for example,Paulson and Babcock 2010) relied on fertilizeruse data collected from farmers,but did not collect farmers’ real risk preferences.Instead,farmers’ risk preference data were obtained from a separate dataset.To the best of our knowledge,none of these empirical studies are based on data collected entirely from farmers.This study seeks to address these gaps.Specifically,we set up a theoretical model and analyzed whether the relationship between the degree of risk aversion and the amount of fertilizer used is monotonic.Then,we tested the theoretical result using empirical data.More importantly,in contrast to previous studies,we followed Tanakaet al.(2006) in measuring farmers’ risk preferences with field survey data,which produced more realistic measurement of risk preference and more robust results than those of previous studies.
The rest of this paper is organized as follows.In Section 2,we set up a theoretical framework from which the relationship between risk preference and fertilizer use is derived and a hypothesis is proposed.In Section 3,we present the data collection and empirical models.In Section 4,we first analyze the relationship between fertilizer use and risk preference using descriptive statistics.Then,we test the hypothesis proposed in Section 2 using econometric models and empirical data.The estimation results are then discussed.Section 5 concludes the paper.
2.Theoretical model
Let us assume that a farmer applies an amount of fertilizer,Q,to generate output,x.For simplicity’s sake,the popular Cobb–Douglas production function,x=f(Q)=A×QB,was used in this study.The output elasticity B captures the impact of fertilizer use on output;the higher the value of B,the more important fertilizer is.The coefficient A incorporates the effect of all other inputs,such as seed and labor.As is often used in the literature,it was assumed thatA>0 and 0<B<1.Since agricultural production is risky,it was assumed that the probability of obtaining a positive effect from fertilizer use,or the event of realizingx,isp.
As long as farmers apply fertilizer,production cost is positive,which means the probability of production cost being incurred is 100%.For simplicity,a linear cost function was assumed:y=C(Q)=−c×Q.Here,cis the unit value (or price) of fertilizer applied,which was assumed to be greater than zero.Production cost,y,can be considered a negative benefit from farmers’ perspective.
Following Tanakaet al.(2006),1This utility function is based on cumulative prospect theory (Tversky and Kahneman 1992) and the one-parameter form of Prelec’s (1998)axiomatically derived weighting function.farmer’s utility function is the following:

U(x,p;y,q) is the utility function,andv(x) denotes a power value function.The curvature of the farmer’s value function is described byσ.For example,a farmer with highσis risk-taking,and a farmer with lowσis riskaverse.In other words,σmeasures the degree of a farmer’s risk aversion.The degree of a farmer’s loss aversion is represented byλ.A highλsignifies that an individual is more loss-averse,andvice versa(Tanakaet al.2006).The parameterαis used as a measure of probability weighting (Prelec 1998).According to Tanakaet al.(2006),α<1 indicates the weighting function is an inverted S shape,such that farmers overweigh events that have small probabilities and underweigh events that have large probabilities.Finally,pis the probability of eventxoccurring,whileqis the probability of eventyoccurring.
In this study,becausex>0>y,the expected utility function can be written as follows:

Sincew(q)=w(1)=1,U=w(p)·f(Q)σ–λ[–C(Q)]σ,in whichw(p)=exp[–(–Inp)α].Solving this equation (see Appendix A for details),we obtain the optimal level of fertilizer use:

As shown in Appendix B,the impact of a farmer’s risk preference on the optimal level of fertilizer use can be summarized as follows:

As discussed above,Bmeasures the importance of fertilizer in obtaining a certain output,andλindicates farmer’s loss aversion.A lowBand highλ(B≤λ) indicate that applying fertilizer is significant to a farmer;however,fertilizer is not important in production.Under this circumstance,risk-averse farmers (i.e.,farmers with lowσ)use less fertilizer than risk-neutral or risk-taking farmersIn other words,the relationship between fertilizer use and a farmer’s risk preference is positive:the more risk-taking a farmer is,the more fertilizer he or she will apply.
Similarly,a highBand lowλ(B>λ) indicate that applying fertilizer is insignificant to a farmer,but that fertilizer is important in production.Under this circumstance,we must consider the magnitude ofp,the probability of obtaining the desired effect from fertilizer use,to determine the relationship between a farmer’s risk preference and fertilizer use.If the probability of obtaining the desired effect from fertilizer use is highrisk-averse farmers apply more fertilizer to avoid potential yield loss than risk-taking farmers
However,if the probability of obtaining the desired effect from fertilizer use is lowrisk-averse farmers apply less fertilizer than risk-neutral or risk-taking farmers.Conversely,as above,ifBis high whileλis low(B>λ),fertilizer is important for agricultural production,but its application is insignificant to a farmer,making risk-averse farmers use more fertilizer than risk-neutral or risk-taking farmers,all else being equal.Hence,the relationship between a farmer’s risk preference and fertilizer use depends on the relevant magnitudes of the effect ofB>λand the effect ofIf the effect from the scenario that fertilizer application has a low probability in producing the desired outcome dominates,risk-averse farmers apply less fertilizer than risk-taking farmers
3.Data and methods
3.1.Data
Data used in this study were collected from the Center for Chinese Agricultural Policy of the Chinese Academy of Sciences in 2006.The field survey was conducted in the North China Plain (NCP),which has been the largest cotton production region in China since 2007(NBSC 2008).The sample covers eight important cottonproducing counties in four provinces (two counties in each province).The four provinces,Shandong,Henan,Hebei,and Anhui,are the second-,third-,fourth-,and sixth-largest cotton-producing provinces in China (NBSC 2007).2Xinjiang Uygur Autonomous Region is the largest cotton-producing region in China.However,because of the hot and dry climate,the cotton bollworm is not a serious problem in Xinjiang.The area under cotton cultivation in these four provinces accounted for 51% of the total area under cotton cultivation in 2006 in China (NBSC 2007).Two villages were randomly selected in each county.Approximately 20 households were randomly selected in each village.For each sampled household,all cotton plots were included in the survey.As each farmer typically has two or three cotton plots,the final sample included 306 households and 883 cotton plots (Table 1).
The household survey included a number of different sections.For example,one section covered basic information about the household,such as asset value,farm size,family size,and demographic information of each family member (gender,age,education,etc.).Another section sought information on cotton input and output by plot.All fertilizers applied to each cotton plot were recorded.To consider the impact of fertilizer quality,information regarding fertilizer expenditure was also collected.
After a face-to-face interview,each farmer was asked to participate in an experiment.The experiment is from Tanakaet al.(2006),and is similar to that of Holt and Laury (2002).In the experiment,a farmer was offered 35 pairwise choices of risky and safe options (28 pairs for gain preference,and 7 pairs for loss preference).Each pair contained a choice between two lotteries(with different payoffs and possibilities):A or B.For any farmer who switched at rowN,we concluded that he or she preferred lottery A over lottery B at rowN–1 and preferred lottery B over lottery A at rowN.From their switching points for each farmer,a set of inequalities was obtained.By solving these inequalities,a range for each of the three parameters (i.e.,σ,α,and λ) was obtained.Then the midpoints of the intervals were used as the point estimates.In order to encourage farmers to participate in the experiment and provide honest answers,all farmers were given real monetary rewards based on their choices.A detailed discussion of the experiment design and implementation is provided in Liu (2013).
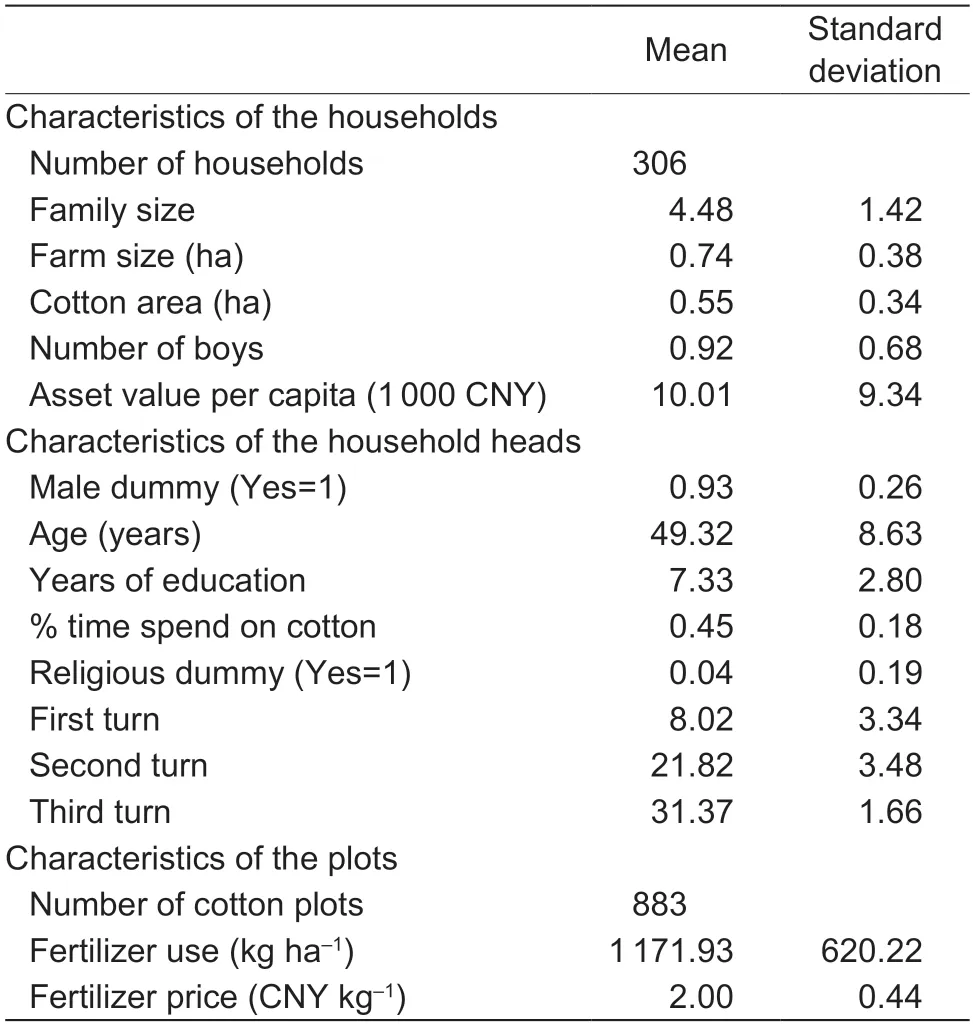
Table 1 Summary characteristics of farmers and plots
3.2.Empirical model
Empirical models were constructed to test the hypothesis shown in eq.(3).The optimal level of fertilizer application,as shown in eq.(2),iswhich is also the empirical model estimated in this section.In this model,c,σ,λ,andαare the variables defined above,whileA,B,andpare parameters to be estimated.
The sample cotton plots can be divided into two different groups according to their crop production system:monocropping or double cropping.As shown in Fig.1,most of the cotton plots sampled in Hebei and Shandong provinces (north of the NCP) belong to the monocropping group,while those in Henan and Anhui provinces (south of the NCP) belong to the double cropping group.In monocropping,farmers plant cotton in the spring (mid to late April) and harvest it in September and October.After harvesting,the land is left alone until cotton is planted again the next spring.However,in double cropping,farmers usually plant cotton in early summer,immediately after harvesting wheat in June,and then plant wheat in late autumn,immediately after harvesting cotton in October.
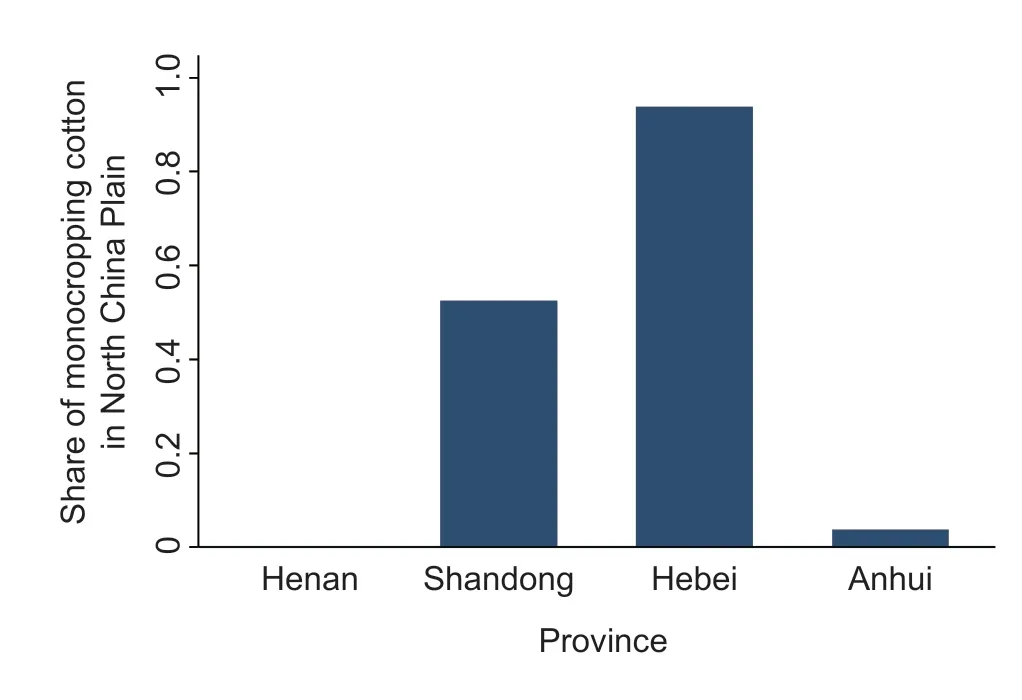
Fig.1 Share of monocropping cotton in North China Plain.
The production system has important implications for the probability of achieving the desired effect from fertilizer application.In both monocropping and double cropping,if a disaster occurs,the probability of achieving the desired effect from fertilizer application decreases.However,in double cropping,after harvesting cotton,farmers plant wheat in the same plot that continues to utilize fertilizer applied for cotton.In this sense,the probability of benefitting from fertilizer application is higher in double cropping than in monocropping.
Our data show that fertilizer use is consistently higher in double cropping than in monocropping.As shown in Fig.2-A,farmers in double cropping regions and monocropping regions have similar risk preferences.Average cotton yields of these regions are also similar (Fig.2-B).However,fertilizer use in double cropping regions seems significantly higher than that in monocropping regions (Fig.2-C).
To incorporate the effect of different crop production systems,the coefficientpis replaced by two coefficients:p1for monocropping andp2for double cropping.Similarly,the elasticityBis replaced by two elasticities:B1for monocropping andB2for double cropping.After making these changes,the empirical model is the following:

Ois a dummy variable for monocropping (1 for monocropping and 0 for double cropping),andTis a dummy variable for double cropping (1 for double cropping,and 0 for monocropping).The subscriptiindicates theith farmer andξis the error term.
Finally,because the risk-preference coefficients,σ,λ,andα,are endogenous,the results of ordinary least squares estimation might be biased.To solve this problem,we first estimated:

whereRiskis a farmer’s risk preference.The explanatory variables include three categories:characteristics of the household,characteristics of the individuals in the household,and the crop production system.Characteristics of the household (Household) are captured by the following variables:asset value per capita,family size,and the number of sons in the family.Characteristics of the individuals in the household(Individual) are measured by five variables;in addition to gender,age,and education,religion and the percentage of time spent in cultivating cotton are included according to Liu and Huang (2013).The double cropping system dummy variable (T) is included to incorporate the impact of the natural environment.Finally,εis the error term.
4.Results
4.1.Descriptive results
Summary statistics for the sampled households are presented in Table 1.The average family size was 4.48 people,and the average farm size was 0.74 ha,similar to the national average (NBSC 2007).The area under cotton cultivation was 0.54 ha on average,or 74% of the average farm size,demonstrating that cotton was the major crop for the sampled households.The average asset value per capita was about 10 000 CNY.
Of the interviewees,93% were male.On average,a sampled farmer was about 50 years old and had completed 7 years of education.Because cotton was the major crop,farmers spent nearly half of their on-farm time on cotton production.Only 4% of the farmers believed in a religion.
On average,farmers applied 1 172 kg fertilizer per ha.At an average fertilizer price of 2 CNY kg–1,the expenditure on fertilizer was approximately 2 344 CNY ha–1(or 375 USD ha–1).The rate of fertilizer use shown in this study is similar to that in other studies (e.g.,Fan 2005;Zhang and Zhao 2007).
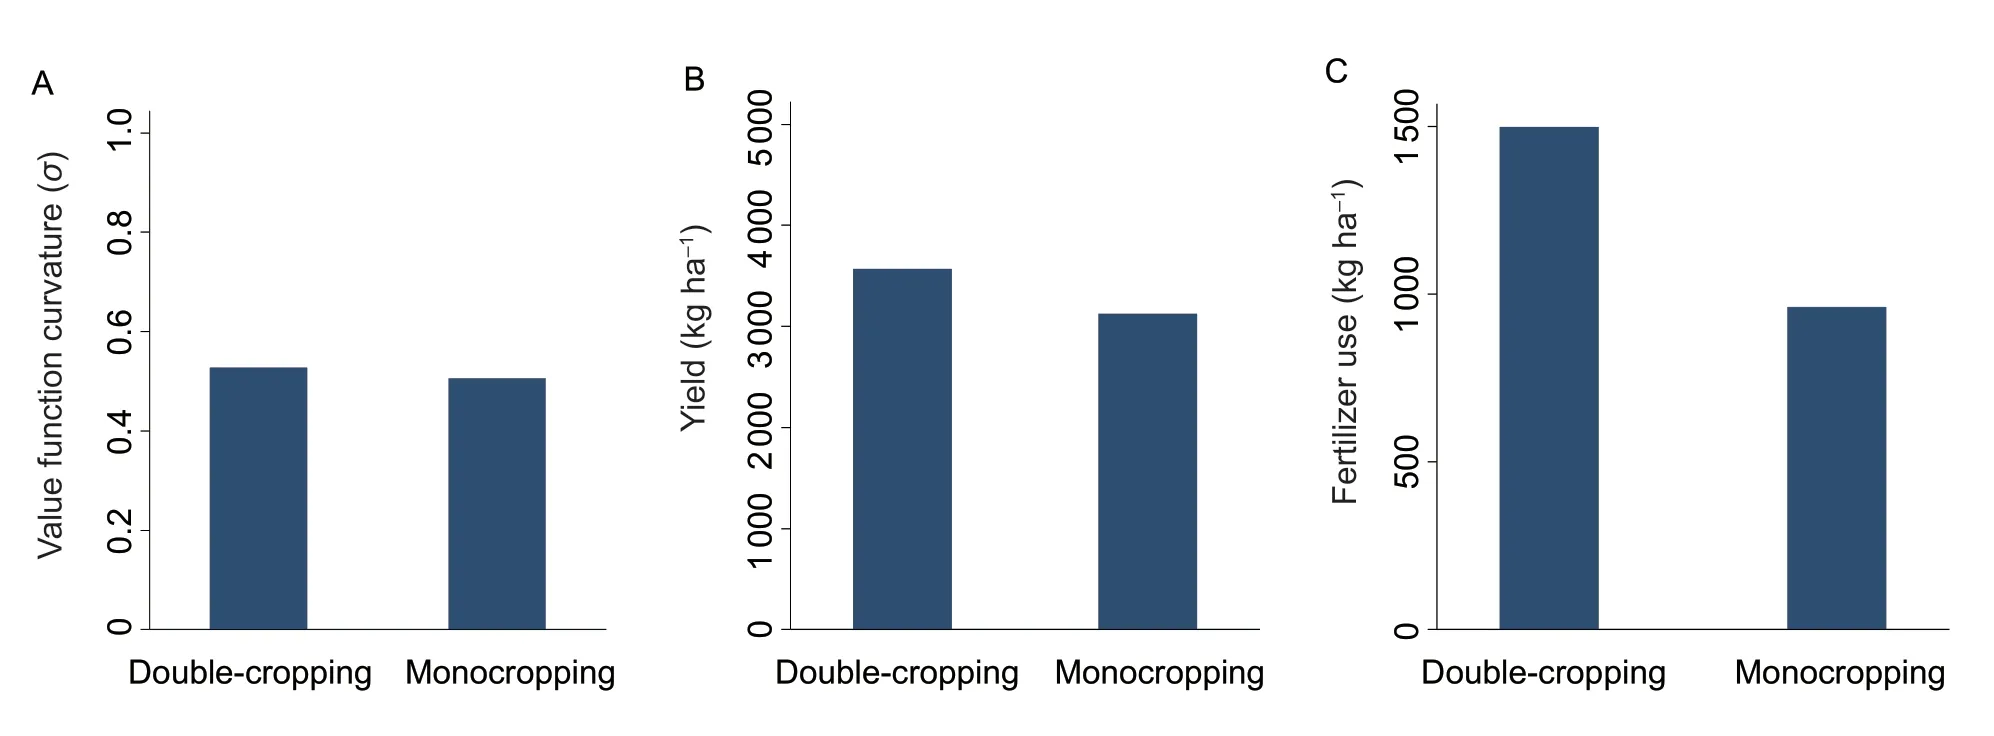
Fig.2 Farmers’ risk aversion (A),cotton yield (B),and fertilizer use (C) in double cropping and monocropping regions.
Distributions of the risk-aversion coefficient (σ) and the loss-aversion coefficient (λ) with kernel density estimates are shown in Fig.3.Bothσandλwere nearly normally distributed,suggesting their representativeness.With an averageλof 3.10 and an averageσof 0.52,the survey data indicate that the farmers sampled were risk averse.The averageαwas 0.69,which means that most of the farmers tended to overweigh low probabilities (i.e.,the best years when yields were very high and the worst years when yields were very low).This is a common phenomenon,and similar results have been found in other studies (e.g.,Tanakaet al.2006).
However,there was no clear monotonic relationship identified between farmers’ risk preferences and the quantity of fertilizer use.As shown in Fig.4,the negative relationship between fertilizer use andλwas moderate,while the linear relationship between fertilizer use andσwas almost flat.This finding contradicts the results of previous studies.Why is the linear relationship between fertilizer use and risk preference not significant?Should the relationship be monotonic? In the following section,a theoretical model is proposed for analyzing the relationship.
4.2.Estimation results of empirical models
The estimation results of the impact of farmers’ risk preferences on fertilizer use are shown in Tables 2 and 3.3The estimation results of the determinants of farmers’ risk preference are not shown for simplicity.As shown in Table 2,all the estimated coefficients have the expected signs and are statistically significant.For example,in the second row of Table 2,the estimation results of eq.(2) show that the output elasticity of fertilizer use is 0.1744 and statistically significant,which is consistent with previous studies (e.g.,Fan 2005;Zhang and Zhao 2007).
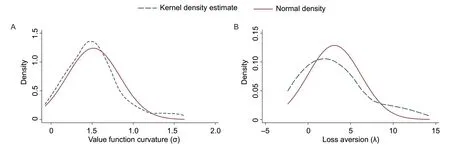
Fig.3 A normal kernel density estimate for farmers’ risk preference.

Table 2 Impact of uncertainty on optimal fertilizer use in China

Table 3 Impact of uncertainty on optimal fertilizer use in China after considering the effect of the crop production system
To consider the effect of crop production system,we estimated eq.(5),which assumes different output elasticities and probabilities of achieving the desired effect from fertilizer use.The estimation results are shown in Table 3 (columns 1 and 2).Similar to Table 2,all the estimation coefficients have the expected signs and are statistically significant.The estimation results show that although the output elasticities of the two crop production systems are similar (rows 2 and 4),the probabilities of achieving the desired effect from fertilizer application differ significantly (rows 3 and 5).To test the robustness of the estimation results,eq.(5) was re-estimated by assuming endogenous risk preference (σ,λ,andα).As shown in columns 3 and 4,endogenous risk preference did not change the results significantly,suggesting robustness of the estimation results.
5.Discussion
The results are consistent with our expectations.As discussed above,in contrast to monocropping,double cropping enables fertilizer applied for previous season’s cotton crop to contribute to next season’s wheat crop even if a disaster negatively affects cotton yield.As a result,the probability of achieving the desired effect from fertilizer application is higher for a farmer who practices double cropping than for one who practices monocropping.Therefore,risk-averse farmers might apply more fertilizer than risk-neutral or risk-taking farmers.
As shown in eq.(3),the probability of achieving the desired effect from fertilizer application is critical to the relationship between a farmer’s risk preference and his or her fertilizer use.The theoretical analysis shows that if the probability is high (as it is in double cropping) and the importance of fertilizer is greater than a farmer’s loss aversion (B>λ),risk-averse farmers may apply more fertilizer than risk-neutral or risk-averse farmers.However,if the probability of achieving the desired effect from fertilizer use is low or the importance of fertilizer use is less than a farmer’s loss aversion,risk-averse farmers apply less fertilizer than risk-neutral or risk-averse farmers.
To test this hypothesis empirically,the relationship between risk aversion and fertilizer use was simulated based on the estimated coefficients shown in Table 3.As shown in Fig.5,if the output elasticity is higher than the loss aversion coefficient (i.e.,B>λ),the different probabilities of achieving the desired effect from fertilizer use yield different monotonic relationships between risk aversion and fertilizer application.If the probability is low,the amount of fertilizer applied increases asσincreases.In other words,risk-averse farmers (farmers with lowσ)apply less fertilizer to their fields than risk-neutral or risktaking farmers.However,if the probability of achieving the desired effect from fertilizer use is high,risk-averse farmers apply more fertilizer than risk-taking farmers.In other words,the simulation results support our hypothesis in Section 2.
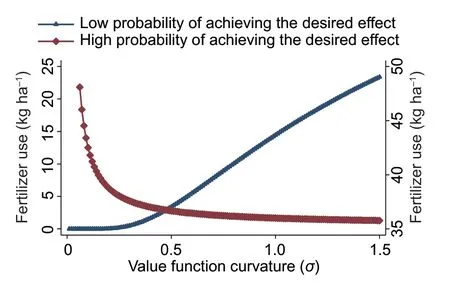
Fig.5 Simulated relationship between fertilizer use and risk aversion (σ) under different scenarios.
The estimation results of this study have important implications for China and other developing countries.Due to the improvement of agriculture infrastructure and implementation of high-standard basic farmland construction programs in China,risk-averse farmers use more fertilizer than risk-taking farmers.To fulfill the zero-growth action plan regulating fertilizer and pesticide use (Zhanget al.2006;Qiaoet al.2015),the Chinese government should continuously encourage risk-averse small farmers to rent out their farmland to risk-neutral or risk-taking large-scale farmers.However,in other developing countries with poor agricultural infrastructure,the probability of yield loss caused by natural disasters is relatively large.Under these circumstances,risk-averse small farmers use less fertilizer than other farmers,resulting in a negative impact on yield and agriculture development (Morriset al.2007).Hence,policy makers in these countries might need to increase agriculture infrastructure investment so that farmers may apply more fertilizer to improve productivity.
This study has a few limitations.First,due to data availability,this study used the crop production system(i.e.,monocropping and double cropping) to measure the probability of achieving the desired effect of fertilizer use.This study could be improved with data regarding agriculture infrastructure and yield loss caused by natural disasters.Second,data used in this study were collected in the major cotton production regions in the NCP.Studies based on data collected in other regions with different cropping systems will contribute to the robustness of the results of this study.
6.Conclusion
This study demonstrates,both theoretically and empirically,that the relationship between a farmer’s risk preference and his or her fertilizer use is not always monotonic.Under some circumstances,as the degree of risk aversion increases (from risk taking to risk neutral to risk averse),the amount of fertilizer applied increases for some farmers,since risk-averse farmers worry that they might experience yield loss if they apply less fertilizer.The positive relationship between the degree of risk aversion and fertilizer use is empirically evident.However,the relationship between the degree of risk aversion and fertilizer use is sometimes negative.This study showed that if the probability of achieving the desired effect from fertilizer application is low,risk-taking farmers apply more fertilizer to their fields than risk-averse farmers.In other words,the degree of risk aversion can have a negative impact on the amount of fertilizer applied.This finding contradicts that of most previous studies.
Acknowledgements
The authors acknowledge the financial support from the National Natural Sciences Foundation of China(71773150,71273290,and 71934003).
Declaration of competing interest
The authors declare that they have no conflict of interest.
Appendicesassociated with this paper are available on http://www.ChinaAgriSci.com/V2/En/appendix.htm
杂志排行
Journal of Integrative Agriculture的其它文章
- Monilinia fructicola on loquat:An old pathogen invading a new host
- Mechanization and efficiency in rice production in China
- Simple method for extracting the seasonal signals of photochemical reflectance index and normalized difference vegetation indexmeasured using a spectral reflectance sensor
- Winter wheat yield estimation based on assimilated Sentinel-2 images with the CERES-Wheat model
- Monthly composites from Sentinel-1 and Sentinel-2 images for regional major crop mapping with Google Earth Engine
- Response of carbon footprint to plastic film mulch application in spring maize production and mitigation strategy
