Study on the structure characterization and moisturizing effect of Tremella polysaccharide fermented from GCMCC5.39
2021-05-24MengYngZilongZhngYnHeChenglingLiJinmeiWngXi
Meng Yng, Zilong Zhng, Yn He, Chengling Li, Jinmei Wng*, Xi M,*
a School of Perfume and Aroma Technology, Shanghai Institute of Technology, Shanghai 201418, China
b Shanghai International Travel Healthcare Center, Shanghai Customs District P.R.China, Shanghai 200335, China
c Laibo Pharmaceutical Technology (Shanghai) Co.Ltd, Shanghai 201418, China
d National R & D Center for Edible Fungus Processing Technology, Henan University, Kaifeng 475004, China
Keywords:Polysaccharide Tremella spp.Structure identifi cation Moisturizing
ABSTRACT The structure and moisture retention of Tremella polysaccharide fermented from GCMCC5.39 (FTP) were evaluated.After UV, infrared spectrum analysis, HPAEC-PAD, HPSEC and 1 D NMR analysis, the composition of the purifi ed FTP was determined.Purifi ed components of fermented Tremella polysaccharide (FTPS) was made of galactose, mannose, glucose, galactosmine, glucosamine, and contain a large amount of hydroxyl, carbonyl and amino groups.FTPS was α-neutral pyranose without uronic acid.FTPS-1 and FTPS-2 were obtained after purifi cation by DEAE-Sepharose Fast Flow Column.The molecular weights of FTPS-1 and FTPS-2 were 25 722 and 177 263 Da.FTPS-2 had a better ability to prevent moisture loss, and the optimal moisture retention period was 0-4 h.FTPS-2 could signifi cantly increase the moisture content of the skin epidermis and showed a dose-concentration relationship.The effect of FTPS-2 on the expression of different moisturizing genes was evaluated in a human skin keratinocyte model.The results showed that FTPS-2 has no cytotoxicity, and could signifi cantly promote AQP3, TGM1, CASP14, HYAL2, FLG gene expression level in HaCaT cells.It has the most signifi cant infl uence at HYAL2 protein expression on 50 μg/mL.
1.Introduction
When normal skin is dehydrated, it will directly lead to metabolic disorders, and metabolic waste cannot be smoothly discharged.In addition, the lubricating effect between skin cells is reduced, the intermolecular and intercellular forces are enhanced, and macromolecular cross-linking reactions should take place, which may lead to irreversible skin hardening.Also, the skin dehydration can even cause keratinocyte adhesion, forming scales on the skin surface [1].In other words, the water content of the stratum corneum determines the softness of the skin and the communication of matter inside and outside the cell.Therefore, the moisture content of the skin is related to the skin health.Further, a safe and highly effective moisturizer is the demand and concern of market.Among all kinds of moisturizing ingredients, macromolecule biochemical humectant has the most effi cient moisturizing effect.Collagen [2], for example, tightens the skin and keeps the stratum corneum hydrated, but cannot be absorbed easily by the skin.Hyaluronic acid [3]has strong water absorption, can be attached to keratinocytes, extend the moisturizing effect of the moisturizing agent, but must be used together with polyol to achieve the moisturizing effect.Mucosaccharides also called glycosaminoglycan, such as chondroitin sulfate [4], hyaluronic acid, chitin equal, can strengthen the skin fibrous tissue metabolism.Aquaporin (AQP) [5], silk fibroin (FLG) [6,7], non-apoptotic cysteine-aspartic protease (CASP) [8], transglutaminase (TGM) [9], and hyaluronic acid-related enzyme (HAS, HYAL) [10]play important roles in the process of achieving the moisturizing effect of the above humectant.
Fungal polysaccharides are natural biological macromolecules, which are chain polymers formed by glycoside bonds connecting monosaccharides.Many researches are mentioned that the fungal polysaccharides such asPoria cocospolysaccharide [11],Velutipesmushroom polysaccharide [12]and lentinan [13]have excellent moisturizing effect.The presence of a large number of hydrophilic hydroxyl groups makes fungal polysaccharides have strong hydroscopicity, emulsification, high viscosity and good film-forming property [14].In addition, fungal polysaccharides are non-cytotoxic and can be used as a health food orally or as an excellent cosmetic ingredient [15].Polysaccharide from edible fungusTremella(TP) is a kind of mannitan formed byα-(1,3) glycosidic bond andβ-(1,4) glycosidic bond [16].It contains a lot of hydroxyl and uronic acid and has good antioxidant and moisturizing properties.It is a kind of skin-care component that attracts much attention.Some studies have shown that polysaccharides from fermentedTremella fuciformis(FTPS) and TP have similar hypoglycemic [17], antioxidant [18]and immune activities [19].However, there is a lack of research on the structure and moisture retention of FTPS.Therefore, a FTPS will be prepared and purified in this paper, and the purified components will be preliminarily identified for structure and evaluated moisture retention.
2.Materials and methods
2.1 Materials and reagents
Fetal bovine serum (FBS) and Dulbecco’s modified Eagle’s medium (DMEM) were purchased from Gibco (Shanghai, China).
Dextrans and monosaccharide standards, namely,D-Gal,D-Glc,D-Ara,L-Fuc,L-Rha,D-Fru,D-Man,D-Xyl,D-GlcA, andD-GalA, were from Sigma Aldrich (USA).DEAE-Sepharose Fast Flow was purchased from General Electric Company (USA).Other reagents were from Chinese sources and were of analytical grade.
2.2 General methods
Total content of polysaccharides was determined by phenol sulfuric acid method [20].The concentration of proteins was measured according to method of Bradford [21].
2.3 Preparation and purification of Tremella polysaccharide
The fungus (Tremella fuciformisBerk, GCMCC 5.39) was inoculated into the medium (glucose 5%, yeast extract 0.2%, peptone 0.5%, MgSO4·7H2O 0.05%, KH2PO40.046%, K2HPO40.1%), and the fermentation broth was obtained after 6 days of shake flask fermentation (25 °C, 250 r/min).
One hundred milliliter fermentation broth was frozen at -20 °C and then bathed in water at 90 °C for 2 h.After 4 repetitions, the broth was centrifuged at 8 000 r/min for 10 min.The volume of the supernatant was reduced to about 1/3 of the original volume for later use.K2CO3and ethanol were configured in a two-water phase system, in which the ratio of K2CO3and ethanol was 1:1 (m/m).The concentrated supernatant was mixed with the two-water phase system at a ratio of 3:2 (V/V), and the mixture was shaken vigorously until the potassium carbonate was completely dissolved.The solution was left to be stratified, and the FTPS was obtained by freeze-drying after collecting the lower phase dialysis (14 000 Da, 3 days, 4 °C).
2.4 Purification of fermented Tremella polysaccharide (FTP)
FTP (100 mg, 10 mg/mL) was first eluted with water and then with a NaCl gradient (0.2, 0.4, 0.6, 0.8, 1.0 mol/L).Three purified components of fermentedTremellapolysaccharide (FTPS-1, FTPS-2, FTPS-3) were separated on a DEAE-Sepharose Fast Flow column (2.6 cm × 30 cm).Carbohydrate content in three polysaccharide peaks was detected by phenol sulfuric acid reaction.The three polysaccharide peaks were collected separately, and purified polysaccharide fractions were obtained after dialysis, concentration and lyophilization.
2.5 Characterization of FTPS
2.5.1 Ultraviolet spectral scanning (UV) spectroscopy
FTPS aqueous solution (0.5 mg/mL) was filtered in a 0.22 μL filter and scanned at 1100-190 nm for UV spectrometry (CE7250 ultraviolet spectrophotometer, Bioaquarius, British).
2.5.2 Fourier transform infrared (FT-IR)
FT-IR spectroscopy of FTPS mixed with dry KBr was performed in the 4000 cm-1to 400 cm-1region (Nexus Euro 470, NICOLET, The United States).
2.5.3 Determination of purity and molecular weight
High-performance size exclusion chromatography (HPSEC) was used to detect the molecular weight distribution of polysaccharides [22].Dextran with different molecular weights are used as standard products, and the weight average molecular weights (Mw) are 2 500, 21 400, 133 800, and 2 000 000 Da, respectively.Waters Ultrahydrogel TM Linear (7.8 × 300 mm, 10 μm) gel column, 2 columns in series; detector: Waters 2410 refractive index detector and UV detector; mobile phase: 0.1 mol/L NaNO3; flow rate:0.9 mL/min; column temperature: 45 °C; loading volume: 20 μL.The polysaccharide sample was prepared as a 0.2 mg/mL solution and applied to a 0.22 μm filter for analysis.The weight-average molecular weight of the sample was calculated by the regression equation based on the retention time (TR).
2.5.4 Determination of monosaccharide composition
High-performance anion-exchange pulsed amperometric detection chromatography (HPAEC-PAD) [23]was performed to determine the monosaccharide composition and molar ratio of FTPS-1 and FTPS-2.
Sample hydrolysis: configure the polysaccharide sample into a 5 mg/mL solution, pipette 100 μL into a 3 mL hydrolysis bottle, add 100 μL of 4 mol/L trifluoroacetic acid (TFA), fill with N2, dry at 110 °C for 2 h.After the hydrolysis bottle was cooled to room temperature, 200 μL methanol was added to mix fully with the residue in the bottle, and then N2was filled into the bottle until there was no methanol residue.Repeat the addition of methanol and blow with N2for 3 to 4 times until no TFA is present.Dissolve the residue to volume to 5 mL, dilute it with a 0.45 μm microporous membrane, and use high efficiency.Determination of monosaccharide composition by ion chromatography (Waters 600 liquid chromatograph, Waters, US).
Chromatographic conditions: Dionex ICS5000 system was used for injection analysis.Column: CarboPac PA20 (ID 3 × 150 mm); mobile phase: A, H2O; B, 250 mmol/L NaOH; C, 1 mol/L NaAc, ternary gradient elution; flow rate: 0.5 mL/min; pulsed amperometric detector (PAD), Au working electrode, Ag/AgCl reference electrode; injection volume: 20 μL; column temperature: 30 °C.
2.5.5 NMR analysis
FTPS-2 (30 mg) was dissolved in 0.5 mL of heavy water (D2O), lyophilized repeatedly three times, and analyzed on a 600 MHz nuclear magnetic resonance instrument [24].Using the saturated 3-trimethyl silane prestane sulfonate as external standard,1H NMR and13C NMR were recorded by the AVANGE spectrometer (Bruker, Rheinstetten, Germany) at 70 °C.
2.6 Moisturizing analysis
2.6.1 Dryer moisture absorption experiment
Take 1 mL FTPS-1 and FTPS-2 solutions of 1 mg/mL and add them to the EP tube.EP tube exposure was placed into the dryer with ambient humidity of 43%, and each EP tube was kept in a plane to measure its quality change within 12 h.Glycerol (glycerol: water = 1:3) was used as the positive control and solvent as the blank control to determine the water loss rate of the sample.The lower the water loss rate, the better the ability of the sample to prevent water loss.

whereM1represents the mass (g) of sample before placing,M2represents the mass (g) of lost water.
2.6.2 Skin moisture content test
Sample preparation: configure FTPS-2 to polysaccharide solutions of 1.0, 1.5, 2.0, 2.5 g/L, each with 10 mL.Glycerin was used as the positive control and water as the blank control.
Volunteer requirements: the volunteer aged between 16 and 30 years old were required to have water content base value between 15 and 45 in the test area of the forearm, and to wait for 30 min after cleaning the forearm.
Experimental environment: temperature (25 ± 1) °C, humidity (50 ± 5) %.
Methods: a total of 6 areas were marked on the inside of the forearm of the volunteers, each of which was 3 cm × 3 cm in size and spaced 1 cm apart.Smear 500 μL samples in each area, and measure the skin moisture content (CM825, CK) in the test area at 0, 1, 2 and 4 h after the application, respectively.Repeat the measurement for 3 times in each area and take the average value.The results were expressed by the set relative moisture measurement value (MMV) [24].The higher the relative MMV was, the more obvious the hydration effect of the sample was.
The calculation formula of the relative change rate of water content (MMV) is as follows:

whereT0is the change of skin moisture content in blank control at each time point;Tnis the change of skin moisture content of the sample at each time point.
2.6.3 Determination of moisture retention in HaCaT cells
2.6.3.1 Cell culture
HaCaT cells were cultured in DMEM supplemented with 10% FBS and 1% antibiotics at 37 °C under 5% CO2.For experiments, all cells were trypsinized.
2.6.3.2 Cell viability assay
HaCaT cells were seeded onto 96-well plates at a density of 5.0 × 10⁵cells/mL in culture medium.After preincubation, FTPS-2 (0-200 μmol/L) was added to cells, followed by incubation for 24 h.Cell viability was determined using a conventional MTT assay.
2.6.3.3 Quantitative real-time PCR (qRT-PCR)
RNA extraction: RNA was extracted from HaCaT cells according to the instructions of TRIzol kit, and the RNA quality was evaluated according to theOD260nm/OD280nmratio, which was between 1.8 and 2.0 to meet the experimental requirements.The RNA was stored in the refrigerator at -80 °C for later use.
Quantitative PCR of genes to be tested: primer sequence of genes to be tested (5’→3’) is shown in Table 1.The amplification reaction system is as follows: SYBR Green I dye of 10 comforter, primerof 1 μL, dNTP of 1 μL,Taqpolymerase of 2 μL, HaCaT cDNA of 5 μL, ddH2O 30 μL is supplemented by the above system, and the total reaction system is 50 μL.The PCR reaction solution was placed on the RT-PCR instrument (ABI7500 fast, Applied Biosystems, Inc) for PCR amplification.The reaction conditions is: pre-denaturation at 93 °C for 2 min, then 40 cycles were performed under the working conditions of 93 °C for 1 min, 55 °C for 1 min and 72 °C for 1 min.Finally, fluorescence was extended at 72 °C for 7 min and collected at 60-95 °C.The relative expression of the gene was calculated by 2-△△CT.

Table 1 Gene primer sequence.
2.6.3.4 Immunofluorescence (IF)
HaCaT cells were incubated in a phosphate buffer containing 1% bovine serum albumin for 30 min.100 μL primary antibody (HYAL2) was added to the medium and incubated at room temperature for 1 h.After washing with phosphate buffer for 3 times, add 100 μL secondary antibody (Alexa Flour 488 Donkey anti rabbit IgG) to the medium and incubate it at room temperature and away from light for 1 h.After washing with phosphate buffer solution (PBS) for 3 times, 5 μg/mL DAPI stained the core and incubated it at room temperature for 1 min.Then rinsed with PBS twice and ultra-pure water once.Photomicrographs were obtained by observation under a fluorescence microscope (DM500, Leica) and compared with HaCaT cells incubated without primary antibody.
The antibody information is listed below.
Primary antibody: HYAL2 (CatNo.15115-1-ap, Proteintech); dilution ratio is 1:100; overnight incubation;
Secondary antibody: Alexa Flour 488 Donkey anti rabbit IgG (CatNo.711-545-152, Jackson); dilution ratio is 1:100.
2.7 Statistical analysis
The data obtained were expressed as mean ± SD of three determinations and were analyzed statistically by ANOVA.The significance of any differences between groups was evaluated using thet-test.ThePvalue < 0.05 was regarded as statistically significant.All computations were performed using statistical software.
3.Results
3.1 Extraction, isolation and purification of crude polysaccharides
The freeze-thaw combined two-phase extraction of fermentedTremella fuciformiscrude polysaccharides (FTPS), the total sugar content measured after lyophilization was 42.6%.The DEAESepharose Fast Flow column was used to separate FTPS.The eluted peaks of three pure polysaccharides, FTPS-1, FTPS-2, and FTPS-3, was shown in Fig.1.FTPS-1, FTPS-2 and FTPS-3 accounted for 27.9%, 30.7% and 10.5% of FTP respectively.Their total sugar contents were 70.6%, 82.2% and 62.04%, and protein contents were 3.5%, 4.1% and 2.7%, respectively.After UV scanning, there were no absorption peaks at 260 nm and 280 nm, indicating that FTPS-1, FTPS-2, and FTPS-3 contained almost no uronic acid and proteins.FTPS-1 and FTPS-2 were the main polysaccharide components of FTP, so their characterization and moisture retention were further compared.
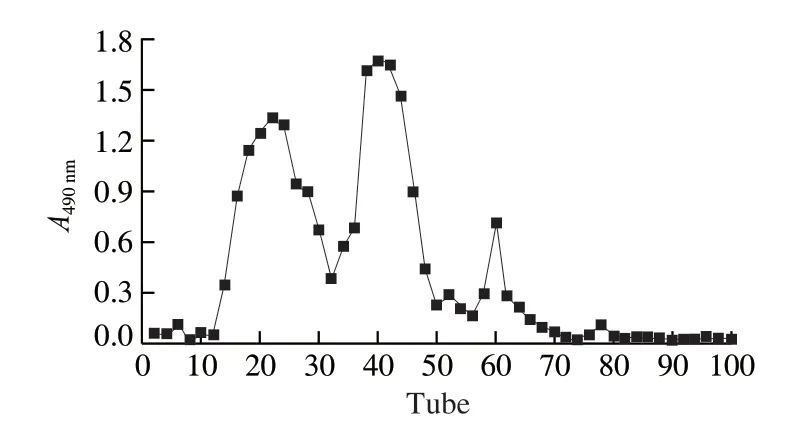
Fig.1 DEAE-Sepharose Fast Flow ion exchange chromatography elution curve for FTPS.
3.2 Molecular weight analysis
The molecular weights of FTPS-1 and FTPS-2 were measured.According to HPSEC results (Table 2), FTPS-1 and FTPS-2 presented one main peaks with the Mw of 25 733 Da (peak area: 100.00%) and 177 263 Da (peak area: 100.00%), respectively.This indicates that the protein content in FTPS-1 and FTPS-2 had little influence on the molecular weight distribution.The multiple dispersion coefficient (Mw/Mn) were 1.18 and 1.52, indicating that the molecular weight distribution of FTPS-1 and FTPS-2 is uniform, and the results can be mutually verified with the parameter.

Table 2 Molecular weight of FTPS-1 and FTPS-2.
3.3 Analysis of monosaccharide composition

Fig.2 Spectrum of HPAEC-PAD.(a) Peak time of 12 standard monosaccharides (1.L-Fucose; 2.Galactosamine; 3.L-Rhamnose; 4.D-Arabinose; 5.Glucosamine; 6. D-Galactose; 7.D-Glucose; 8.D-Xylose; 9.D-Mannose; 10.D-Fructose; 11.Ribose; 12.D-GalA); (b) Peak time of FTPS-1 and FTPS-2.
Analysis of the monosaccharide composition by HPAEC-PAD (Fig.2) showed that the monosaccharide composition of FTPS-1 and FTPS-2 was consistent, but the monosaccharide ratio was slightly different (Table 3).Specifically, FTPS-1 had higher levels of mannose and amino groups, and FTPS-2 had higher levels of galactose and glucose.According to Fig.1, FTPS-1 was a neutral polysaccharide because FTPS-1 was eluted earlier by distilled water.FTPS-2 was eluted by 0.2 mol/L NaCl, and contained more amino and no uronic acid.Therefore, FTPS-2 was weakly acidic polysaccharide.
3.4 Analysis of FT-IR spectra
The FT-IR spectra of FTPS-1 and FTPS-2 are similar (Fig.3).At 3 400 cm-1, it is shown that a strong broadband is assigned to O—H tensile vibration, and the band 2 930cm-1is generated by C—H tensile vibration.The band at 1 730.0 cm-1indicates the presence of methyl ester groups, while the band at 1 650 cm-1indicates the presence of aminoacyl groups [26].The strong absorption peak between 1 500 cm-1and 1 700 cm-1is the characteristic absorption peak of polygalactose [27].Galactose has the presence of carbonyl and ether groups.The results of infrared spectrum and monosaccharide composition can confirm each other.The band near 1 384 cm-1is due to O—H bending vibration, and the bands at 1 306.6 cm-1and 1 250.6 cm-1are due to C—H bending vibration.The bands at 1 260 cm-1and 1 050.0 cm-1are tensile vibrations assigned to C—O—C and C—O—H.The characteristic absorption peak ofα-glycosidic bond is at 852 cm-1.An absorption peak at 792 cm-1indicates a mannose structure [28].
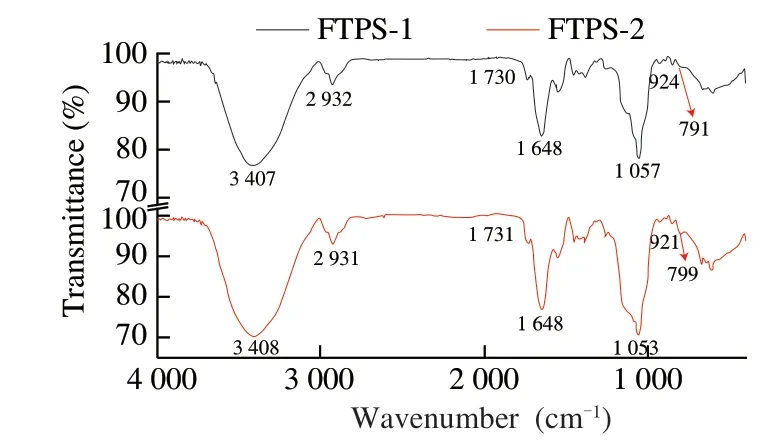
Fig.3 Analysis of FT-IR spectra.
3.5 NMR analysis
From the above results, it can be seen that FTPS-1 and FTPS-2 have similar sugar content, minimal monosaccharide composition (Fig.2) and the same glycosidic bond (Fig.3), so it is believed that FTPS-1 and FTPS-2 have similar structures.Therefore, according to the comparison of the moisturizing evaluation of FTPS-1 and FTPS-2, the FTPS-2 with better moisturizing effect was selected for NMR analysis to further characterize the structure and explore its moisturizing mechanism.
1H NMR (Fig.4) and13C NMR (Fig.5) were used to verify the glycoside bond configuration, monosaccharide composition and substituents distribution of FTPS-2.In the1H NMR spectrum, the heterotopic hydrogen proton signal appeared at σ4.9-5.2 ppm, indicating that the sample was pyranose.Another evidence for pyranosaccharides is that in the13C NMR spectrum (Fig.5), there is no signal peak at σ83-88 ppm, indicating that there is no furanose, and the signal peak of less than 80 proves that the sample is of pyranosaccharide type [29].
The chemical shift of the hydrogen on the methyl signal carbon in the1H NMR spectrum is between 1.1 and 1.3 ppm, and the chemical shift of the methyl signal carbon in the13C NMR is between 16 and 18 ppm, indicating that the terminal carbon contains methyl.In13C NMR, the methyl carbon signal ofO-acetyl group (O-Ac) is between 18 and 22 ppm, and the upper carbonyl signal ofO-Ac is between 170 and 180 ppm.In1H NMR, the hydrogen signal on the methyl group ofO-Ac ranged from 1.8 ppm to 2.2 ppm, indicating the presence ofO-Ac substituent in the sample.Although the hydrogen on the carbon is replaced by theO-Ac, the chemical shift of its hydrogen will move to the heterohydrogen region between 4.3 and 5.9 ppm in the lower field due to the substitution of theO-Ac, which leads to false impression.In addition, since the signal peak of terminal carbon is between 96 and 110 ppm, the acetyl group is non-reducing glucoside, not uronic acid.The signal peaks between 3.3 and 3.5 ppm were caused by the presence of oxymethyl groups, and the observation of signals at 61 ppm on the13C NMR spectrum confirmed this assumption.Due to the presence of acetyl group and methyl group, the chemical shift of1H is usually shifted downward by about 0.2-0.5 ppm.This is caused by the superconjugation effect of electrons [30].
In the1H NMR spectrum, 5.90-4.40 ppm end-matrix signals overlaps seriously, so it is difficult to distinguish the number of heterotopic protons.According to the13C NMR spectrum between 95-110 ppm signals, the sample sugar unit is composed of 9 sugar residues.According to the analysis of monosaccharide composition, the molar ratio of galactose, mannose and glucose is about 5:3:1.The wide signal at 3.50-4.00 ppm is due to the presence of galactose residues15, therefore, the multiple signal peaks at 5.05-5.18 ppm areD-gala (galactoside), and 4.53 ppm are the characteristic peaks of mannitol.Due to the chemical shift of protons toward the lower field, the absorption peak is the bimodal peak at 4.93 ppm, and the signal peak around 5.02 ppm is allocated to glucose [31].
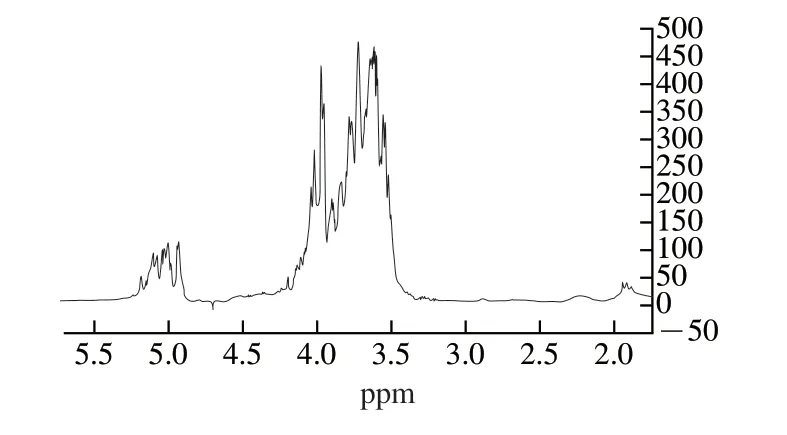
Fig.4 1 H NMR spectra of FTPS-2.
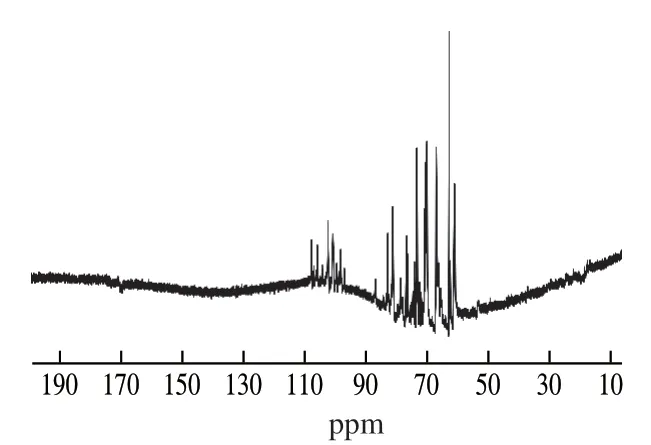
Fig.5 13C NMR spectra of FTPS-2.
3.6 Moisturizing activity
3.6.1 Moisture absorption in dry environment
With glycerin as the positive control and water as the blank control, the water locking ability of FTPS-1 and FTPS-2 was compared in the constant temperature desiccator (Fig.6).Within 0-4 h, FTPS-1 and FTPS-2 of 1 mg/mL showed better water-locking ability than glycerin, among which, the water-locking effect of FTPS-2 was significantly higher than that of FTPS-1.Therefore, the moisture retention capacity and mechanism of FTPS-2 were further studied below.
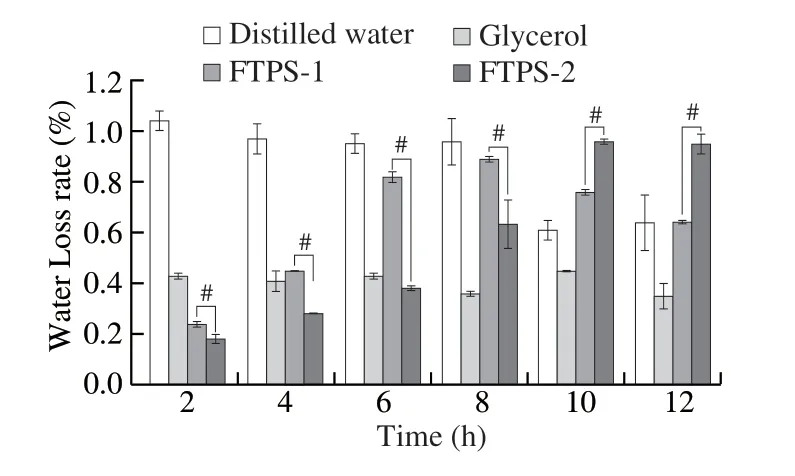
Fig.6 Compared of the ability of FTPS-1 and FTPS-2 to reduce water loss.Each column shows the mean ± SD of triplicate determinations.Significance of FTPS-1 and FTPS-2 was determined using independent sample t-test (#P < 0.05).
3.6.2 Epidermal moisture content determination
The moisturizing ability of FTPS-2 was tested on human skin (Fig.7), and the results showed that after deducting the influence of solvent on skin moisture content, MMV intuitively showed the influence of FTPS-2 on skin moisture content.The higher the MMV value was, the better the effect of improving skin moisture content of the sample was.When FTPS-2 applied on human skin with different concentrations (Fig.7), the skin surface moisture content could be increased to different degrees within 0-4 h, and the doseeffect relationship was presented.When the concentration of FTPS-2 exceeded 2.0 g/L, a certain degree of moisturizing effect was still shown after 4 h.When the concentration of FTPS-2 exceeded 2.5 g/L, its long-term hydration capacity exceeded glycerin.
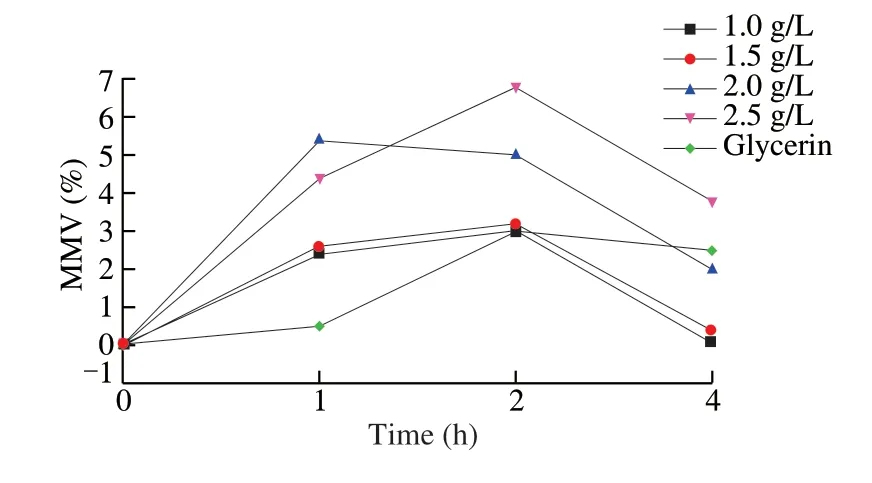
Fig.7 Effects of FTPS-2 on skin moisture content within 0-4 h.
3.6.3 Hydration in HaCaT cells
Immortalized human keratinocytes (HaCaT) were used to evaluate the moisturizing effect of FTPS-2.HaCaT cells (5 × 10⁵cells/mL) were incubated with FTPS-2 (0.625, 1.25, 2.5, 5, 10, 20, 50, 100 and 200 μg/mL) for 48 h.Significance was determined using Student’st-test versus the control group (P> 0.05).The inhibitory effect of FTPS-2 at different levels on HaCaT cells was not significantly different, the average inhibitory rate was 18.03%, and the maximum inhibitory rate was (21.38 ± 5.68)% at 12.5 μg/mL (Fig.8a).Above, FTPS-2 showed little cytotoxicity to HaCaT cells.
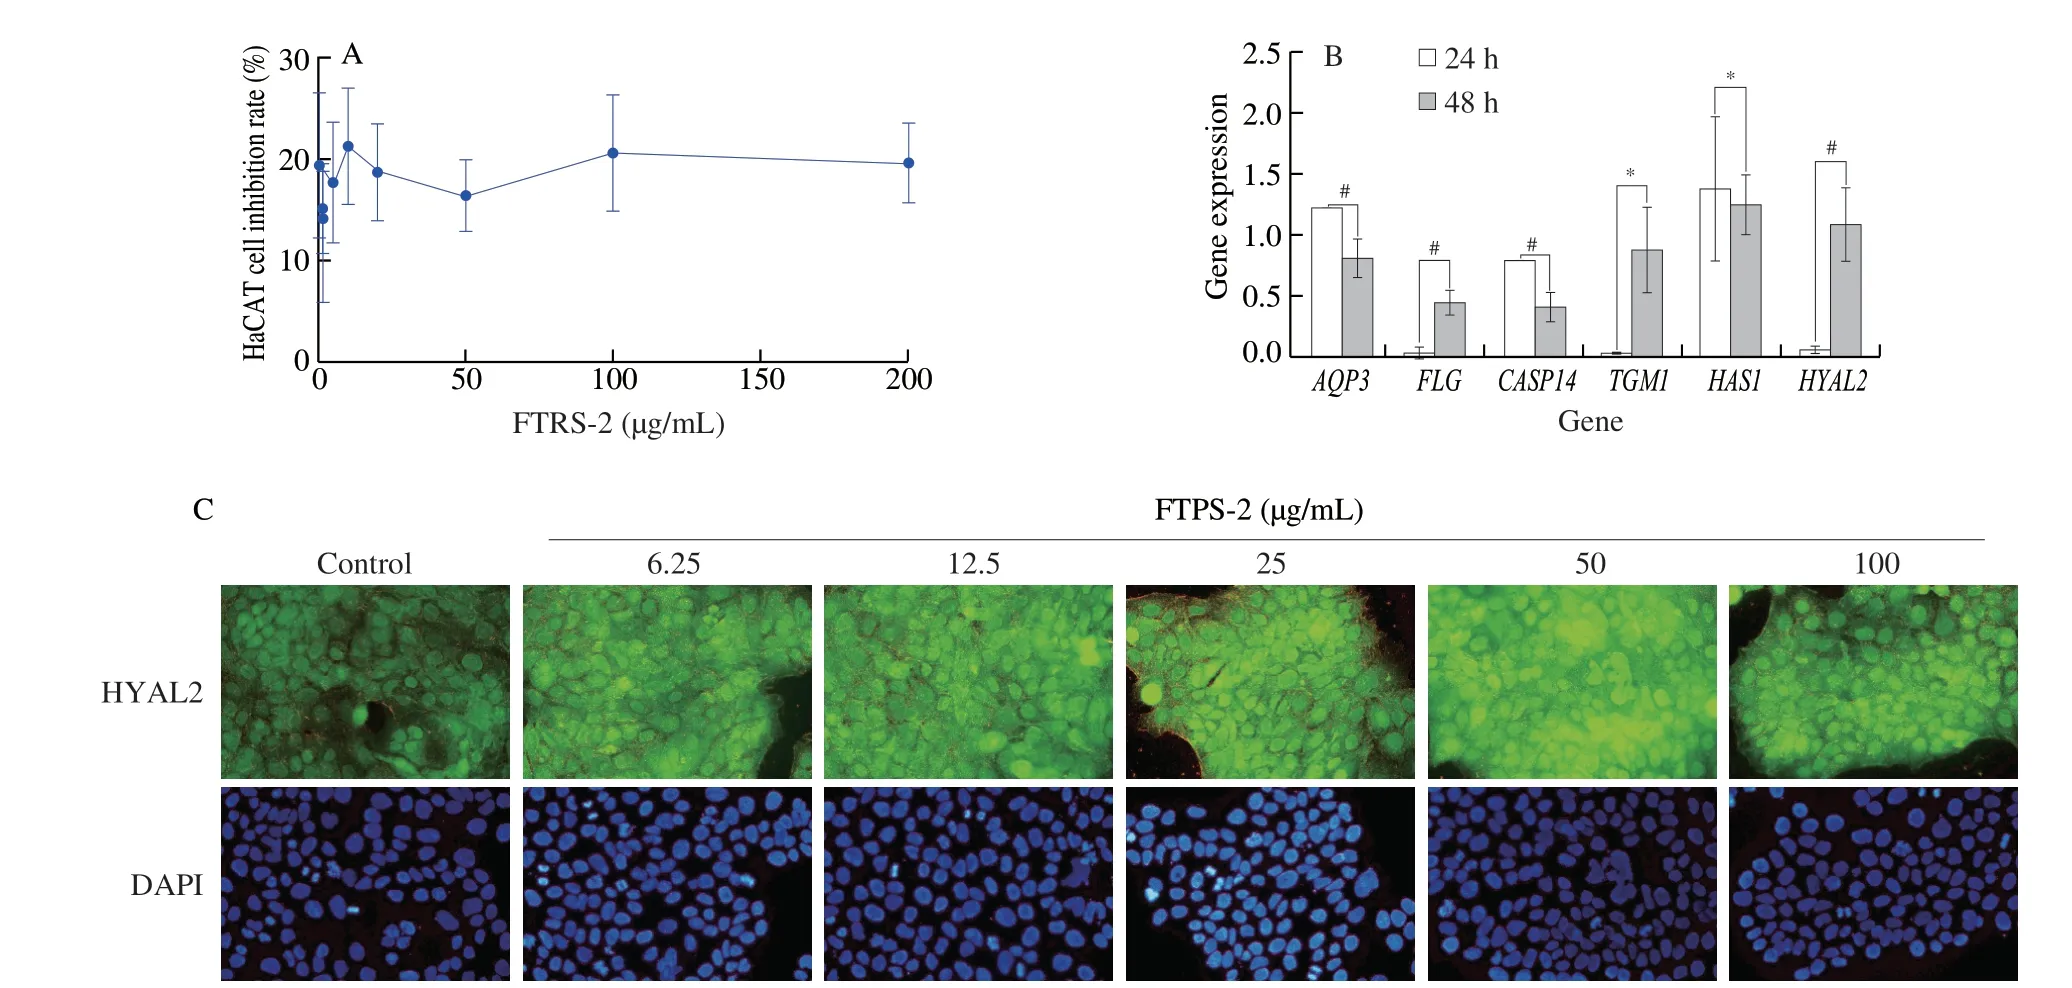
Fig.8 Effect of FTPS-2 on skin hydration.(a) Cell cytotoxicity of HaCaT cells was tested using the MTT assay; (b) HaCaT cells were treated for 24 h and 48 h with FTPS-2 (#P < 0.05; * P > 0.05).After removing the influence of blank group (without FTPS-2), 2-△△CT was used to evaluate the relative expression of genes (AQP3, FLG, CASP14, TGM1, HAS1, HYAL2) of skin hydration factors which were determined by qRT-PCR; (c) The effect of FTPS-2 at different concentrations on HYAL2 expression in HaCaT cells was determined by protein immunofluorescence assay.
FTPS-2 promoted the expression of hydration-related genes in HaCaT cells (Fig.8b).When HaCaT cells were exposed to FTPS-2 for 24 h, the expression levels ofFLG,TGM1andHALY2genes were slightly increased.The expression ofHAS1had the most dramatically increase, reaching 1.39 ± 0.59.However, except forHAS1andTGM1(#P> 0.05), the relative expression ofAQP3,FLG,CASP14andHYAL2genes increased significantly after 48 h (*P< 0.05).Among them, the relative expression ofHYAL2increased most significantly, reaching 1.09 ± 0.30.Exposure of FTPS-2 at different concentrations (6.25, 12.5, 25, 50, and 100 μg/mL) to HaCaT cells had a dose-effect relationship on HYAL2 protein expression (Fig.8c).The fluorescence intensity of HYAL-2 protein increased with the increase of FTPS-2 concentration, and reached the maximum at 50 μg/mL.
FTPS-2 showed a moisturizing effect in HaCaT cells.The realization of its moisturizing effect is related to many mechanisms.FTPS-2 may achieve a moisturizing effect by enhancing the transport of water molecules.The water transport and glycerin transport functions of AQP3 are essential for increasing the skin’s moisture and elasticity, but they are hardly expressed in keratinocytes [32].When FTPS-2 exposed to HaCaT cells, the expression level ofAQP3gene was significantly increased (Fig.8b).This indicates that the mechanism by which the FTPS-2 achieves moisturization is related to the expression level ofAQP3.Because of the glycerin transport function, it is suggested that the FTPS-2 may be able to cooperate with glycerin to achieve moisturizing effect.
FTPS-2 significantly promoted the expression ofCASP14,FLGandAQP3gene, indicating that the moisturizing effect of TP may be related to increasing the content of natural moisturizing factor (NMF) in the skin.The filaggrin is an important part of the stratum corneum, which is controlled byFLG[33].Silk fibroin is degraded into NMF with the participation ofCASP14,HAS1andAQP3[34-36], and it plays an important role in moisturizing and barrier integrity.
FTPS-2 may have a deep moisturizing effect.HYAL2is the gene with the most significant increase in expression (Fig.8b), and the effect of FTPS-2 (0-50 μg/mL) on HYAL2 expression shows a doseconcentration relationship (Fig.8c).HYPL2 provides conditions for the synthesis of collagen and elastic fibers in the dermis [37].Collagen plays an important role in the deep hydration of the skin [38].It forms a stretch net with elastin through the cross-linking reaction between the proteins and locks the water firmly, and transports water to the keratinocytes through AQP3 [5].TGM1 [36]promotes the cross-linking reaction of structural proteins and provides the epidermis with strength and stability.
In summary, FTPS-2 has a moisturizing ability that exceeds glycerine.The moisturizing effect possibly achieved by increasing the content of NMF in keratinocytes, increasing the elasticity and stability of the dermal layer, and improving the ability to transport water from the dermal layer to the keratinocytes (Fig.9).
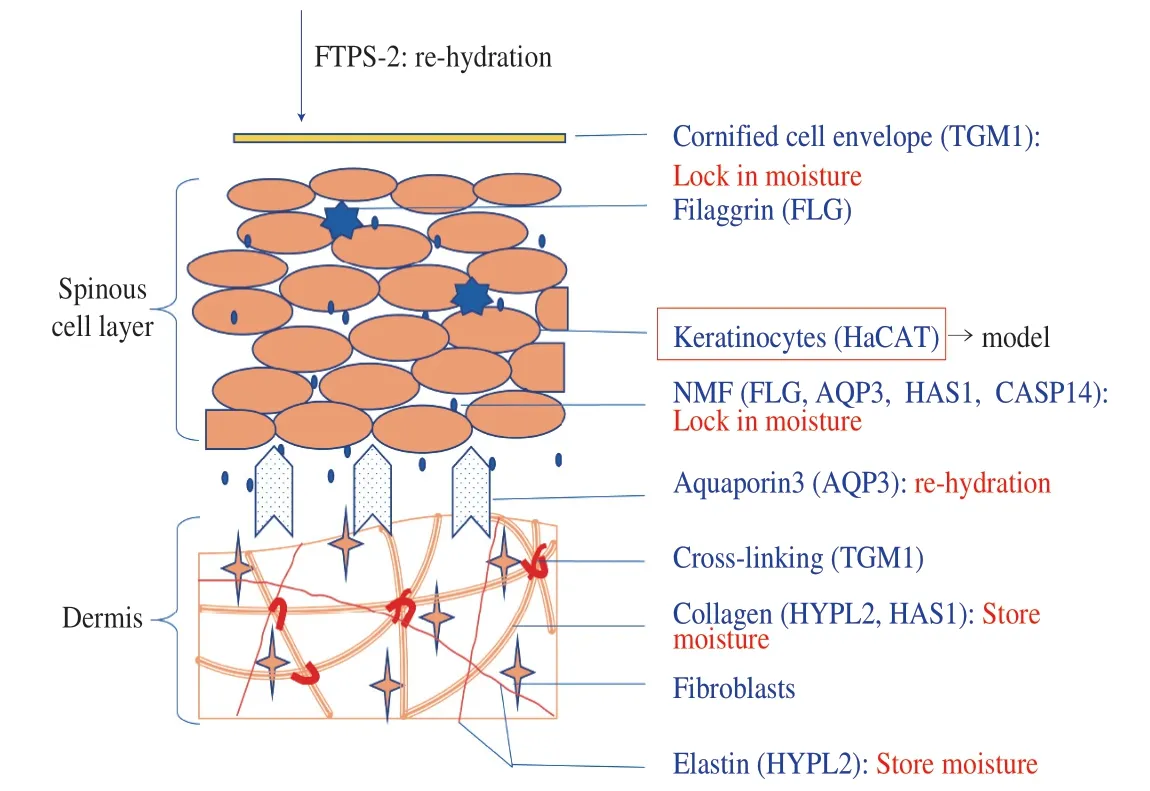
Fig.9 Speculation of the moisturizing mechanism of FTPS-2.
4.Discussion and conclusion
In the above study, we obtained the result that FTPS is a kind of neutral TP obtained by GCMCC5.39 fermentation.After purification, two main components, FTPS-1 and FTPS-2, were isolated.The monosaccharide composition, functional groups and configuration of these two components were very similar, which are both pyranose connected byα-glycosidic bonds.FTPS-1 and FTPS-2 contain a large number of hydroxyl groups, amino groups and carbonyl groups, and do not have an uronic acid structure.The structural difference between the two has shown in Table 3.
Moisturizing activity has a great relationship with the molecular structure of TP.TP prepared by fermentation method is a polyhydroxy galactomannan with excellent water solubility.Polysaccharides with similar structures all exhibit excellent moisturizing properties [39].The moisture retention of FTPS-2 within 4 h is more significant than that of FTPS-1 (Fig.6).Comparing its molecular structure, the moisture retention may be related to the content of mannose and acetamide groups, the ratio of mannose to galactose [40], and the molecular weight [41].
FTPS-2 regulate gene expression and transcription to achieve moisturizing effect.By increasing the expression ofFLGandCASP14genes, the production of natural moisturizing factors in keratinocytes was promoted.By promoting the expression ofAQP3gene, the permeability of cell membrane was increased, and the exchange of water molecules inside and outside the cell was promoted.By activatingHYPL-2andTGM-1to promote the expression of related proteins, and promote the synthesis of collagen and elastic fibers, it can increase the elasticity and stability of cell membrane, so as to protect water molecules from dispersibility.
Moisturizing is an important part of skin care and has a positive effect on protecting the skin barrier and inhibiting seborrheicdermatitis [42].At the same time, high water content and low sebum secretion are considered to be the main characteristics of fair skin [43].FTPS-2 can also be added to cosmetics as an auxiliary whitening ingredient.Many studies have confirmed that TP can reduce the formation of free radicals and prevent the lipid peroxidation caused by the damage of free radicals to cell structure [44].The significant expression ofCASP14gene can also inhibit the apoptosis of epidermal cells.This result also suggests that FTPS-2 can nourish the skin and delay aging.

Table 3 Differences between FTPS-1 and FTPS-2.
FTPS is non-cytotoxic and can achieve moisturizing effect from multiple perspectives, so it has great potential as a functional component in cosmetics.
Acknowledgement
We gratefully acknowledge the financial support from the Open Project Program of National R & D Center for Edible Fungus Processing Technology (20200110) and Shanghai Science and Technology Commission Project (18495810900).
Conflicts of Interest
The authors declare no conflict of interest.
杂志排行
食品科学与人类健康(英文)的其它文章
- Antioxidative and hepatoprotective activities of a novel polysaccharide (LSAP) from Lepista sordida mycelia
- Amelioration of metabolic disorders by a mushroom-derived polyphenols correlates with the reduction of Ruminococcaceae in gut of DIO mice
- Immunomodulatory effects of polysaccharides from edible fungus: a review
- Advances in research on chemical constituents and pharmacological effects of Paecilomyces hepiali
- Healthy function and high valued utilization of edible fungi
- Antrodia Cinnamomea ameliorates neointimal formation by inhibiting infl ammatory cell infi ltration through downregulation of adhesion molecule expression in vitro and in vivo
