Transformation Characteristics and Microstructure of Rail under Low Stress during Continuous Cooling
2021-04-16CENYaodongCHENLinCHANGGuoZHAOLeicheng
CEN Yaodong, CHEN Lin, CHANG Guo, ZHAO Leicheng
(School of Materials and Metallurgy, Inner Mongolia University of Science and Technology, Baotou 014010, China)
Abstract: To obtain a better understanding the thermal stress of a rail, the thermal simulator was used to measure the expansion curves of different stresses loaded during the continuous cooling process of U75V rail.The transformation plasticity model was established. The experimental results show that stress can accelerate the transformation process of pearlite. While the same cooling rate is accelerated with the increase of stress,the transformation process of pearlite is accelerated, and the proportion of plastic strain transformation in total strain increases. At the same stress, the process of transformation of pearlite decreases with the increase in cooling rate, and the proportion of transformation plastic strain in total strain decreases. When considering the transformation plasticity, the axial residual stress is more consistent with the actual working condition, the accuracy of the transformation plasticity model is higher; during the continuous cooling process, and the loading stress has a significant influence on the structure. When the stress increases, the orientation of the pearlite lamellae becomes disordered, the pearlite lamellae are bent, the lamellae spacing is no longer uniform, and the hardness is improved.
Key words: rail; transformation plasticity; microstructure
1 Introduction
Rail plays a vital role in railway transportation;however, the rail temperature is non-uniform for large cross-sections during heat treatment, which will eventually produce serious cause extreme thermal stress within the rail[1]. Worse still, this temperature difference will also lead to the unbalanced of transformation plasticity, resulting in rail tissue stress[2]. Transformation plasticity is stress generation due to temperature change during the heat-treatment process. With the transformation of metallographic structure, plastic deformation of rail will occur because of the effect of this stress[3]. The rail would have extreme non-uniform deformation due to the phase transformation: with the decrease of rail temperature, the railhead is bent first, and then the rail bottom is bent, resulting in severe bending defects[4].At present, the research of stress on the transformation of microstructure focuses mainly on the effect on the transformation dynamics, which is called stress-induced transformation, and on the change in mechanical behavior related to transformation caused by external or internal stress in the transformation process of materials-transformation plasticity,i e, the strain of materials in the transformation process under the effect of stress lower than the yield strength of materials[5]. From a metallurgical point of view, Denis studied interactions during the pearlite and martensitic transformation of steels under uniaxial tensile stress and reviewed the models for describing stress-phase transformation interactions. A coupled thermal phase transformation and internal stress calculation model was also proposed by Denis. In this model, in particular, the stress-phase transformation interactions are considered, not only for martensitic transformation but also for diffusion-dependent transformation during quenching of steel[6-9].
Leeet al[10]investigated the relationship between transformation kinetics and associated distortion using low-alloy chromium steel and proposed a new starting temperature for martensite and a kinetics equation for martensite. Leblondet al[11,12]proposed a theoretical approach to the Magee mechanism is negligible, and the phases are ideal-plastic. An explicit expression for the transformation plastic strain rate is obtained for steel transforming small applied stress. Liuet al[13]studied internal stress in quenched AISI 4140 medium carbon steel. De Oliveiraet al[14]dealt with the modeling and simulation of quenching in steel cylinders using a multi-phase constitutive model.
Carloneet al[15]dealt with a finite element analysis of the steel quenching process; concerning the transient temperature field and the thermally induced solid-solid phase transformations. All the process phases,i e, heating, holding, and cooling, were considered, modeling both the formation and decomposition of austenite and taking into account the processes of nucleation and growth. Boket al[16]studied stress development and shaped change during the press-hardening process using phase-transformation based finite element analysis. These findings provide a guide for the study of steel plasticity transformation. In fact, in the complex thermal cycle process, the influence of transformation plasticity on residual stress distribution and deformation cannot be ignored, such as heat treatment for all large metal parts[17]. In the process of rail heat treatment, the proportion of plastic transformation strain in the total strain is relatively high, and the impact on the residual stress and bending deformation of the final part is dreadful[18]. However, the rail plasticity transformation has always been a perplexing problem in production. Therefore, it is necessary to study the transformation plasticity of rail to study the distribution of residual stress and the control of bending deformation during the process of quenching.
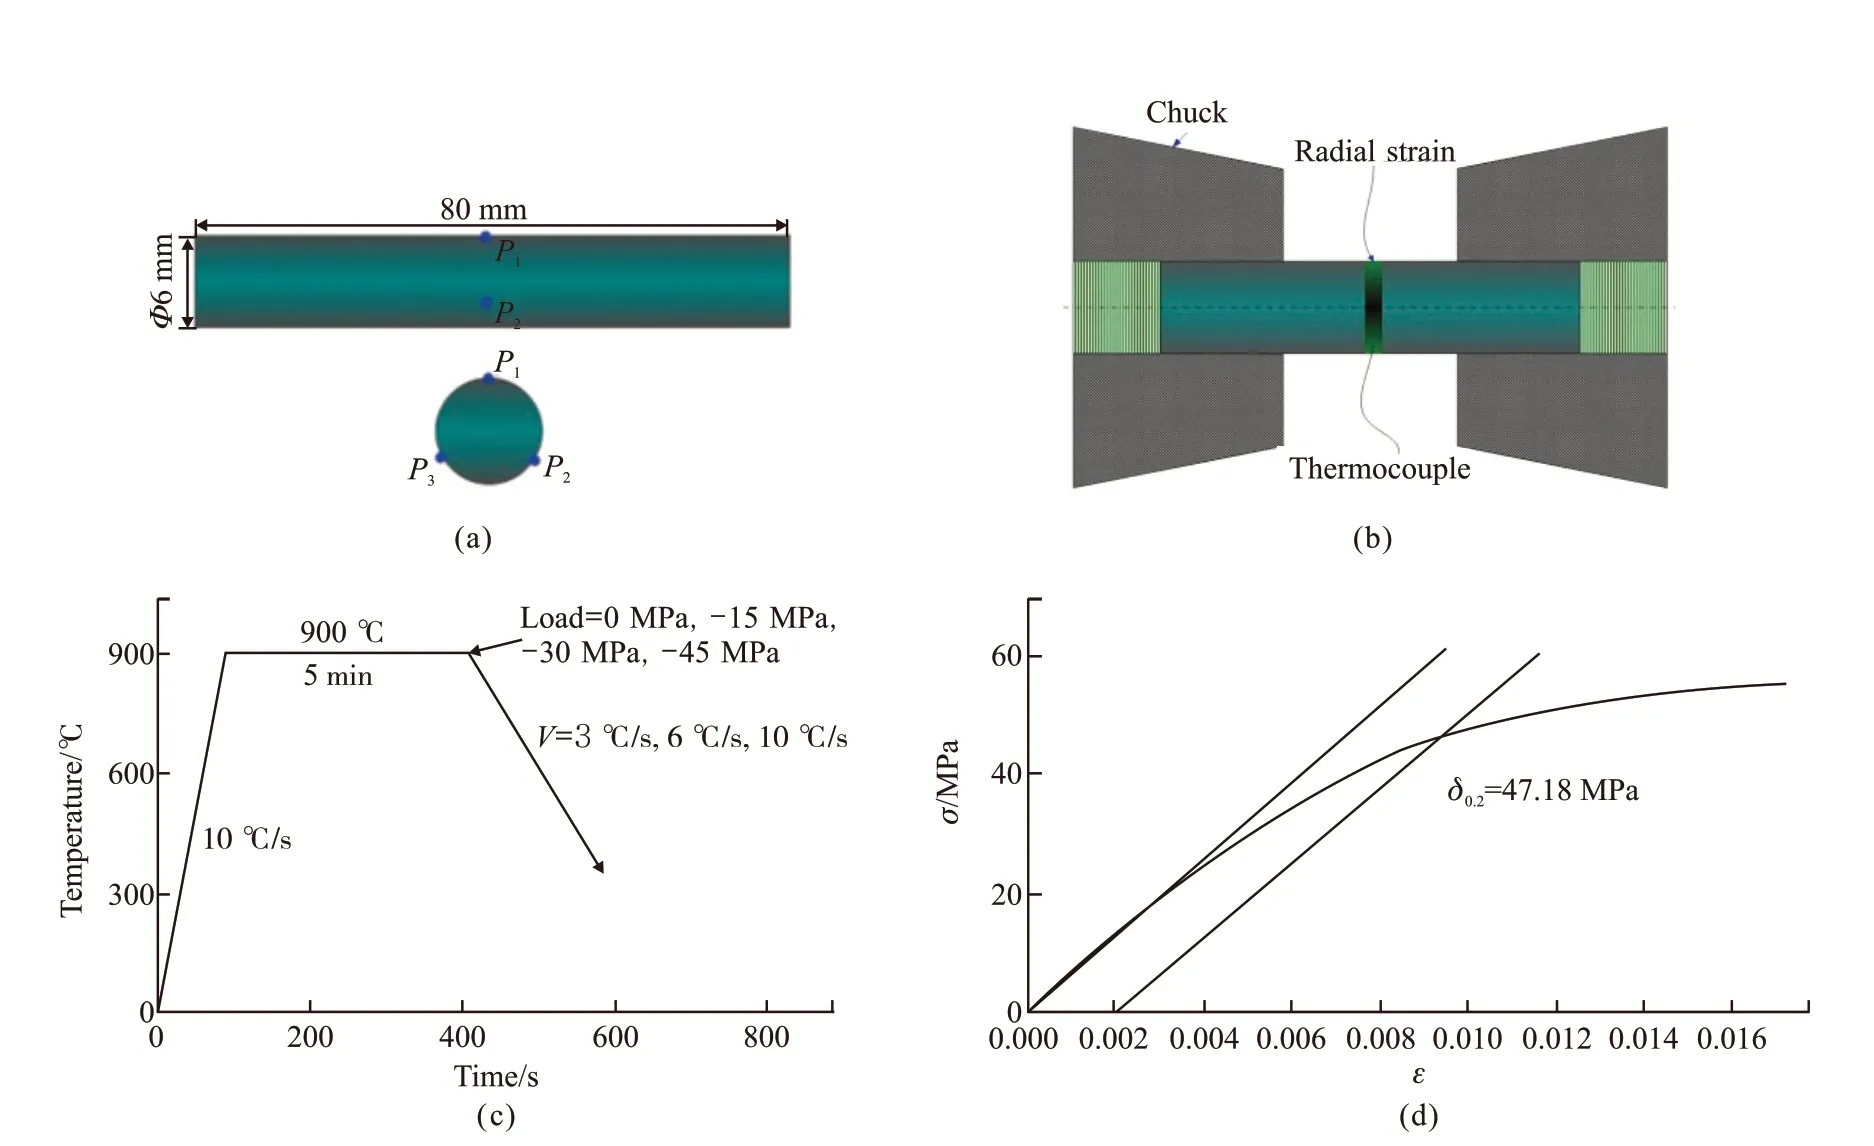
Fig.1 Process and parameters of U75V: (a) Size of sample and test position of residual stress; (b) Sample clamping and measurement method; (c) Thermal simulation process; (d) Yield strength at 900 ℃
In our present work, the Greenwood-Johnson mechanism was used to evaluate the expansion curves of rails under different loading stresses during continuous cooling. In the course of the continuous cooling transformation process, the transformation plastic strain, elastic strain, and thermal strain of pearlite rails were measured, and the transformation plastic strain was separated from the total strain. Specific gravity was calculated for the transformation plastic strain under different loads and its proportion in the overall strain,which will enrich providing precise measurement basis for numerical simulation of bending deformation and residual stress of rail during quenching.
2 Experimental
The test material is U75V rail steel, and the alloy composition of U75V is shown in Table 1. WEDM(wire cut electrical discharge machining) processes the test sample, and the dimensions are shown in Fig.1(a).The Gleeble-3500 thermal simulation test machine was used to measure the thermal expansion curve of the testsample. The clamping method of the sample is shown in Fig.1(b). First, the thermocouple and the clamping radial extensometer were welded in the middle of the sample, and then the sample was heated to 900 ℃ at the rate of 10 ℃/s according to the process in Fig.1 (c).In order to fully ensure the austenitization, it is important to keep warm for 5 min in the last 5 s, load the load to the target value, choose 3 ℃/s, 6 ℃/s, and 10 ℃/s as the cooling rate of continuous cooling pearlite transformation in this experiment, record the relationship curve between diameter change and temperature with radial extensometer, then cold to 20 ℃ at different cooling rates, and the stress-strain at the highest temperature is shown in Fig.1(d). According to Fig.1(d),the compressive yield strength is 47.18 MPa at 900 ℃.The compressive stresses are selected as 0 MPa, -15 MPa, -30 MPa, and -45 MPa (minus sign indicates the compressive stress) in order to study the transformation and microstructure of the rail during continuous cooling, which must be smaller than the yield strength.The expansion curve parameters during the cooling transformation are shown in Table 2. The Xstress-3000 stress analyzer was used after thermal simulation to measure the axial residual stress value on the surface of the sample. The sample center was chosen as the test point, and there were three test points with a circumferential spacing of 120°, which is as shown in point P in Fig.1(a). The residual stresses were determined by deforming finite element simulation software under the two conditions for considering transformation plasticity and not considering transformation plasticity. The microstructure was examined using CLSM (laser confocal microscope) and SEM (scanning electron microscopy)QUANTA-40, and Vickers hardness was measured.

Table 1 Alloy composition of U75V rail/wt%
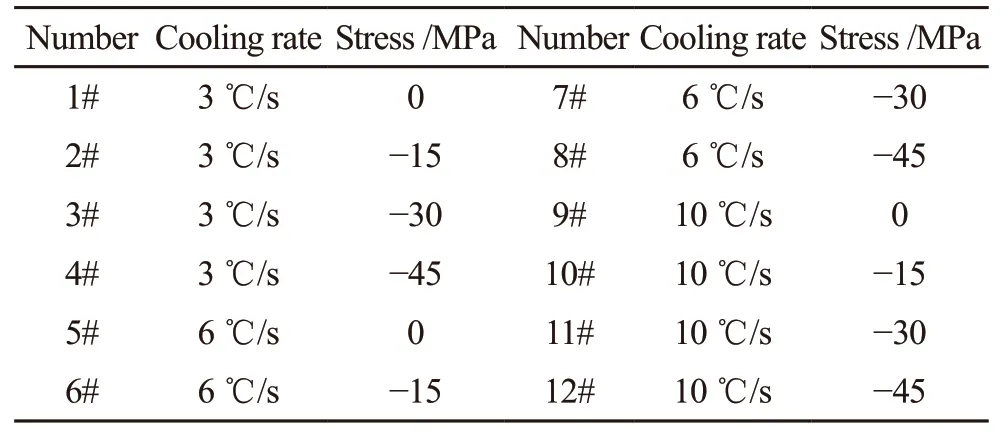
Table 2 Parameters of the continuous cooling transformation process
3 Dynamic and plastic model of transformation expansion curve of continuous cooling
3.1 Phase transformation expansion curve
Fig.2 shows the U75V rail steel pearlite transformation expansion curve at the same cooling rate and different stress. It can be seen in Fig.2 that there is an apparent phase transformation of the plasticity stage in the continuous cooling transformation process of pearlite. In the transformation process, the stress expansion curve of 0 MPa (no stress) at all cooling rate is below the stress expansion curve of -15 MPa, -30 MPa, and-45 MPa, and with the increase of pressure stress, the difference of expansion rate corresponding to different stress increases. It can also be seen from the Fig.2 that the faster the cooling rate is, the smaller the thermal expansion rate is in the phase transformation process.When the cooling rate is slow, the difference in the expansion rate of different stresses is more significant.
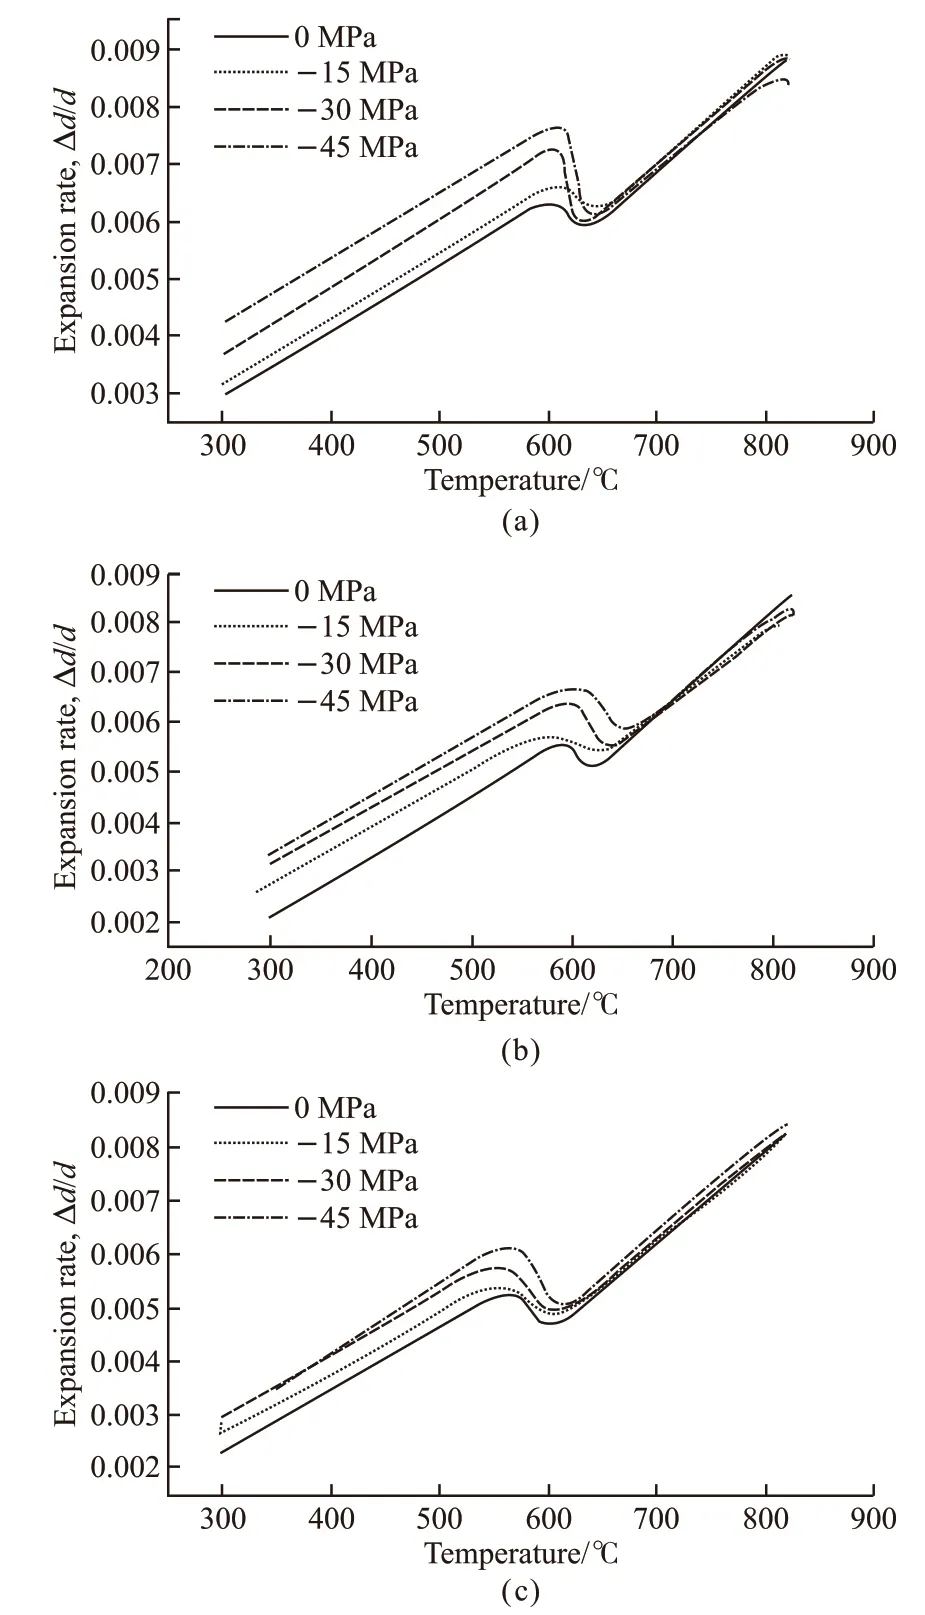
Fig.2 Phase transformation expansion curves: (a) Cooling rate 3℃/s; (b) Cooling rate 6 ℃/s[19]; (c) Cooling rate 10 ℃/s
3.2 Expansion curve analysis
3.2.1 Analysis of pearlite transformation and expansion curve no stress
Fig.3[19]shows the pearlite transformation expansion curve without stress (the compressive stresses is 0).The radial strainmeasured at the temperatureTconsists of two parts: one is the transformation expansion strain ofεtr, and the other is the thermal expansion strain ofεth. According to the formula of Greenwood-Johnson[20], the transformation strain (line BC in Fig.3) is as follows:

where,βPTis the pearlite transformation coefficient atT℃, as line BD in Fig.3;αPis the thermal expansion coefficient of pearlite;αγis the coefficient of thermal expansion of austenite;fPis the volume fraction of pearlite.
The thermal strain is the segment BF in Fig.3:

So, the total radial strain is as follows:

The parameters ofβPT,αP, andαγfor the abovein Table 3 are obtained from Fig.2.

Table 3 Parameter values at different cooling rates
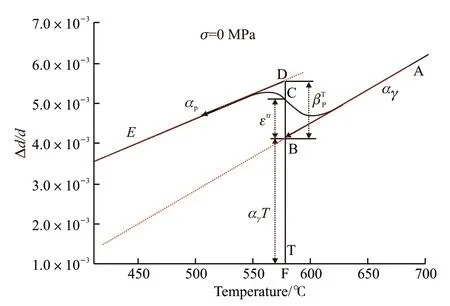
Fig.3 Diagram of the radial strain of phase transformation expansion
3.2.2 Analysis of phase transformation expansion curve under stress
During the continuous cooling transformation of pearlite, when the axial compressive stress is applied,plastic strain transformationεrtp, the elastic strainεre,phase transformation strainεtr, and thermal expansion strainεthin total radial strainεγ, are expressed as follows:

According to the previous analysis, thermal expansion strainεth, and transformation strainεtr:

According to Hooke’s law, the radial elastic straincan be expressed as follows:

where, the radial elastic strain , the axial elastic strain, axial stressσ, Poisson ratioμ, and elastic modulusE.According to Greenwood-Johnson model, the expression of plastic strain in axial transformation is as follows[21,22]:

where,Kis the transformation plasticity parameter andσis the applied axial stress. According to the law of plastic flow, the relationship between radial plastic strain and axial plastic strain is as follows:

Based on the above analysis, from formulae (6)-(8), the transformation plastic strain can be obtained as follows:

3.3 Establishment of transformation plastic model and stress on transformation plastic strain
3.3.1 Determination of transformation plasticity parameterK
The parameter value must be accurately determined in order to simulate and predict the strain and residual stress of material during the heat-treatment process. From formula (7) and formula (8), the calculation formula of transformation plasticity parameters can be given as:

Volume fraction of pearlite at the end of transformationfP=1, then formula (9) is shown as follows:

Formula (10) can be simplified is shown as follows:

Then formula (11) and formula (12), which is simplified as follows:

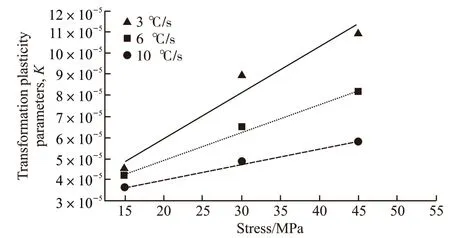
Fig.4 Linear fitting of transformation plasticity characteristic parameter of K and stress
Using the formula (13) to calculate the transformation plasticity parameterK, the data in the equation will be the data below pearlite transformation endpoint on the expansion curve to calculate the pearlite transformation plasticity parameterKunder different conditions, and the calculation results are shown in Fig.4.It can be seen in Fig.4 that the pearlite transformation plasticity parameterKunder the same cooling rate and different stress is not a constant, and the fitting relationship betweenKand stress is as follows:

According to the transformation plastic deformation mechanism, the deformation first occurs in the soft phase, because the U75V at a cooling rate of 3-10 ℃/s, the microstructure is lamellar pearlite between ferrite and cementite, and ferrite is a soft phase. According to Greenwood-Johnson mechanism, in the process of phase transformation, the presence of external stress or internal stress induced by phase transformation and temperature imbalance results in plastic deformation of the weak phase in the material. The higher value ofK, the greater the ability of transformation plasticity.Therefore, based on the Greenwood-Johnson model,the pearlite transformation plastic model under different cooling rates can be obtained as follows:6 ℃/s: = -0.5(2.31×10⁻⁵+1.31×10⁻⁶σ)σfp(2-fp)10 ℃/s: = -0.5(2.52×10⁻⁵+7.34×10⁻⁷σ)σfp(2-fp)

3.3.2 The effect of stress on the transformation process of pearlite
In order to calculate the transformation of plastic strain, the volume fraction needs to be calculated[23].Calculation of volume fraction with no stress is applied:

Calculation of volume fraction with stress is applied: By combining formulae (7)-(9), the pearlite volume fraction equation is obtained

The relationship between the volume fraction of pearlite and temperature under different compressive stress is shown in Fig.5, according to the calculation of the expansion curve and relevant parameters. As can be seen from Fig.5(a), if the cooling rate is 3 ℃/s, before the pearlite transformation variable is 80%, the effect of the stress accelerating transformation process is relatively obvious, and the effect is weakened. As the compressive stress increases, the transformation starting temperature rises from 657.3 ℃ to 678.51 ℃, as seen in Fig.5(b), when the cooling rate is 6 ℃/s, before the pearlite transformation variable is 70%, the effect of the stress accelerating phase transformation process is obvious, and then the effect is weakened. The starting temperature of the transformation rises from 635.9 ℃to 661.5 ℃; as can be seen in Fig.5(c), when the cooling rate is 10 ℃/s, the starting temperature of the transformation rises from 621.1 ℃ to 633.5 ℃. It shows that stress can accelerate the transformation process of pearlite, especially in the early stage of transformation.When the cooling rate is the same, with the increase of stress, the transformation process is accelerated; when the stress is the same, with the slowdown of cooling rate, the transformation process of pearlite is accelerated, and the initial temperature of transformation is increased.
3.3.3 Effect of stress on transformation plastic strain
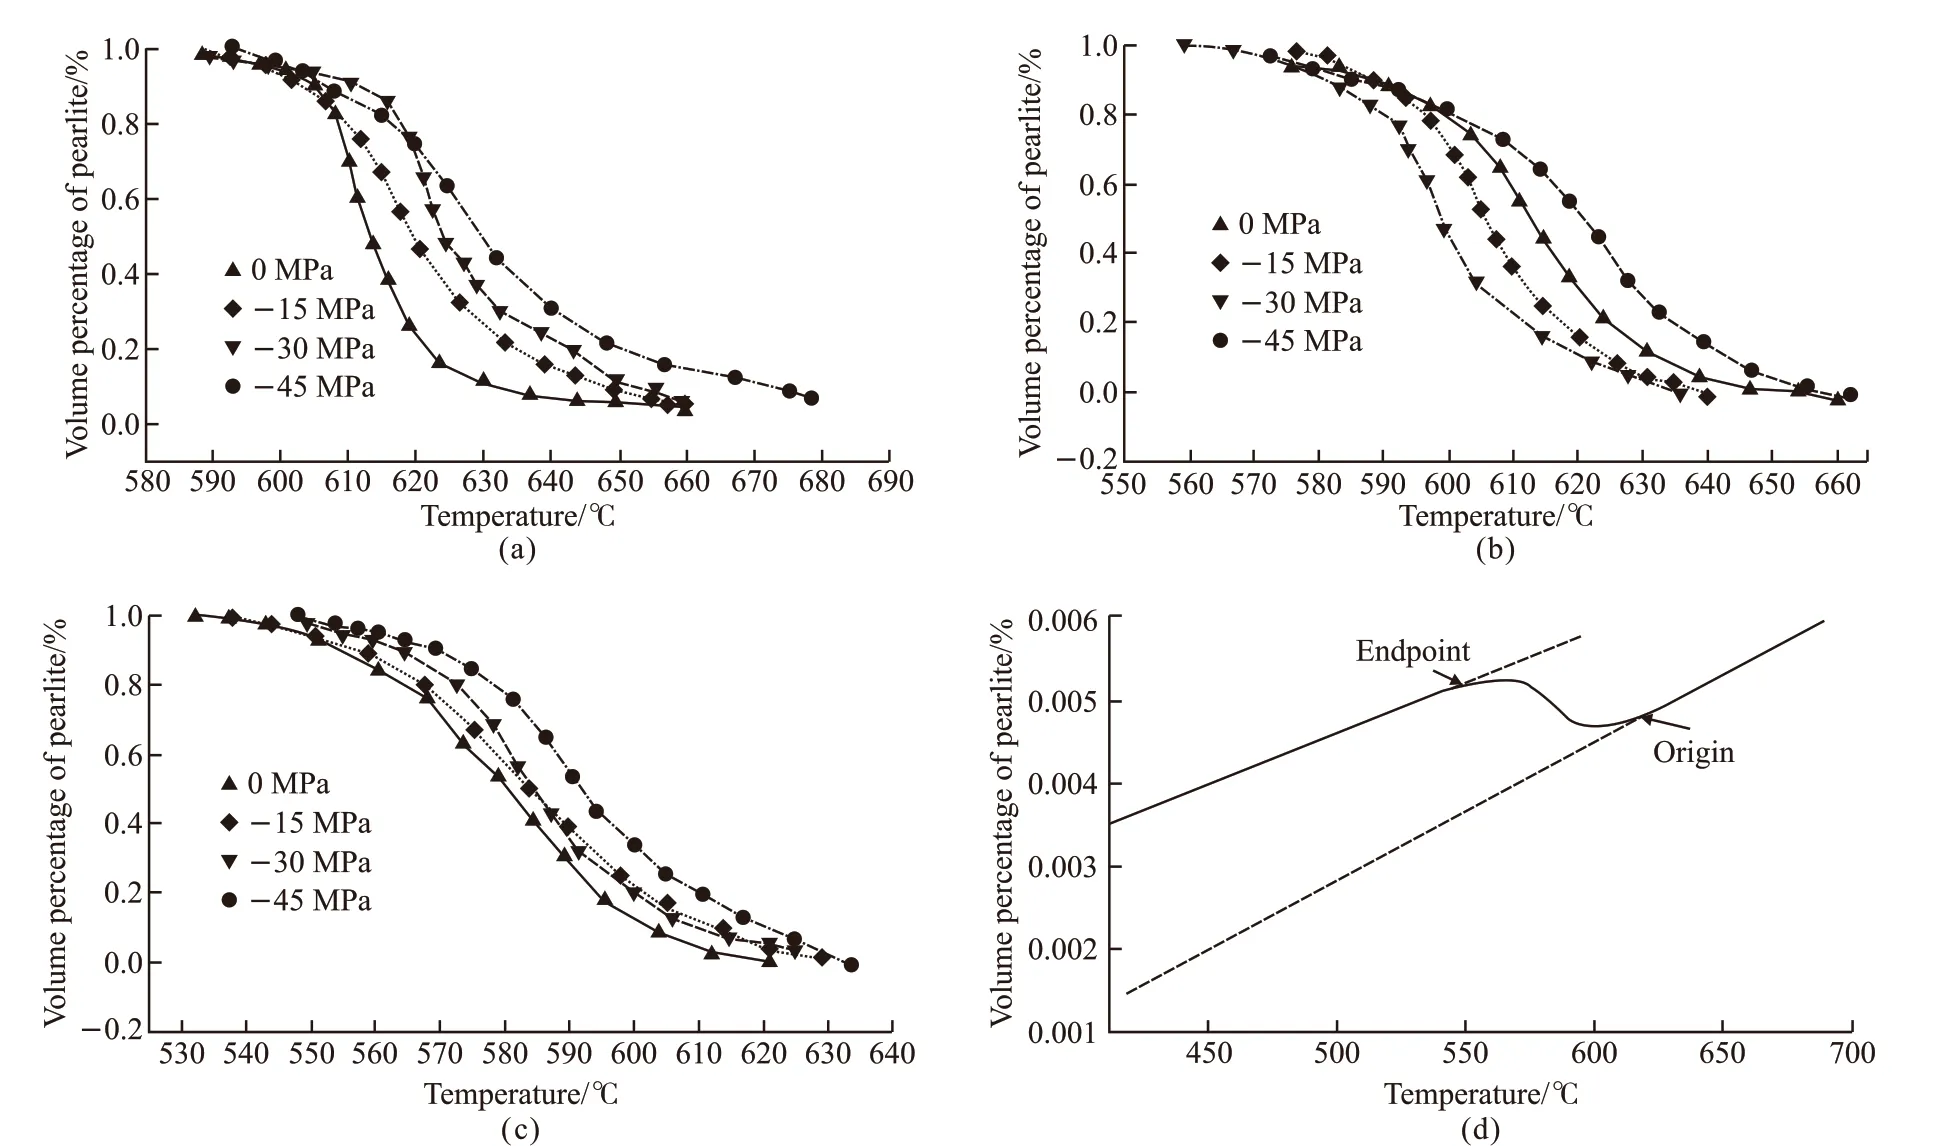
Fig.5 Relationship between pearlite volume fraction and temperature: (a) Cooling rate 3 ℃/s; (b) Cooling rate 6 ℃/s; (c) Cooling rate 10 ℃/s; (d) Phase transition point
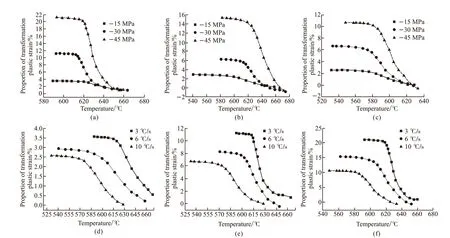
Fig.6 The relationship between the percentage of transformation plastic strain in total strain and temperature:(a) Cooling rate 3 ℃/s;(b) Cooling rate 6 ℃/s;(c) Cooling rate 10 ℃/s; (d) -15 MPa; (e) -30 MPa; (f) -45 MPa
The transformation plasticity strain within the pearlite transformation temperature range was determined based on the Greenwood-Johnson formula and the calculated transformation plasticity parameterKand transformation volume fractionfP. Fig.6 shows the change of the ratio of plastic transformation strain to total strain under different compressive stresses with temperature and stress. It can be seen From Fig.6(a)that when the cooling rate is 3 ℃/s, and the stress is -15 MPa, -30 MPa, and -45 MPa, respectively,the plastic transformation strain accounts for 3.56%,11.16%, and 21.15% of the total strain. It can be seen From Fig.6 (b) that when the cooling rate is 6 ℃/s, and the stress is -15 MPa, -30 MPa, and -45 MPa, respectively, the proportion of plastic transformation strain to total strain is 2.93%, 8.21%, and 15.44%. It can be seen from Fig.6 (c) that when the cooling rate is 10 ℃/s, and the stress is -15 MPa, -30 MPa, and -45 MPa,respectively, the proportion of strain transformation plastic to total strain is 2.58%, 6.68%, and 10.68%,respectively. The results show that the ratio of transformation plastic strain in total strain decreases with the increase of cooling rate. It can be seen from Fig.6(d)that when the stress is -15 MPa and the cooling rate is 3 ℃/s, 6 ℃/s, and 10 ℃/s, respectively, the proportion of plastic transformation strain in the total strain at the end of transformation is 3.56%, 2.93%, and 2.58%. It can be seen from Fig.6(e) that when the stress is -30 MPa, and the cooling rate is 3 ℃/s, 6 ℃/s, and 10 ℃/s,respectively, the ratio of plastic transformation strain in the total strain is 11.16%, 8.21%, and 6.68%; it can be seen from Fig.6(f) that when the stress is -45 MPa and the cooling rate is 3 ℃/s, 6 ℃/s, and 10 ℃/s, respectively, the ratio of plastic transformation strain in the total strain is 21.15%, 15.44%, and 10.68%. It shows that the ratio of plastic transformation strain in total strain increases with the increase of stress.
In conclusion, under the same cooling rate, the ratio of plastic transformation strain in total strain increases with the increase of stress; under the same stress condition, the ratio of plastic transformation strain in total strain decreases with the increase of cooling rate; so when considering the strain, the influence transformation plastic strain must be considered.
3.4 Verification of mathematical model of transformation plasticity
Transformation plasticity has an effect on residual stress, so the residual stress of considering transformation plasticity and no consideration transformation plasticity were calculated respectively, using deformed finite element simulation software, and then the measured residual stress was compared so as to verify the accuracy of the established transformation plasticity model. The simulation of residual stress is contrasted with the measured stress when the cooling rate is 6 ℃/s as the model.
3.4.1 Thermophysical parameters of materials
The thermal conductivity of U75V is shown in Table 5.
The coefficient of thermal expansion of U75V is obtained from the expansion curve when the cooling rate is 6 ℃/s, and no stress is applied. The coefficient of thermal expansion of pearlite ap=1.343×10⁻⁵, and that of austenite ar=1.832×10⁻⁵.
The change process of the temperature field is mainly the process of heat transfer. In order to ensure the cooling rate of 6 ℃/s, after the program debugging,the corresponding relationship between the overall heat transfer coefficient and the cooling time is shown in Fig.7.

Table 5 Thermal conductivity of U75V rail[24]

Table 6 Corresponding relationship between temperature and phase change expansion coefficient[27]
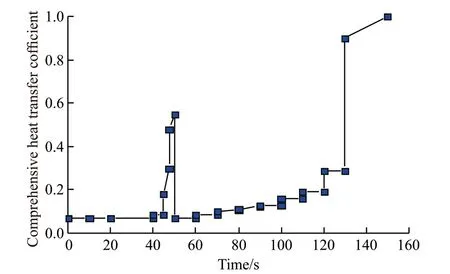
Fig.7 Relationship between comprehensive heat transfer coefficient and cooling time
The expansion coefficient for pearlite transformation was obtained from the expansion curve when the cooling rate is 6 ℃/s in Fig.2, and no stress is applied.The specific value is shown in Table 6.
3.4.2 Geometric model and mesh generation
The sample size used in the computer simulation to compare with the thermal simulation experiment is the same as that of the heating part of the thermal simulation experiment. The mold added on both sides of the sample is to keep consistent with the chuck in the thermal simulation experiment. The simulated sample size is shown in Fig.8. In the preprocessor of DEFORM-3D,the tetrahedron is used as the primitive.
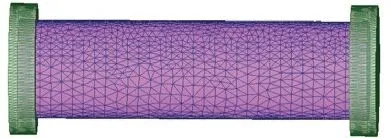
Fig.8 Simulated sample size
3.4.3 Initial and boundary conditions of simulation technology
Simulation process: After austenitization at 900℃, the sample is cooled at a cooling rate of 6 ℃/s, and loaded with -15, -30, and -45 MPa respectively in the axial direction of the sample. In the cooling process,the transformation plasticity is not considered; after austenitization at 900 ℃, the sample is cooled at a cooling rate of 6 ℃/s, with -15, -30, and -45 MPa being applied in the sample axial direction, respectively.The transformation plasticity factor is considered in the cooling process, and the established plasticity transformation model is used: = -0.5(2.31×10⁻⁵+1.31×10⁻⁶σ)σfp(2-fp).
Initial conditions: the initial temperature of the sample is uniform, heat preservation at 900 ℃ to ensure complete austenitization.
Boundary conditions: the radial displacement is fixed, and the axial movement is free, which is consistent with the thermal simulation experiment conditions.
3.4.4 Finite element simulation results and analysis
The residual stress nephogram with no consideration of transformation plasticity is shown in Fig.9, and the axial residual stress nephogram with transformation plasticity concern is shown in Fig.10. Compared with Fig.9 and Fig.10, it can be found that the residual stress distribution is relatively uniform, without taking into account transformation plasticity, and the stress distribution is uneven when considering the transformation plasticity. Because the transformation plasticity causes uneven and irregular distortion of the workpiece during the quenching process of the rail, the process of stress change on the surface and inside of the workpiece is relatively complex. The transformation plastic strain accounts for 2.93% of the overall strain when the cooling rate is 6 ℃/s, and the stress of -15 MPa. Although the transformation of plastic strain is very low, it still plays a role in releasing stress concentration. Because of the transformation, plastic deformation occurs in the process of transformation, and this period is also a period of relatively violent stress changes. If the material plastic deformation occurs in this period, then the residual stress can be reduced. Therefore, when the applied stress is less than -30 MPa, the residual stress considering transformation plasticity is smaller. The ratio of transformation plastic strain in total strain is also increased to 15.44% when the stress is increased to -45 MPa, and the transformation plastic deformation is increased. However, due to the uneven distribution of external stress in the sample, there is a significant increase in the probability of uneven distribution of transformation plastic deformation in the sample, so the residual stress considering transformation plastic is naturally larger. Therefore, if the external stress is larger than -30 MPa, the residual stress with consideration of the transformation plasticity is larger. It can be seen that the amount of transformation plastic deformation increases with the increase of external stress in the transformation process. However, because the external stress is not evenly distributed in the sample, the probability of uneven distribution of transformation plastic deformation in the sample is significantly increased,increasing residual stress.
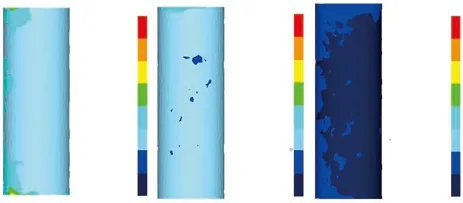
Fig.9 Nephogram of axial residual stress with no considering transformation plasticity:(a) -15 MPa;(b) -30 MPa;(c) -45 MPa
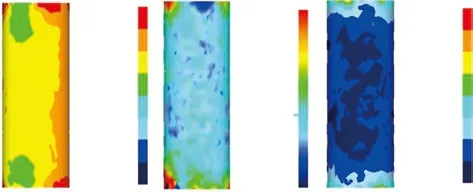
Fig.10 Nephogram of axial residual stress with considering transformation plasticity:(a) -15 MPa;(b) -30 MPa; (c) -45 MPa
3.4.5 Comparison between simulation results and measured results
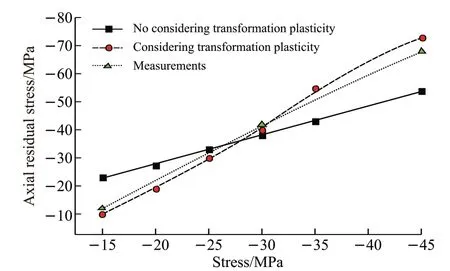
Fig.11 Measurements stress and the simulated residual stress

Fig.12 SEM images at cooling rate of 3 ℃/s: (a)0 MPa; (b) -15 MPa; (c) -30 MPa; (d) -45 MPa

Fig.13 SEM images at cooling rate of 6 ℃/s: (a)0 MPa; (b) -15 MPa; (c) -30 MPa; (d) -45 MPa
Three samples were tested using stress instrument with a cooling rate of 6 ℃/s and axial loading stress of -15, -30, and -45 MPa. The value of measurement stress and the simulated residual stress value are shown in Fig.11. It can be seen that the trend and size of the measured stress value are more similar to that of considering transformation plasticity. When the stress of-15 MPa, the stress error between the measurements and simulation with consideration of transformation plasticity is 2 MPa, and the stress error between the measurements and simulation without consideration of the transformation plasticity is 11 MPa. When the stress of -30 MPa, the stress error between the measurements and simulation with consideration of transformation plasticity is 2 MPa, and the stress error between the measurements and simulation without consideration of the transformation plasticity is 4 MPa. When the stress of -45 MPa, the stress error between the measurements and simulation with consideration of the transformation plasticity is 5 MPa, and the stress error between the measurements and simulation without consideration of the transformation plasticity is 14 MPa, which can be seen that the error of considering transformation plasticity is low compared to the no-considered transformation, and the transformation plasticity should not be ignored in all deformation. Therefore, the transformation plastic model established in this paper has high accuracy.
4 Effect of stress on microstructure and hardness
The residual stresses are affected by non-uniform thermal stresses during quenching[25,26]. In the U75V rail microstructure, morphology is typically the lamellar pearlite structure formed by alternating ferrite and cementite sheets, and the external stress has a significant influence on the morphology of rail during the transformation of pearlite[27,28]. The typical lamellae with a cooling rate of 3 ℃/s and 6 ℃/s were selected for analysis.
4.1 Effect of low stress on the microstructure of continuous cooling transformation
Fig.12 is the metallographic SEM results from different stress levels at a cooling rate of 3 ℃/s. The lamellar structure of the structure is apparent when there is no stress, the interface between ferrite and cementite is transparent and straight, the distance between lamellae is relatively uniform, and the size is large in the length direction; when the stress of -15 MPa, the lamellae is still lamellar structure, but the lamellae are no longer straight, and the interface between ferrite and cementite is not clear; when the stress continues to increase to -30 MPa, The orientation of the lamellae becomes disordered, the interface is bent seriously, and the distance between the lamellae is uneven when the stress continues to increase to -45 MPa, the disorder becomes more obvious.
Fig.13 shows the metallographic SEM results of different stress levels at a cooling rate of 6 ℃/s.It can be seen, as shown in Fig.13(a) that it is typical pearlite with clear lamellae and uniform spacing,but it is slightly different from that at 3 ℃/s, and the lamellae have certain bending deformation. When the stress increases to -15 MPa, as shown in Fig.13(b),the interface of laminations becomes a little fuzzy, but it can be observed from the picture that the spacing of laminations decreases, and the bending of laminations becomes more severe than that without stress. From Fig.13(c) and Fig.13(d), it can be seen that when the stress increases to -30 MPa and -45 MPa, the spacing between the laminations becomes no longer uniform,the interface between the laminations is also fuzzy,and the laminations split in the length direction, so the length direction size is small. It can be seen that under the cooling rate is 3 ℃/s or 6 ℃/s, the structure with stress is more disordered than that no stress because it is related to the growth of pearlite crystal core, under constant stresses. The orientation of pearlite lamellae is more at 6 ℃/s than at 3 ℃/s. The reason is that the degree of supercooling is high when the cooling rate is 6 ℃/s, so the effect of stress gradient as diffusion force will be enhanced, and the direction and size of the stress gradient are different, so the growth direction is diverse. The transformation of plastic deformation occurs during the continuous cooling transformation of pearlite, but the dislocation can only move in a short distance in the lamellar ferrite. When encountering carbide, the dislocation will accumulate in the lamellar carbide; the stress is less than the yield strength, and the dislocation unable to overcome the resistance movement, thus producing the stress field, which makes the lamella bend.
4.2 Effect of low stress on the hardness
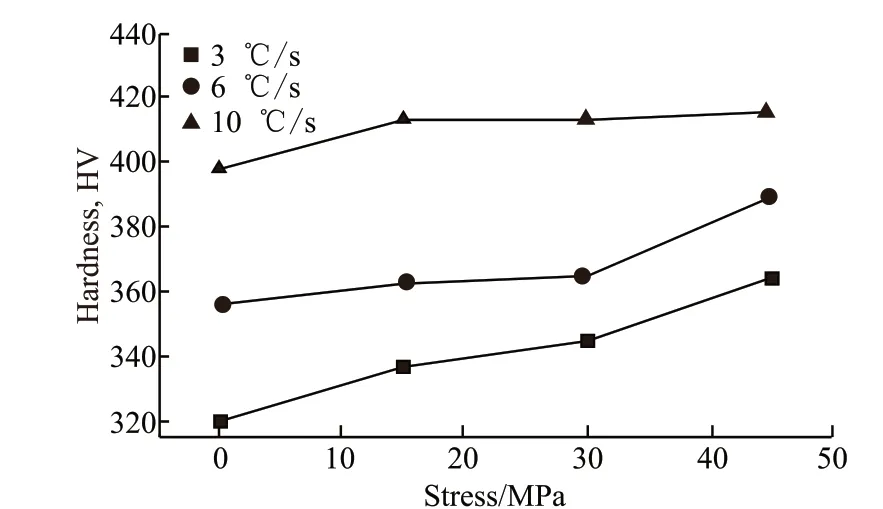
Fig.14 Effect of stress on average hardness at different cooling rates
The effect of stress on the hardness under different cooling rates is shown in Fig.14. When the cooling rate is 3 ℃/s, the hardness increases from 320.2 HV to 364.2 HV as the stress increases from 0 MPa to -45 MPa; when the cooling rate is 6 ℃/s, the hardness increases from 356 HV to 389 HV as the stress increases from 0 MPa to -45 MPa; when the cooling rate is 10℃/s, the hardness increases from 0 MPa to -45 MPa,the hardness is increased from 398 HV to 415.4 HV.The results show that when the cooling rate is small,the effect of stress on the hardness value is significant,but not significant when the cooling rate is large. The hardness of the transformed pearlite structure increases in continuous cooling with increasing applied stress.It is because the lamellae bend significantly when the stress is high, and the lamellae flatness is very weak,which is conducive to improving the ferrite and cementite interface region. However, dislocation in the weak lamellar ferrite can only move in a short distance.When the cementite is encountered, the increase of the interface area increases the hardness due to its poor plasticity.
5 Conclusions
a) The thermal expansion curves under different cooling and different stress conditions are measured.The stress can accelerate the transformation process of pearlite. At the same cooling rate, with increased stress,the transformation process of pearlite accelerates, and the proportion of transformation of plastic strain in total strain increases at the end of transformation; at the same stress condition, as the cooling rate increases, the transformation of pearlite advances at the end of the transformation, the ratio of transformation plastic strain to total strain decreases.
b) The relationship between transformation plasticity parameterKand the stress is calculated by fitting, and the transformation plasticity model under different cooling rates is established. It is found thatKincreases with the increase of stress. Through simulation, two results are obtained, one is considering the transformation plasticity, and the other is not considering the transformation plasticity. The axial residual stress distribution at room temperature is uneven, the distribution of residual stress on the sample surface is more complex, which is more consistent with the actual working condition when considering the transformation plasticity, and the accuracy of the model is higher.
c) With the increased stress, the orientation and lamellae spacing of pearlite change from ordered,straight and uniform to disordered, bent and non-uniform; the average hardness of pearlitic structure transformed by continuous cooling increases with the increased stress applied.
Acknowledgements
The authors gratefully acknowledge Science and Technology Innovation Guidance Project of Inner Mongolia Autonomous Region “Research and Application of Key Technology of the third Generation High Strength Heavy Load Wear Resistant Heat Treatment Rail”.
杂志排行
Journal of Wuhan University of Technology(Materials Science Edition)的其它文章
- Comparative Case Study on Adhesion of Three Common Sizing Agents to Cotton and Polyester Yarns
- Effect of Outer Carbon Layer Thickness of Carboncovered N-doped Hollow Carbon Nanospheres on Its Electrocatalytic Performance
- Ceramification of Composites of MgO-Al2O3-SiO2/Boron Phenolic Resin with Different Calcine Time
- Natural Fresh Proteins Directed Hierarchically Porous Nitrogen-doped TiO2 as with High Performance as Photocatalyts and Electrode Materials
- Dynamic Adsorption of Toluene on Hierarchical Porous Carbons with Varying Pore Structure
- Self-propagating High-temperature Synthesis of Sm and Zr Co-doped Gd2Ti2O7 Pyrochlore Ceramics as Nuclear Waste Forms
