Microstructural Characteristics Analysis of PCE Copolymer from Methyl Allyl Polyethylene Glycol and Methacrylic Acid based on Determination of Monomer Reactivity Ratios
2021-04-16WANGZimingKANGYaxinPENGJingying
WANG Ziming, KANG Yaxin, PENG Jingying
(College of Materials Science and Engineering, Beijing University of Technology, Beijing 100124, China)
Abstract: The reactivity ratio of monomer and the microstructure of copolymer as polycarboxylate ether (PCE) superplasticizer were investigated. Polycarboxylate ethers (PCEs) were synthesized from methyl allyl polyethylene glycol (MAPEG, Mw=2 400 g/mol) and methacrylic acid (MAA) via aqueous free radical copolymerization in low conversion (P<20%). Gel permeation chromatography (GPC) and high performance liquid chromatography (HPLC) were used to track the residual concentration of the reactants and the amount of copolymer formed during the copolymerization. The reactivity ratios of monomers, MAPEG and MAA, were determined as r1(MAPEG) =0.0489 and r2(MAA) =1.6173, respectively, by employing the K-T and YBR methods.According to the obtained monomer reactivity results, the sequence distribution of the copolymer, the number average length of MAA in the polymerisate were found to decline with the decrease of the mole fraction of MAA in the polymerization system. As a result, the distribution of chain segments becomes narrower and the copolymer structure becomes more uniform. Therefore, uniform polymers could be obtained by slowly adding MAA monomer during copolymerization process.
Key words: reactivity ratio; polycarboxylate; K-T method; copolymer; sequence distribution
1 Introduction
Polycarboxylate ethers (PCEs) consisting of carboxyl-containing unsaturated monomers and macromonomers with long side chains are generally prepared by free radical polymerization. The steric hindrance induced from its long side chain and the electrostatic repulsion effect from the negatively changed main chain is the principal factors determining its dispersing property and retaining ability to cement particles[1]. The molecular structure of PCEs directly affects its water reduction performance, while the molar ratio, reactivity ratio and polymerization process of monomers directly affect the molecular structure of polymer[2]. Therefore,it is necessary to study the reactivity ratio of the monomers for copolymerization preparation of PCE. Presently, many studies are focused on the development of new type of PCE, the polymerization process, the relationship between structure and performance, application technologies and the compatibility with other raw materials of concrete[3-8]. The research about the kinetic parameters and the formation process of polymer structure during the polymerization of PCE is still lacking.
Yin DJ studied the monomer reactivity ratio of isoprenyl polyethylene glycol ether (IPEG) copolymerized with acrylic acid (AA), and discussed respectively the microstructure and chain distribution of IPEG and AA in the P(IPEG-co-AA) when the feeding ratio was 1: 2 and 1: 4. It was found that the copolymerization of IPEG and AA was non-ideal copolymerization, that is,there was no azeotropic point in the copolymerization process, and the composition of copolymers changed with the conversion ratio. The disordered copolymer was obtained by binary copolymerization[9]. Wang ZM studied the copolymerization of methyl allyl polyethylene glycol ether (MAPEG) and acrylic acid (AA) at low conversion. The data were processed by K-T method, and the results of the copolymer were obtained.Finally, using [HPEG]/ [AA] = 1/4 as an example, the chain segment sequence distribution and the chain link distribution of copolymer were calculated by using the reactivity ratio data. The results showed that MAPEG was basically not homopolymerized, but as a chain segment was inserted into the polyacrylic acid chain segment to form a comb like copolymer[10].
Based on the previous research, methyl allyl polyethylene glycol (MAPEG) with high activity and wide application was chosen as macromonomer, methacrylic acid (MAA) as small monomer, and ammonium persulfate as initiator to carry out copolymerization in aqueous solution with low conversion. The conversion of MAPEG and the residual concentration of MAA in the reaction system were determined by Gel Permeation Chromatograph (GPC) and High Performance Liquid Chromatography (HPLC), and then the composition of the monomers in the copolymer was obtained. According to the initial feed ratio of the monomers, the reactive ratio of the monomer was calculated by the K-T method, and then the change of the chain segment distribution of the copolymer was calculated and analyzed by the method of probability theory, which is aimed to provide guidance for further optimizing the molecular structure of P (MAPEG-co-MAA).
2 Experimental
2.1 Materials and equipment
MAPEG (HO-(CH2CH2O)n-CH2-C (CH3) =CH2,Mw=2 400 g/mol, >99%), MAA (CH2=C (CH3) COOH,Mw=86.09 g/mol, >99%), ammonium persulfate (APS,Mw=228.2 g/mol, >99%), hydroquinonequinol (HQ,Mw=40 g/mol, >99%) were used without further purification.
Agilent gel permeation chromatograph (PLGPC50, Britain) was equipped with PL aquagel-OH Mixed-H8μm, two aqueous GPC columns in series and coupled with three detectors, including differential refractive index detector(RI) (15° and 90°), laser light scattering detectors(LS) and viscosity detector(VIS).
Waters 1525 high performance liquid chromatography (HPLC, American) equipped with C18 5μm aqueous column and Model 2489 UV detector to track the contents of MAA during the copolymerization process.
2.2 Synthesis of polymer MAPEG-co-MAA polymer
Firstly, the deionized water and MAPEG were placed in a four-neck round bottom flask according to the experimental proportion that equipped with a stirrer, reflux condenser and thermometer. The flask was heated to 50 ℃ and kept at constant temperature,then stirred for 30 minute till all macromonomer was completely dissolved. Next, methacrylic acid (MAA),1% weight of the total amount of monomers (MAPEG macromonomer +MAA) of ammonium persulfate was added into the reactor at once, sampling after a period of reaction at this temperature. Thereafter, 0.01%hydroquinonequinol by mass of reactants was used to terminate the reaction. The resulting polymer was designated as P (MAPEG-co-MAA).
2.3 Characterization of polymers
2.3.1 Gel permeation chromatography (GPC)
Content and conversion of MAPEG, molecular weight and its distribution of synthesized PCE samples were determined by GPC with its aqueous columns in deionized water at 30 ℃ and a solvent flow rate of 1.0 mL/min in a PL-GPC50 apparatus.
The spectrum obtained from the GPC was analyzed on the basis of the bimodal concentration principle. It was found that when there are two peaks in the GPC spectrum, the concentration of the corresponding substances in the two peaks can be calculated according to the area of the calibrated peak. In turn, the remaining amount of macromonomer was calculated.
2.3.2 High performance liquid chromatography (HPLC)
The amount of residual monomers with low molecular weight (MAA) was detected via high performance liquid chromatography (HPLC), keeping column temperature at 30 ℃, and UV detection wavelength was 2.05×10⁻⁴mm. The mobile phase was 0.05 mol/L H3PO4(with NaOH to regulate pH value at 7.0)-acetonitrile (92:8 of the volume ratio), with the solvent flow rate of 1.00 mL/min.
According to the proportional relationship between the peak area and the concentration of the corresponding monomer in the HPLC spectrogram, the standard curve of the MAA was measured and then the methacrylic acid content as well as the residual amount in the PCE sample at each time period was determined.
3 Results and discussion
3.1 Determination of residual methacrylic acid concentration via HPLC
The amounts of unpolymerized residual methacrylic acid were calculated from calibration curves applying the external calibration method, and shown as follows:
A solution of 2.00×10⁻³mol/L methacrylic acid was prepared and diluted into a series of calibration solutions with a 92:8 mixture of H3PO4and acetonitrile as eluent, resulting in concentrations of 1.75×10⁻³mol/L, 1×10⁻³mol/L, 5.00×10⁻⁴mol/L, 2.00×10⁻⁴mol/L,1.00×10-4mol/L, and 5.00×10⁻⁵mol/L, respectively.Each concentration was measured 3 times via HPLC,and the average of all three measurements was recorded as the final result. The linear calibration curve for methacrylic acid could be obtained from six different concentrations based on the peak areas at each individual concentration.
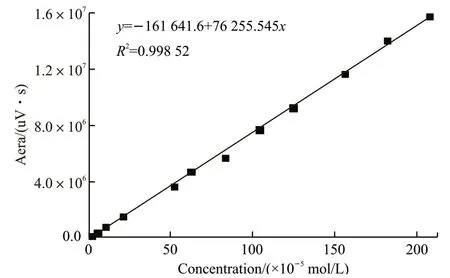
Fig.1 The standard curve of MAA
From the experiments mentioned above, the calibration curve of methacrylic acid is shown in Fig.1.The regression coefficient (R2) was above 0.99, which indicated that the fitting curve was sufficiently accurate to be used.
3.2 Monomer reactivity ratios of MAPEGMAA copolymerization system
3.2.1 Determination of copolymer composition curve
The copolymerization system was set to have a solid content of 40%. The molar fraction of the monomers in the feed and in the MAPEG-MAA copolymer as obtained from GPC and HPLC analysis are shown in Table 1. According to the data in Table 1, the feeding mole fraction of MAPEG (ƒMAPEG) and its molar fraction in the copolymer (FMAPEG) are calculated and plotted in Fig.2.
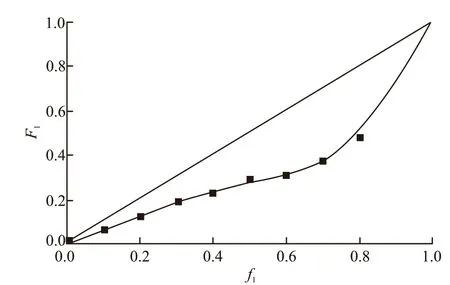
Fig.2 Curves about F1-f1 of MAPEG-MAA copolymerization
3.2.2 Monomer reactivity by the K-T and inverted K-T method
K-T method is an improved method for calculating reactivity ratios based on the Fineman-Ross equation[11].
The copolymer composition equation can be written as Eq.(1)[12]:

where, d [M1]/d [M2] represents the molar ratio of the two monomers in the actual copolymer composition and [M1]/ [M2] refers to the feeding molar ratio. The monomer reactivity ratios of monomersM1andM2can be expressed asr1=k11/k12andr2=k22/k21.
Ifρ= d[M1]/d[M2] andR= [M1]/[M2], then Eq.(1)can be rewritten as:


Table 1 Results of copolymer composition with different feeding monomer ratios
IfG=R(ρ-1)/ρandF=R2/ρ, the Eq.(2) can be written as:

Kelen and tüdos suggest a new linear method by introducing an arbitrary constant[11]:

By defining Eq.(4) can be rewritten as:


According to the data in Table 1, the diagrams drawn according to the K-T method (Fig.3(a)) and Inverted K-T methods (Fig.3(b)) are presented in Fig.3. The reactivity ratios for the copolymerization of MAPEG and MAA can be calculated from the slop and intercept of the linear lines. The reactivity ratios of MAPEG and MAA in MAPEG-MAA system are summarized in Table 2 by the K-T and Inverted K-T method.

Table 2 Reactivity ratios of MAPEG and MAA in MAPEGMAA system
3.2.3 Monomer reactivity by the YBR method
YBR method[9]is also an improved method based on the Fineman-Ross equation[13], and the YBR method equation is as follows:

The above equation is processed by the least square method and can be rewritten as:

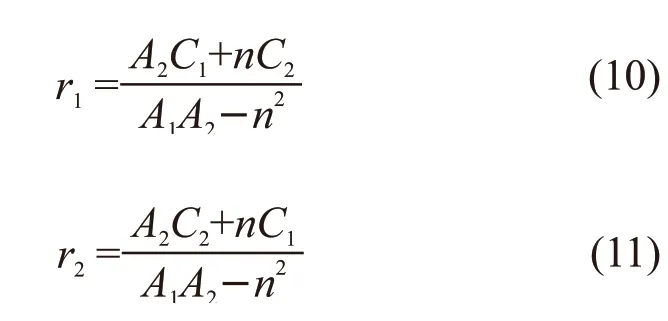
where, parametersA1,A2,C1, andC2were calculated from the data in Table 1, and were substituted into Eqs.(10) and (11) to calculate the reactivity ratio of the two monomers.
3.2.4 Results of monomer reactivity ratio
The reactivity ratios calculated by K-T methods and YBR method are listed in Table 2, respectively.
The results of reactivity ratios calculated by K-T method and YBR method are similar. The reactivity ratios of MAPEG and MAA can be determined by average of the two methods as follows:r1(MAPEG)=0.0489,r2(MAA)=1.6173. The reactivity rate of MAPEG is much less than 1.0, which means that it basically does not homopolymerize during copolymerization.

Fig.3 (a) η-ξ curve of K-T method (b) η-ξ curve of inverted K-T method
3.3 Copolymerization behaviors of MAPEGMAA system
From the Fig.2, it can be drawn that the copolymerization of MAPEG and MAA belongs to non-ideal copolymerization. An azeotropic point is not observed which suggests that the monomer composition in the copolymer cannot match up the feeding monomer composition. The copolymer composition changes with the conversion of monomer. TheF1-ƒ1curve is below the ideal copolymerization curve, which indicates that the molar ratio of MAPEG monomers in copolymer is always lower than the molar ratio of feeding, and with the increase of ƒ1, the deviation degree ofF1from the ideal copolymerization curve reaches the maximum at about ƒ1=0.7.
As shown in Table 2,r1(MAPEG)<<1 andr2(MAA)>1.These values imply that MAPEG possess almost no ability to homopolymerize, whereas MAA preferentially reacts with MAA active terminal groups. In other words, MAPEG is randomly inserted into blocks of polymethacrylic acid segments to form a comb copolymer during copolymerization.
3.4 Microstructure and segment distribution of copolymers in MAPEG-co-MAA
3.4.1 Distribution of segment sequence in MAPEG co-MAA
M1andM2represent two monomers, and ~~~M1·and ~~~M2· represent two chain radicals.
The addition polymerization of radical ~~~M1·and monomerM1andM2is a competitive reaction and the probability of forming ~~~M1M1· and ~~~M1M2·can be written as follows[12]:


AndP11=1-P12.
Similarly, the probability of forming ~~~M2M2·and ~~~M2M1· can be written as follows:
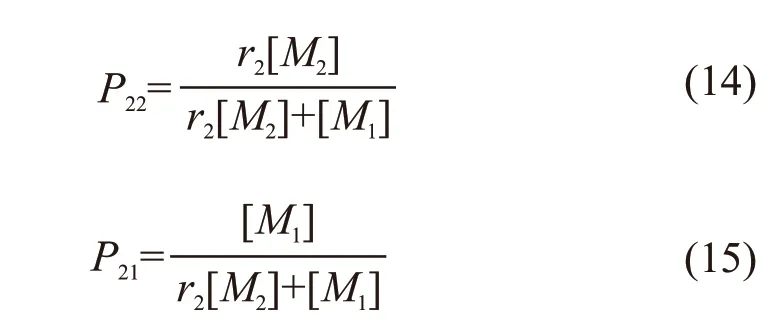
AndP22=1-P21.
Then the distribution functions of formingxM1(PM1)xandxM2(PM2)xare as follows:

For the MAPEG-MAA copolymerization system,when the initial molar ratio of two monomers are [M1]/[M2] =1/2 and [M1]/ [M2] =1/4, bringr1(MAPEG)=0.04235 andr2(MAA)=1.63105 into Eqs.(16) and (17) to calculate the percentages of segments of 1M1, 2M1, 3M1··· and 1M2, 2M2, 3M2···· in the total number of segments ofM1andM2. The distribution curves of chain segments are shown in Fig.4(a), Fig.4(b), and Fig.4(c), respectively.

Fig.4 (a) Segment sequence distribution of MAPEG (1-5 chain length); (b) Segment sequence distribution of MAPEG (1-50 chain length); (c)Segment sequence distribution of MAA (1-50 chain length)

Fig.5 (a) Chain link distribution of MAPEG (1-5 chain length); (b) Chain link distribution of MAPEG (1-50 chain length); (c) Chain link distribution of MAA (1-50 chain length)
According to Fig.4, the probability ofxMAPEG andxMAA decreases with the increase of chain length,and the sequence distribution ofxMAPEG is narrower than that ofxMAA. The higher the content of MAA in the monomer ratio, the lower the probability of the distribution of MAA as a single monomer unit in the copolymer, and the polymer sequence gradually transits to the copolymer sequence. In addition, when [M1]/[M2]=1/4, the probability of the occurrence of MAA lower than targeted acid-ether ratio(4.0) is 35.0%, and the probability of the occurrence of MAA with no more than 10 monomer chain segments is 76.2%. When [M1]/[M2]=1/2, the probability of the occurrence of MAA lower than targeted acid-ether ratio (2.0) is 23.6%, and the probability of the occurrence of MAA with no more than 10 monomer chain segments is 93.2%, and the probability of the occurrence of MAA with more than 20 monomer chain segments is less than 1.0% (a probability of less than 1.0% is practically meaningless). It can be assumed that macromonomer has the tendency to homopolymerize theoretically in the case of less MAA presented for reaction.
3.4.2 Distribution of chain link in MAPEG-co-MAA polymer
According to the deduction in polymer chemistry about “Microstructure and Segment Sequence Distribution of Binary Copolymers”[12], the number average length ofxM1can be written as:

Similarly, the number average length ofxM2can be written as:

From the probability theory, the fraction of the number ofM1units in thexM1to the total number ofM1units is:

Similarly, the fraction of the number ofM2units in thexM2to the total number ofM2units is:

The total number of single units can be calculated from Eqs.(18) and (19). According to Eqs.(20) and (21),when [M1]/ [M2] =1:4 and [M1]/ [M2] =1:2, the distribution curves of chain segments are shown in Figs.5(a)-5(c).
When [M1]/ [M2] =1/2 and [M1]/ [M2] =1/4, the number average length ofxMAPEG andxMAA are calculated as follows:Therefore, reducing the feed of MAA can reduce the average block length of MAA in the polymerisate and increase the average block length of MAPEG in the polymerisate.
As can be seen from Fig.4, when [M1]/ [M2] =1/2,the chain segments of MAA are dominated by the length of 2 to 8 monomer units. Among them, the number ofM2units in 4M2or 5M2segments accounts for the largest percentage of the total number of monomers in 100 segments, about 9.94%, which is equivalent to the peak ofM2chain distribution curve, and MAPEG mainly exists in a single unit, When [M1]/ [M2] =1/4,the chain segments of MAA are dominated by the length of 4-10 monomer units. Among them, the number ofM2units in 7M2or 8M2segments accounts for the largest percentage of the total number of monomers in 100 segments, about 5.30%. The less the content of MAA in monomer ratio, the narrower the distribution of the copolymer chain, the more favorable the formation of more uniform copolymer sequence.
4 Conclusions
The reactivity ratios and the copolymerization behaviors of MAPEG and MAA at 50 ℃ were theoretically investigated in MAPEG-MAA copolymerization system. The sequence distribution of MAPEG and MAA in the P(MAPEG-co-MAA) chain was calculated based on reactivity rate. The main conclusions are as follows:
a)The reactivity ratios of MAPEG-2400 and MAA in the polymerization system werer1(MAPEG)= 0.0489,r2(MAA)=1.6173.
b)The copolymerization reaction of MAPEG and MAA was found to be non-ideal copolymerization by copolymer composition curve. The comb like MPEGco-MAA copolymer with non-uniform distribution of side chains was formed by inserting MAPEG into blocks of polymethacrylic acid segments during the polymerization process.
c)The sequence distribution rules of chain segments and chain unit in P(MAPEG-co-MAA) vary with the initial molar ratio of monomer feed. When [M1]/[M2] =1/2 and [M1]/ [M2] =1/4, the average length of xMAA in copolymer isrespectively, while the probability of MAPEG as a single chain in copolymer are more than 95%.
杂志排行
Journal of Wuhan University of Technology(Materials Science Edition)的其它文章
- Experimental Study on Viscosity Characteristics of Expanding Polymer Grout
- Thermal-responsive Photonic Crystals based on Physically Cross-linked Inverse Opal Nanocomposite Hydrogels
- Evalution of Thermal Oxidative Degradation of Trimethylolpropane Trioleate by TG/DTA/DSC
- Transformation Characteristics and Microstructure of Rail under Low Stress during Continuous Cooling
- Formation Mechanism and Existing Form of Sb in Heat Resistance Mg-Gd-Y-Sb Alloy
- Rapid Dendrite Growth in Solidification of Highly Undercooled Alloys
