Energy Consumption Prediction of a CNC Machining Process With Incomplete Data
2021-04-13JianPanCongboLiSeniorMemberIEEEYingTangSeniorMemberIEEEWeiLiMemberIEEEandXiaoouLiSeniorMemberIEEE
Jian Pan, Congbo Li, Senior Member, IEEE, Ying Tang, Senior Member, IEEE,Wei Li, Member, IEEE, and Xiaoou Li, Senior Member, IEEE
Abstract—Energy consumption prediction of a CNC machining process is important for energy efficiency optimization strategies. To improve the generalization abilities, more and more parameters are acquired for energy prediction modeling. While the data collected from workshops may be incomplete because of misoperation, unstable network connections, and frequent transfers, etc. This work proposes a framework for energy modeling based on incomplete data to address this issue. First,some necessary preliminary operations are used for incomplete data sets. Then, missing values are estimated to generate a new complete data set based on generative adversarial imputation nets(GAIN). Next, the gene expression programming (GEP)algorithm is utilized to train the energy model based on the generated data sets. Finally, we test the predictive accuracy of the obtained model. Computational experiments are designed to investigate the performance of the proposed framework with different rates of missing data. Experimental results demonstrate that even when the missing data rate increases to 30%, the proposed framework can still make efficient predictions, with the corresponding RMSE and MAE 0.903 kJ and 0.739 kJ,respectively.
I. INTRODUCTION
WITH the increase in energy costs of the manufacturing industry, the energy conservation of the CNC machining process has attracted international attention [1]. As a basis for an efficient and achievable energy efficiency optimization strategy, predicting the energy consumption of CNC machining is an urgent issue that needs to be resolved[2]. However, due to many uncontrollable factors, such as random error and missing values of observed samples, there are significant challenges in energy consumption modeling.
Existing energy modeling methods can be classified into three categories: theoretical methods, experimental statistical methods, and data-driven methods. Theoretical methods are based on physical modeling of energy characteristics [3]–[7].With experimental statistical methods, the experimental data are used to obtain mapping relationships between energy and machining parameters [8], [9]. Because of leaving aside the configuration parameters (i.e., workpieces and cutting tools),both the experimental and theoretical methods are insufficient if any change occurs to machining configurations.Fortunately, the development of sensor technology and the internet of things (IoT) allows us to collect more parameters for energy modeling. However, the increase in dimension of the parameters used means a higher computing complexity of modeling. Data-driven techniques make it possible to turn a huge amount of data into actionable information. As such methods have been broadly investigated in scientific studies,such as fault diagnosis [10], [11], and quantitative finance[12], offering new alternatives for the modeling of the machining processes [13], [14]. Examples of data-driven methods for energy modeling are reported in several studies,including Gaussian process regression (GPR) [15], gene expression programming [16], support vector regression(SVR) [17], etc. However, all of these previous approaches assume that the utilized datasets are complete, aim at improving forecast accuracy. They are usually insufficient for incomplete datasets that contain missing values.
Missing data is common in energy modeling, which caused incomplete datasets, characterized by the absence of values in machining and configuration parameters. This issue makes three areas of difficulties for energy modeling, i.e., complicated data process procedures, low efficiency, and significant bias [18]. Many studies on missing data have already been reported, such as fault diagnosis [19], wind power prediction[20], and business registration [21]. This is an unavoidable problem, and all of these reported works indicate that missing values are common in many areas.
Common approaches used to deal with missing data can be divided into two strategies, one is by discarding the missing parts (Deletion methods) [22], [23], while the other involves adopting imputation methods. In most cases, data imputation is more efficient, as an alternative to avoiding data deletion.The reported imputation methods can be generally grouped into statistical analysis based methods, model-based methods,and neural network (NN) based methods. For statistical analysis based methods, such as the k-nearest neighbor (k-NN) imputation [24] and mean imputation [25], [26], they generate a single estimated value based on observation statistics. While in model-based methods, such as multivariate imputation with chained equations (MICE) [27], [28] and MissForest (MF) [29], simple regression models are adopted to generate replacement values [30], [31]. Where factors of interest are complication related, both the statistical analysis based and model-based methods may produce biased results.Since energy consumption has a strong non-linear relationship to machining parameters and configuration parameters [32],there is a significant challenge for the data imputation process.Fortunately, NN based imputation methods make it possible to reduce biased outcomes in such an issue [33]–[35]. In these works, generative adversarial imputation networks (GAIN), a GAN-based method, producing less biased results than others[36]. The unique hint mechanism of GAIN ensures that the limited observed data are fully utilized to learn the true data distribution even when faced with complicated problems.
Motivated by the discussions above, a novel framework based on GAIN and GEP is proposed for energy consumption modeling in the presence of missing data. Specifically, GAIN is used to implement missing data imputation. The GEP model is taken into account for energy modeling, as it successfully predicts many complex problems [16], [37]–[39] and has excellent capabilities in display modeling [40], [41]. Moreover, the proposed framework also contains the necessary preliminary operations and model evaluations. The motivations and contributions of this work can be summarized as follows.
1) We analyze the missing data and missing mechanisms in the acquired raw data set and propose an effective framework.These new works make it possible to model the energy consumption of the CNC machining process based on incomplete data.
2) We derive general and useful tips for utilizing the incomplete data sets. The performances of different methods(missing values processing and modeling for incomplete data)under different conditions provided in this article help readers choose a better method in specific applications.
3) Missing values of different parameters, missing patterns,and their impacts on predictive accuracy are investigated.Such an investigation gives readers a new perspective for evaluating the impact of each parameter on energy consumption, and contributes to determining key parameters in data acquisition.
The rest of the paper is organized as follows. Section II describes the incomplete data in energy modeling for the CNC machining process. The framework for energy consumption modeling based on incomplete data is explained in Section III.Section IV provides experiment results and discussions.Finally, Section V gives the conclusions and future work.
II. DESCRIPTION OF INCOMPLETE DATA OF ENERGY CONSUMPTION MODELING
In this section, a description of incomplete data in energy modeling is presented. First, major parameters and collection methods are illustrated in Section II-A. Based on this, missing data and missing mechanisms in energy prediction modeling are then discussed in Section II-B.
A. Major Parameters and Data Acquisition
The characteristic curve and the major factors of energy consumption for the CNC machining process are presented in Fig. 1. Energy consumption is mostly affected by processing parameters and machining configurations (workpiece, cutting tool, and cooling conditions). Taking the CNC turning process as an example, as indicated in Table I, several parameters should be collected for energy modeling [32]. Given that cooling conditions have little effect on energy consumption,they can be ignored [7]. Therefore, the energy consumption model for the CNC turning process can be presented as

where E is energy consumption, Pstis the standby power, Puis the unload power, Pcutis the cutting power, Pais the additional loss power, t is the cutting time.

Fig. 1. The characteristic curve and major factors of energy consumption of the CNC machining process.

TABLE I NECESSARY PARAMETERS OF ENERGY MODELING FOR CNC TURNING PROCESS
Fig. 2 illustrates an overall framework for the collection of raw parameters through sensor and network technology. The collecting methods can be classified into three types as follows. 1) The machining parameters are acquired and transmitted to the energy efficiency monitoring system(EEMS) by accessing the CNC system. 2) The configuration parameters are extracted from the manufacturing execution system (MES). 3) The energy consumption in real-time is captured by the power sensor installed on the machine tool.

Fig. 2. Hardware platform and information flow in data acquirement platform.
B. Missing Data and the Missing Mechanism
The quality of collected data for energy modeling is uncontrollable, and a common problem is missing data in acquired parameters, resulting in a considerable obstacle for the prediction model. As shown in Fig. 2, the obtained data in the database is incomplete, and through observing these missing components, the reasons for the absence of data can be summarized as follows.
1) The automatic extraction of machining parameters relies on the information obtained from the NC system. The machining process is conducted in a harsh environment with various electromagnetic interferences, which causes communication between the EEMS and the NC system to be unstable.This uncertain data transmission process, resulting in data obtained from the NC system may have deviations. While inaccurate information leads to the extracted machining parameters being empty or illogical.
2) The acquisition of configuration parameters depends on the machining plans released by MES. These schemes are generally inputted manually and transferred frequently,leading to human error and missing values. Thus, the data collected for configuration parameters are more likely to be deficient and inaccurate.
Having missing data seem to be inevitable and irregular,resulting in the loss of original information, which hampers data utilization [42]. To address this issue, figuring out missing mechanisms is a critical link [43]. The following definitions provide the background required to understand the mechanism that addresses missing data. A complete dataset X can be defined as a labeled instance, which is represented by a vector of N continuous or discrete parameters. Each set of parameters belongs to the predictive target: [p1, p2, p3,…, pl] ∈Plabel.

where firepresents the i-th parameter. Define the mask vector M, which represents the missing components. Suppose that F* = F∪*, and “*” represents the missing values. Thus, M(N × l) can be calculated by

where Fobsand Fmissare the observed parts of the dataset, and instances with missing values, respectively. “ ⊗” denotes the element-wise multiplication.
In most cases, the appropriate strategy to deal with missing data depends on how the values of Fmissbecome missing. The missing mechanisms commonly have three cases, which are,missing completely at random (MCAR), missing not at random (MNAR), and missing at random (MAR) [44]. When data are MCAR, they are unrelated to acquired parameters.The MNAR mechanism occurs if data missing is related to the unobserved data. Unlike MNAR, MAR only depends on the observed data. In the energy modeling data, the observation of one parameter will not affect the others, for instance,machining parameters, workpiece information, and cutting tool information are completely independent. Furthermore,since there are no obvious characteristics, these parameters are missing at random with the data collection. Based on the above analysis, missing data in energy modeling can be considered as an MCAR mechanism.
III. ENERGY CONSUMPTION MODELING BASED ON INCOMPLETE DATA
The purpose of this section is to introduce the framework for energy modeling based on incomplete data, as shown in Fig. 3. Firstly, preliminary operations are conducted for incomplete data. Then, the GAIN strategy for estimating the missing values takes place, generating a new complete data set. Next, the generated data set is used to develop an energy model using GEP. Finally, we evaluate the predictive results of GEP models.
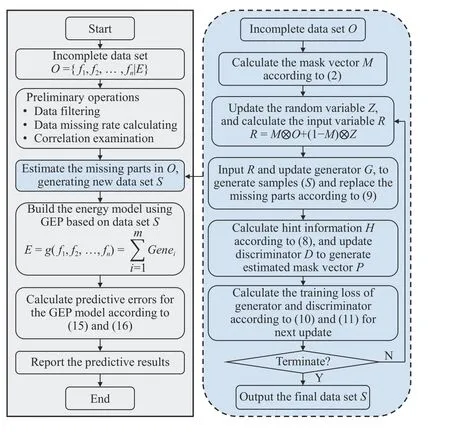
Fig. 3. The framework for energy consumption modeling with incomplete data.

Fig. 4. The basic structure of the used GAIN.
A. Preliminary Operations
Preliminary operations for energy modeling data are an essential preparatory step for implementing the imputation approach. There are three main steps, including data filtering,data missing rate calculating, and correlation examination.
1) Data Filtering: Data filtering plays a significant role in the results of data imputation. This process determines the data which need to be imputed, by identifying illogical values.These illogical data are removed and marked as missing components.
2) Data Missing Rate Calculating: To describe the missing extent of the acquired dataset, the data missing rate (βt) and the percentage of parameters which contain missing values (βv)are defined. It can be assumed that the number of parameters with missing values is h (0 ≤ h ≤ l), where the total number of parameters is Nm. So, βtand βvcan be expressed as follows,respectively:

3) Correlation Examination: Correlation examination of the parameters is a common step in data analysis, as it gives a better understanding of the data. In this problem, Pearson correlation coefficients are used to identify the correlation between the different parameters (fi) and the predictive target(p), which can be calculated by

B. Missing Data Imputation Based on GAIN
Since the GAIN method attempts to reduce the uncertainty of the estimates by making full use of the observed values,here, it is adopted to estimate the missing portions of energy modeling data. Fig. 4 depicts the basic structure of the used GAIN, where both D and G are modeled as fully connected layers. The generator (G) imputes the missing components conditioned on what is observed in incomplete data O and outputs a completed data set S. The discriminator (D) is used as an adversary to train G, attempting to distinguish which components are observed or imputed. Besides, hint information H ensures that G learns to generate according to the true data distribution, which can be calculated by

where ΓG(M, P) is determined by (10), and δ is the feedback coefficient.
In energy modeling, there is considerable variation in the impact of each input parameter on energy consumption, and we hope that the estimation error of important parameters to be as small as possible. Here, weights of estimation errors for various parameters are redistributed, and there are two major steps. First, we use (7) to evaluate the correlation between each parameter and energy consumption based on the observed parts of O. Then, calculate the relative weight coefficient for each parameter based on these correlations. So,ΓM(M, S, O) can be redefined as (12), which will apply to the observed components (mij= 1, mij∈M).

where wiis the relative weight coefficient of the i-th parameter, sijis the output values of G, and oijis the value of the incomplete origin data O.
In summary, the detailed learning algorithm is described as Algorithm 1.
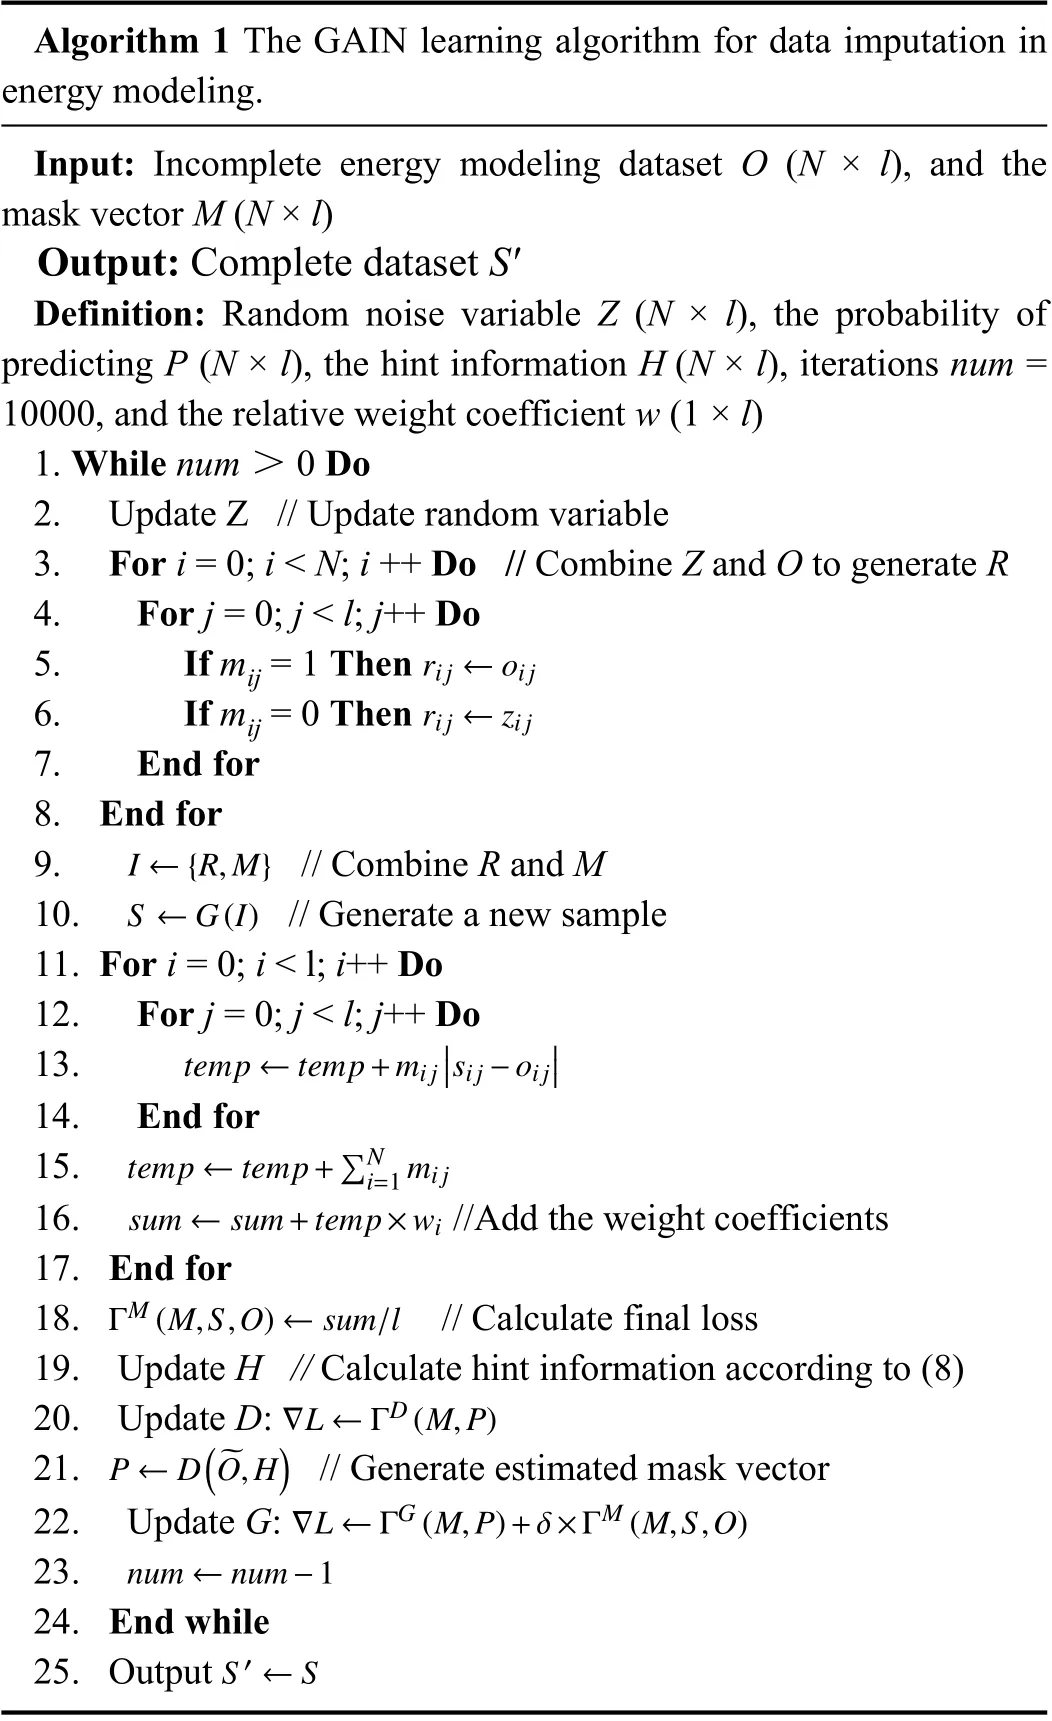
Algorithm 1 The GAIN learning algorithm for data imputation in energy modeling.Input: Incomplete energy modeling dataset O (N × l), and the mask vector M (N × l)Output: Complete dataset S'Definition: Random noise variable Z (N × l), the probability of predicting P (N × l), the hint information H (N × l), iterations num =10000, and the relative weight coefficient w (1 × l)1. While num > 0 Do 2. Update Z // Update random variable 3. For i = 0; i < N; i ++ Do // Combine Z and O to generate R 4. For j = 0; j < l; j++ Do rij ←oi j 5. If mij = 1 Then 6. If mij = 0 Then 7. End for 8. End for I ←{R,M}rij ←zij 9. // Combine R and M S ←G(I)10. // Generate a new sample 11. For i = 0; i < l; i++ Do 12. For j = 0; j < l; j++ Do temp ←temp+mij■■■sij −oij■■■13.14. End for temp ←temp+∑N i=1 mij 15.16. //Add the weight coefficients 17. End for sum ←sum+temp×wi ΓM(M,S,O)←sum/l 18. // Calculate final loss 19. Update H // Calculate hint information according to (8)∇L ←ΓD(M,P)20. Update D:P ←D(~O,H)21. // Generate estimated mask vector∇L ←ΓG(M,P)+δ×ΓM(M,S,O)22. Update G:23.24. End while S′←S 25. Output num ←num−1
C. Energy Consumption Modeling Using GEP
After the data imputation process, the generated new data set is used for energy prediction modeling. Here, the GEP is taken into consideration to explore the complex mapping relation- ships between energy consumption and parameters,as it has a larger capacity to display a declaration of the connection between input and output [37]. Suppose the input parameters are {f1, f2, ... , fn}, and the output is E, then the energy prediction model can be expressed as

where Geneirepresents the i-th gene expression, m is the total number of genes.
To train a GEP model, there are five steps which define the algorithm search space and determine the quality and speed.These steps are described as follows.
1) Determine the fitness function f, where (14) gives the expression used in this study.

where ficorresponds to the fitness value of the i-th chromosome, C(i, j) is the value of i-th individual for fitness case j, Tjis the real value of fitness case j and Ntis the number of the training data.
2) Select terminal set T and function set F for generating the chromosomes. T includes the inputs {f1, f2, ... , fn}, while F contains four basic arithmetic operators and the commonly used mathematical functions.
3) Chose the chromosomal architecture, that is the gene number and the head length of a gene.
4) Select the linking function. Such as “Addition”,“Multiplication”, etc.
5) Adopt a combination of the entire genetic operator as a set of genetic operators, including the general genetic operators, and the genetic operators of constants.
D. Model Evaluation Indicators
Two metrics are used to evaluate the performance of the trained prediction models, including the root mean square error (RMSE) and the mean absolute error (MAE).

IV. ExPERIMENTS AND DISCUSSIONS
First, we test performance of the proposed framework under different data missing rates. Then, to evaluate the performance of the used GAIN and GEP method, we conduct a lot of comparative studies in the comparative study. Next, the proposed framework is used to study the impacts of data missing patterns and missing values of different parameters onpredictive results. Finally, the performance of the proposed framework and the findings in the experiments are summarized and discussed. Note that the data set used for these experiments were collected from an actual CNC machine manufacturing enterprise. Also, the used GAIN algorithms and GEP methods are performed on a desktop with Intel(R) Core (TM) i7-8750H 2.20 GHz, 16 GB RAM,Windows 10 operating system, Python 3.6 programing language.

TABLE II DESCRIPTIVE STATISTICS OF THE ExPERIMENTS DATA SET
A. Incomplete Datasets
The data in this experiment used for training and testing include 620 samples, which are acquired in the practical dry cutting process of CNC turning. Here, the experimental data can be regarded as complete without any missing values and errors, as shown in Table II, it includes cutting speed vc, feed rate f, depth of cut ap, workpiece diameter wd, workpiece hardness wh, cutting length l, tool rake angle tr, and the energy consumption E. To simulate the real mechanism of the acquired data in energy modeling, an effective way is to artificially remove values in the complete data set [45]. In such a way, the difference between the imputed value and the original value could be determined easily. In this problem, to study the performance of the proposed framework on different conditions, we randomly remove 0%, 5%, 10%, 15%, 20%,25%, and 30% of the observed dataset to generate seven incomplete data sets. It is worth mentioning that anything above 30% may make it too difficult to obtain accurate results[20].
B. Energy Modeling Based on Incomplete Data
In this part, the proposed framework was utilized to model the data sets described in Section IV-A.
1) Preliminary Operations
Before data imputation, the described preliminary operations for incomplete data were applied in these generated experimental data sets. The specific steps are described as follows.
a) Data filtering: A small amount of error data was deleted and replaced by null so that it could be reassigned through the imputation process.
b) Check the missing rates of each dataset: Here, to evaluate the performance of the proposed framework in different cases, βtwas set as a series of given values. Besides,βvof each data set is greater than 16.7% (multiple parameters have missing values).
词汇选择(Lexical choice)是批评话语分析中用到的基本分析工具。梵迪克认为,词汇选择可以反映人们话语中隐藏的观点及意识形态。(Van Dijk 1988: 177) 因此,词汇选择的研究对批评话语分析具有很大的价值意义。
c) Correlation examination: The Pearson correlation coefficients have been calculated to understand the influence of various parameters on energy consumption preliminary.
2) Missing Data Imputation Based on GAIN
Following the completion of preliminary operations of the incomplete datasets, the implementation of the GAIN method has taken place. The specific parameters of the used GAIN algorithm in this problem are set as {Epochs: 10000, the hint coefficient: 0.5, and the feedback coefficient: 5 ~ 20}. Also,the generator and the discriminator of GAIN were realized by two MLPs, respectively, and the adopted parameters are given in Table III. In each training, the estimated loss for each parameter is reallocated according to the correlation before the imputation process. After implementing data imputation, the Pearson correlation coefficients have been recalculated to assess the correlation between parameters and energy consumption. The summary of mean results at different missing rates is represented in Table IV. It is indicated that the results are fairly close before and after imputation, which means that the GAIN approach is strictly determined according to the observed data.

TABLE III THE ADOPTED PARAMETERS OF THE GENERATOR AND THE DISCRIMINATOR OF THE USED GAIN METHOD
3) Energy Consumption Modeling Using GEP
Following the imputation process, these newly generated data sets were used to build prediction models. {vc, f, ap, wd, l,wh, tr} and E are taken as input and output of GEP training,respectively. Moreover, to obtain the optimal solution, ten common operations were used, and “Addition” was considered as the linking function to combine each gene program. Thus, the terminal set T and function set F of the used GEP method can be given as follows:

where +,-, *, / are four basic arithmetic operators, and S, C,T, Q, R represent sin(x), cos(x), tan(x), sqrt(x), and x2,respectively, x represents an optional parameter.

TABLE V THE SPECIFIC PARAMETERS OF THE USED GEP METHODS
Determining the specific parameters of the GEP is a critical step, which has a significant influence on the predictive results. Here, the ranges of the key parameters are presented in Table V. In training, the probabilities of genetic operations are set according to the predictive accuracy, and parts of them were fine-tuned for different datasets to obtain the best solutions.
4) Predictive Results at Different Missing Rates
Once the above three steps were completed, we obtained the forecast models for the seven different data sets, which are given as (19)–(25).
Data missing rate is 0%:
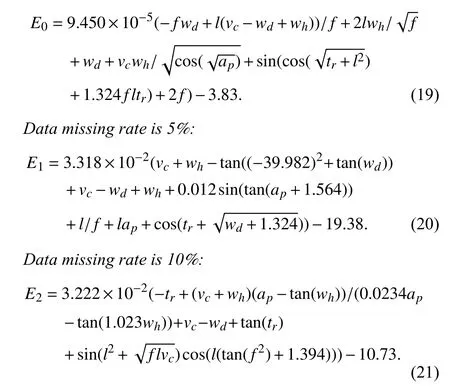
Data missing rate is 15%:
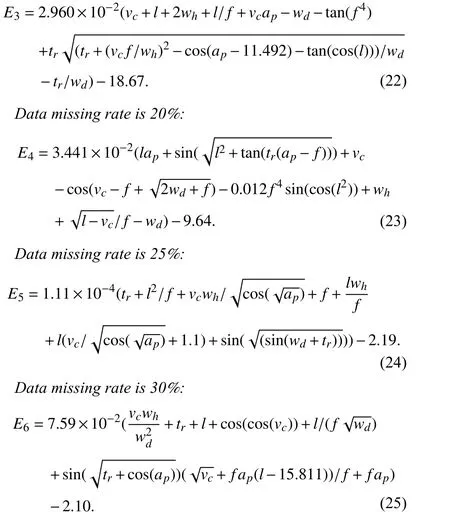
Then, the test data was used to check out the predictive accuracy, and the used evaluation indicators are RMSE and MAE described in Section III-D. The predicted results of energy consumption at different data missing rates are presented in Fig. 5. For each case, the scatters depict each prediction, and the predictive errors (MAE and RMSE) are listed in the figure. The line y = x is plotted to help the determination of the variation of predictive accuracy. As shown in Fig. 5, when βtincreases from 0% to 30%, the MAE increases from 0.506 kJ to 0.739 kJ, and the RMSE increases from 0.609 kJ to 0.903 kJ. It indicates that more missing values would result in greater predicted uncertainty.
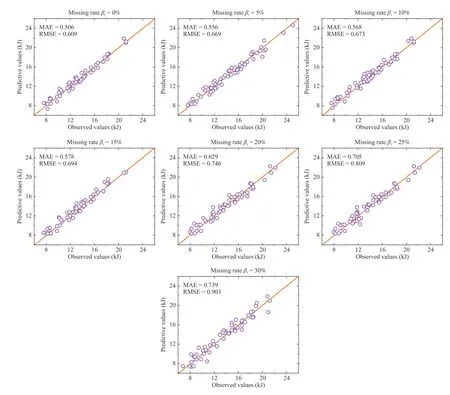
Fig. 5. The predictive results of GEP models with different missing data.
C. Comparative Study
Comparison of different missing data processing methods and different modeling methods were conducted in this section. We compared the GAIN with three commonly used approaches (Deletion method, k-NN, and MICE) under different data missing rates. Also, support vector regression(SVR) and response surface method (RSM) were compared with GEP models.
1) Comparison of Different Missing Data Processing Methods
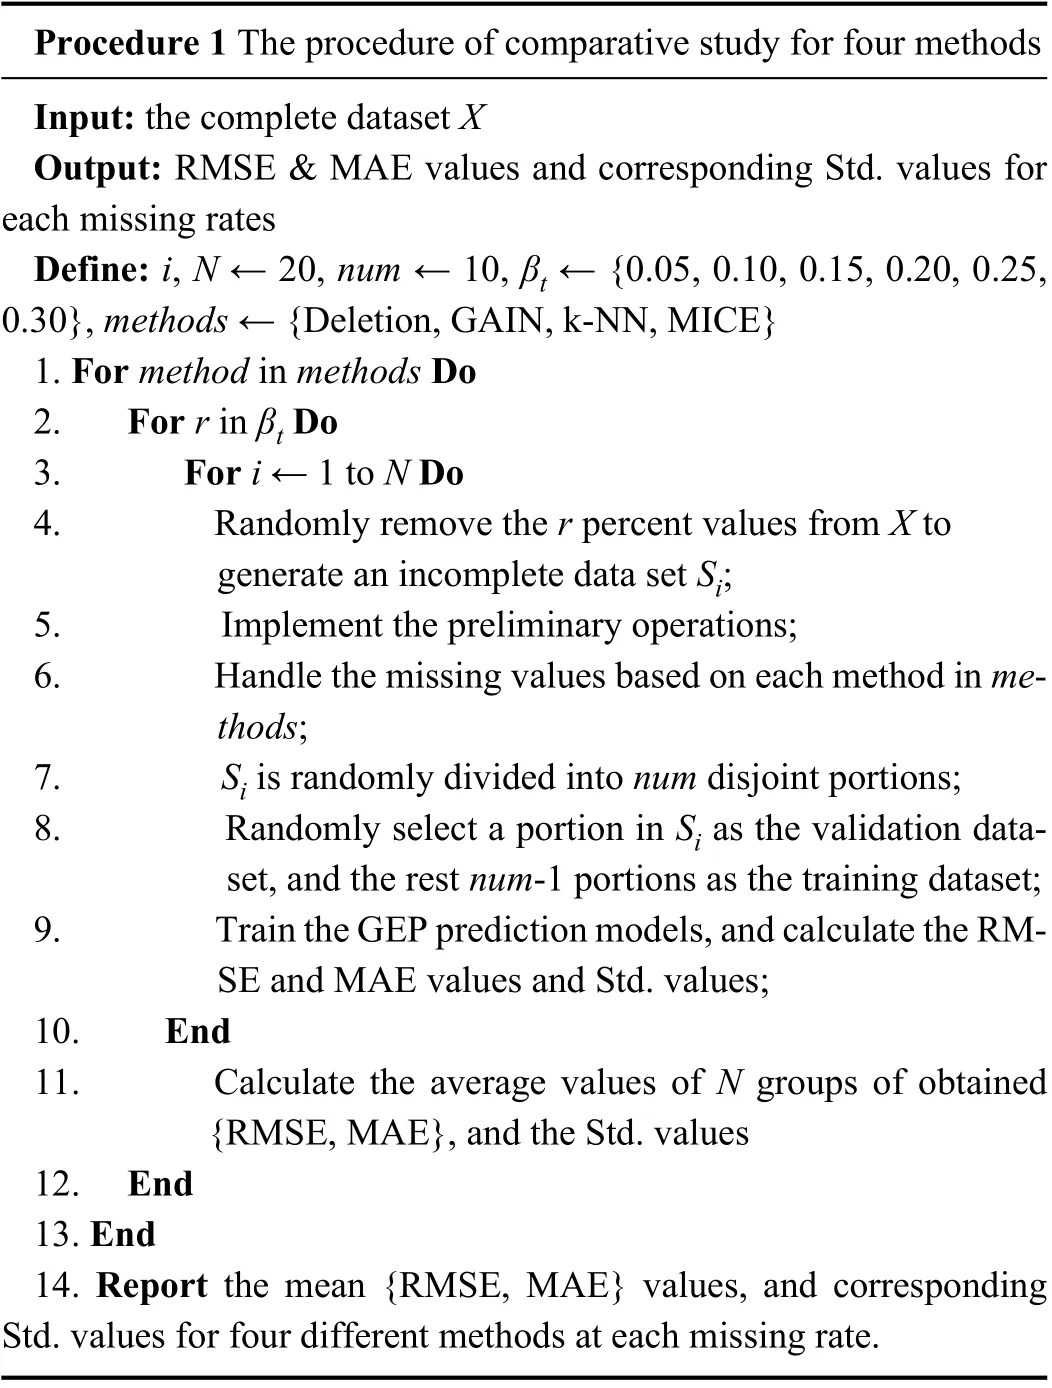
In this part, three commonly used methods for handling the incomplete data were considered in the comparative study,including the deletion method, k-NN imputation, and MICE method. The deletion method directly discards data rows of the samples that contain missing values, and another two methods replace the missing data with imputed values through different strategies. k-NN is a popular tool for value prediction and it has widespread applicability in imputation which replaces missing values with the corresponding value from the nearest-neighbor value. If the nearest-neighbor value is also missing, then the next nearest value will be used in this experiment. The MICE algorithm, as a regression-based approach, avoids bias in the results by fitting a series of regression models in the dataset. Here, we divide the experiments into six different sets by varying the data missing rates (βt= 5%, 10%, 15%, 20%, 25%, 30%). For each trained model, the mean {RMSE, MAE} values, and the corresponding standard deviations were calculated. The experimental procedure is represented as Procedure 1.

Fig. 6. Mean test errors for GEP models based on Deletion method, GAIN, k-NN, and MICE.
Procedure 1 The procedure of comparative study for four methods Input: the complete dataset X Output: RMSE & MAE values and corresponding Std. values for each missing rates Define: i, N ← 20, num ← 10, βt ← {0.05, 0.10, 0.15, 0.20, 0.25,0.30}, methods ← {Deletion, GAIN, k-NN, MICE}1. For method in methods Do 2. For r in βt Do 3. For i ← 1 to N Do 4. Randomly remove the r percent values from X to generate an incomplete data set Si;5. Implement the preliminary operations;6. Handle the missing values based on each method in methods;7. Si is randomly divided into num disjoint portions;8. Randomly select a portion in Si as the validation dataset, and the rest num-1 portions as the training dataset;9. Train the GEP prediction models, and calculate the RMSE and MAE values and Std. values;10. End 11. Calculate the average values of N groups of obtained{RMSE, MAE}, and the Std. values 12. End 13. End 14. Report the mean {RMSE, MAE} values, and corresponding Std. values for four different methods at each missing rate.
Based on the given experimental procedure, the above methods were used to deal with the incomplete data, then train a series of new models by using GEP. The final results for the test set of each method are the average of predictions across all models. To make a quantitative comparison of these methods, predictive errors are given out. Fig. 6 displays the mean test errors of energy consumption with different degrees of missing values. Results show that GAIN has the best predictive performance, followed by MICE and k-NN imputation. As expected, the deletion method has poor performance missing lots of useful information. The issue of the deletion method is amplified especially when data sets are limited.
2) Comparison With Other Modeling Methods
To illustrate the capability of GEP models, their results were compared with two generally used methods (SVR and RSM)based on the GAIN strategy. SVR has been extended extensively and applied in a large number of science fields,such as financial forecasting [46], and material properties prediction [47]. In this problem, SVR models are obtained by the corresponding function of the Sklearn toolbox, and the RSM method is coded in Python programming language.The specific parameters used in the SVR models are set in Table VI. To evaluate the performance of the three modeling methods, a ten-fold cross-validation method was used. Fig. 7 shows the mean test errors of each method. Results show that the RSM model with larger mean MAE and RMSE values provides less accurate results compared with other approaches. The performances of prediction models generated by SVR and GEP are close in the experiments.

TABLE VI THE SPECIFIC PARAMETERS OF THE USED SVR METHOD
D. Impacts of Missing Patterns and Missing Values of Parameters on Predictive Accuracy
Studying the effect of missing values of different parameters and different missing patterns on predictive results is the main purpose of this section.
1) Influence of Missing Values of Different Parameters on Predictive Accuracy

Fig. 7. Mean test errors for energy prediction by using GEP, RSM, and SVR methods.
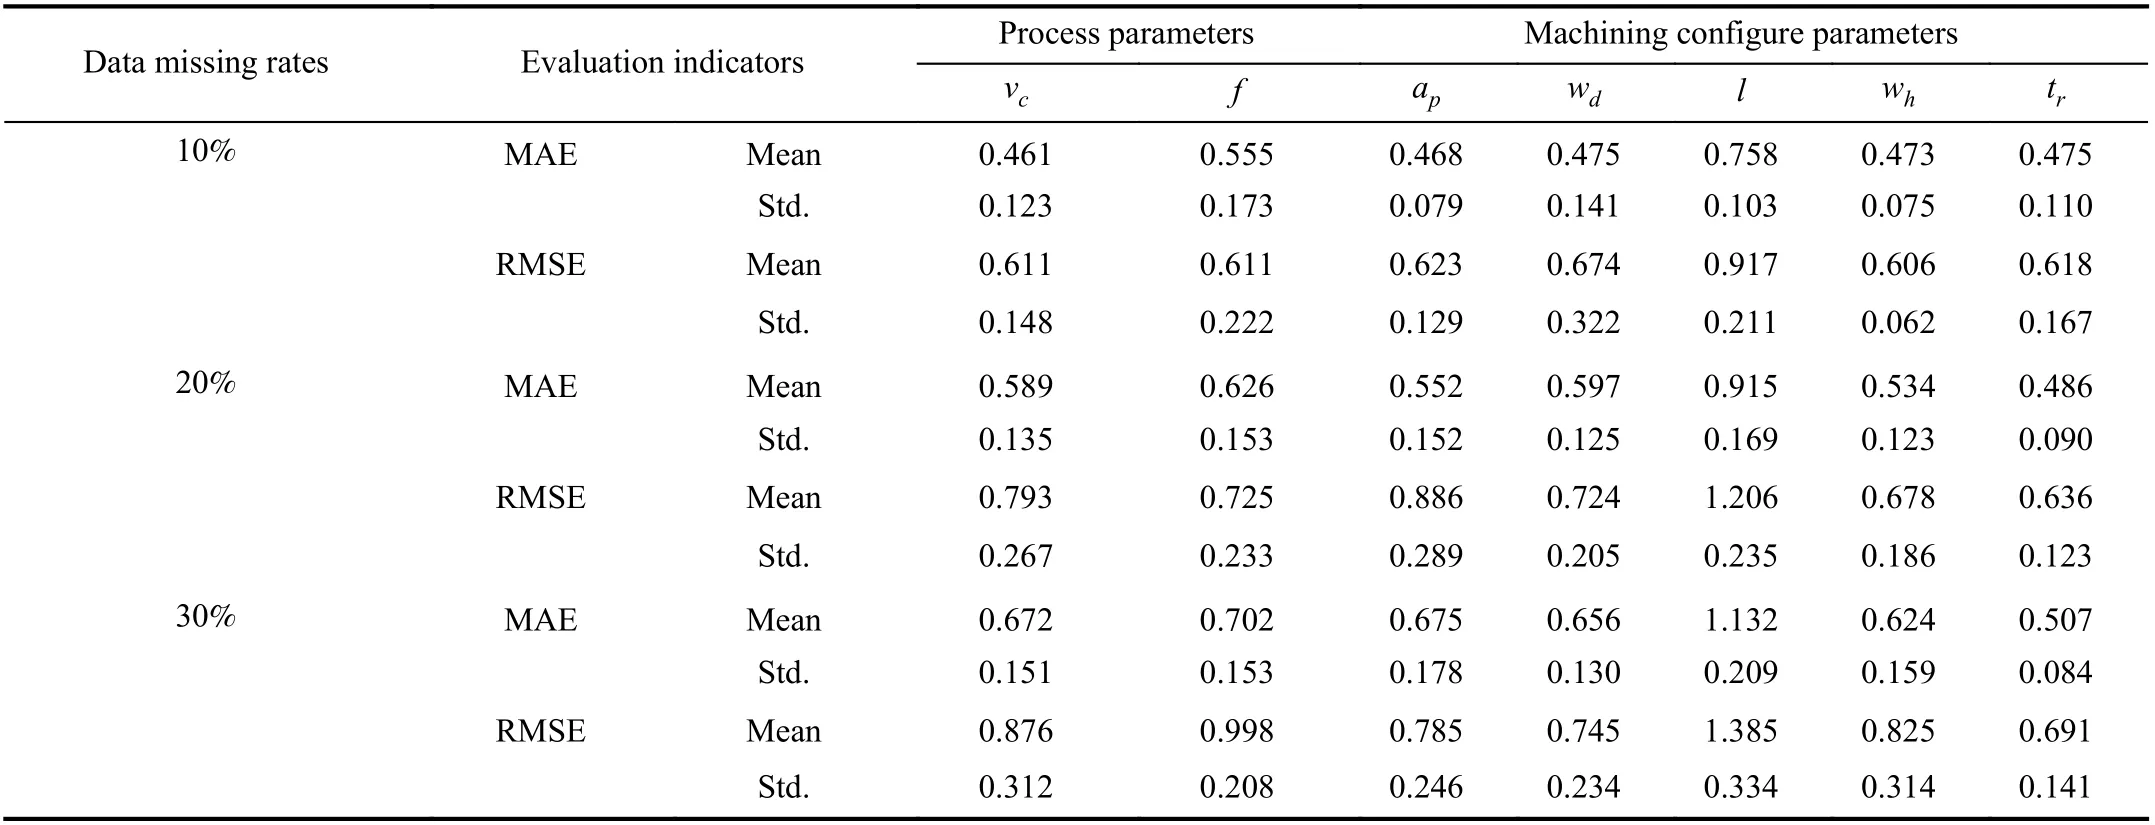
TABLE VII SUMMARY OF THE PREDICTIVE PERFORMANCES FOR MISSING VALUES OF EACH PARAMETER
Here, the impacts of missing values of different parameters on the predictive results were studied. For each parameter, we divide the cases into three different sets, by varying the data missing rate (βt= 10%, 20%, 30%). Then, the proposed frame-work was used for energy modeling based on these data sets. Note that each case was repeated 20 times to obtain the mean test errors and the standard deviations. Table VII encapsulates the performance of energy models for the six parameters with different missing rates. To intuitively compare the influence of the missing value of each parameter,the Pearson correlation coefficients were calculated according to each missing rate and the mean predictive errors (MAE and RMSE). Table VIII gives the final results of this experiment.As it is observed, almost all of the examined parameters missing have a significant influence on predictive results.Specifically, missing values of l have more impact than any others, with the biggest mean MAE and RMSE values.Followed by wh, f, vc, and ap, their influence on predictive accuracy is very close according to the correlation coefficients. While missing values of wdand trhave the least impacts.
2) Influence of Different Missing Patterns on Predictive Accuracy
The main purpose of this section is to discuss the predictive effects in two types of missing patterns in energy modeling.We include the single parameter missing pattern and multiparameter missing pattern, which can be described by Tables IX and X. For instance, in Table IX, only Γ2has missing values,where this case belongs to the typical single parameter pattern.While Γ1and Γ3in Table X all have missing values, this phenomenon is pretty common and belongs to a multiparameter missing pattern. To study the influence of the missing pattern on the prediction model, more experiments should be done. In the first case, one parameter (βv= 16.7%)in the complete dataset was selected randomly and artificially removed 10% values. In the second case, the same number of values was set to null in three parameters, which were determined randomly (βv= 50.0%). Then, the proposed framework was applied to build prediction models for the above two cases. Table XI presents the performances of GEP models with a different missing pattern. Results show that multi-parameter missing affects the GEP model a lot than the single parameter missing.

TABLE IX SINGLE PARAMETER MISSING

TABLE X MULTI-PARAMETER MISSING

TABLE XI PERFORMANCE EVALUATIONS OF GEP MODELS WITH RESPECT TO DIFFERENT MISSING PATTERNS
E. Summary and Discussions
From the above experiments, it can be seen that the proposed framework is effective for dealing with missing data in energy consumption prediction. Equations (19)–(25) give mathematical expressions to accurately forecast energy consumption based on the proposed framework. The predictive results are displayed in Fig. 5. As indicated, the predicted energy values almost agree well with the observations under different missing rates. However, the predictive errors of energy models increase significantly, as the RMSE changed from 0.609 kJ to 0.903 kJ and MAE changed from 0.506 kJ to 0.739 kJ. It seems that the imputation process can only reduce the negative effects caused by missing values, but cannot eliminate them. More estimated errors lead to a decline in predictive accuracy with an increase in the amount of missing data. The same conclusion can be obtained from Table VII.
From the comparative study, GAIN has a dominant position on both RMSE and MAE over other methods, indicating that the GAIN method can effectively utilize limited observational information to generate more accurate imputed values. In practice, the deletion method is widely applied, because it is easy to implement. However, decreasing data volume leads to large test errors, which means it is insufficient in the case of a large number of values missing. As is shown in Fig. 6, the deletion method performs worse than the other three imputation methods. Also, comparing the RMSE and MAE values under different missing rates, the performance of MICE is better than k-NN. As MICE is a regression-based approach, while k-NN depends on the nearest-neighbor value,it is no doubt that these two methods have a significant difference. In this energy prediction application, the nearest neighbors may not be more accurate than the provided variables by the regression-based model. Thus, the former has better performance than the latter.
Fig. 7 shows the comparison results of three different modeling methods. RSM is simple and easy to implement, but it has the largest predictive error. The SVR model, which provides more accurate results, reduces the mean RMSE and MAE values by about 10.64% and 9.89% on average,respectively. Also, the performance of predictive models generated by SVR and GEP are close in the experiments, as the mean RMSE and MAE values of SVR are only 1.98% and 0.87% lower than GEP on average. It seems that both SVR and GEP can effectively give prediction results. However,SVR models act like a black-box and relate energy consumption to the input parameters, which means that extra work must be completed when using it in practice, for example, in building the program operating environment,setting the input data interface, etc. In contrast, GEP models can provide simpler and more intuitive equations for the estimation of energy consumption. As these obtain equations make it simple and convenient to use, GEP models are more user-friendly for application. In general, the results indicate that GEP models in this study perform quite well and thus can be used as powerful tools for robust estimation of energy consumption.
As shown in Table VII, the cutting length (l) has the greatest influence on predictive results, with the mean RMSE ranging from 0.917 kJ to 1.385 kJ and the mean MAE ranging from 0.758 kJ to 1.132 kJ. Energy consumption is mainly determined by cutting power and cutting time, and l has a great influence on the cutting time of the machining process.Thus, missing values of l mean that the cutting time data is not available, which is a considerable obstacle to energy prediction. As shown in Table VIII, the cutting force,workpiece material hardness (wh), and the processing parameters (f, vc, ap) have missing values that also impact the predictive results. They may cause deviations in the cutting power, affecting the prediction results of energy consumption.As expected, because of their small contributions to energy consumption, the workpiece diameter (wd) and cutting tool angle (tr) have a smaller influence on predictive results with correlations of 0.9774 and 0.9744, respectively.
According to Table XI, multi-parameter missing pattern has more influence than single parameter missing pattern on the GEP model in this problem, as the RMSE and MAE increase by 0.041 kJ and 0.042 kJ, respectively. Compared with the estimation for a single parameter, a greater predictive bias can be caused by the superposition of imputed errors of multiple parameters even if the data missing rate is the same. Also, one interesting finding is that any modeling method cannot make an accurate prediction if one or more parameter is completely missing.
V. CONCLUSION
This paper attempts to model energy consumption based on incomplete data for the CNC machining process. Through analyzing the missing data and missing mechanism of the acquired raw data set, a framework was proposed. There are four main steps, including necessary preliminary operations,missing values estimating based on the GAIN method,training GEP model, and model evaluation.
To demonstrate the effectiveness of the proposed framework, a number of validation experiments were conducted. On one hand, the proposed framework was used to model data sets with different missing rates, indicating that the missing data rate increases from 0% to 30%, and the MAE and RMSE increase only by 0.233 kJ and 0.294 kJ. On the other hand, comparative studies of the used two methods,GAIN and GEP, are conducted respectively. Results show the superiority of the used GAIN and GEP methods. More specifically, when dealing with missing values of energy modeling data, GAIN performs better than the other three commonly used methods. When predicting energy consumption, GEP outperforms RSM and SVR in terms of predictive accuracy and practicability, respectively. All the above results prove that the proposed framework provides an effective solution to this problem under certain circumstances.Furthermore, it also can be adopted to model data sets with different parameter missing values and different missing patterns.
Nevertheless, the proposed framework also has some drawbacks that will be explored in future work, which mainly involve the following two aspects.
1) The proposed framework is time-consuming when dealing with large amounts of data. Thus, more efficient methods and algorithms are also needed to cope with the efficiency and complexity in the actual production.
2) Since the used data set is acquired in the actual machining process, the noise in the raw data affects both the imputation and modeling process. Therefore, we plan to focus on the impact of noise in further study.
杂志排行
IEEE/CAA Journal of Automatica Sinica的其它文章
- Review of Research and Development of Supernumerary Robotic Limbs
- Control of Non-Deterministic Systems With μ-Calculus Specifications Using Quotienting
- Decentralized Dynamic Event-Triggered Communication and Active Suspension Control of In-Wheel Motor Driven Electric Vehicles with Dynamic Damping
- ST-Trader: A Spatial-Temporal Deep Neural Network for Modeling Stock Market Movement
- Total Variation Constrained Non-Negative Matrix Factorization for Medical Image Registration
- Sampled-Data Asynchronous Fuzzy Output Feedback Control for Active Suspension Systems in Restricted Frequency Domain
