Tailoring the degradation rate of magnesium through biomedical nano-porous titanate coatings
2021-03-10MtthewWdgeJmieMcGuireBenjminHnbyRedFelfelIftyAhmedDvidGrnt
Mtthew D.Wdge,Jmie McGuire,Benjmin V.T.Hnby,Red M.Felfel,b,Ifty Ahmed,Dvid M.Grnt
aAdvanced Materials Research Group,Faculty of Engineering,University of Nottingham,NG7 2RD United Kingdom
b Physics Department,Faculty of Science,Mansoura University,Mansoura 35516,Egypt
Received 27 March 2020;received in revised form 20 July 2020;accepted 22 July 2020
Available online 21 August 2020
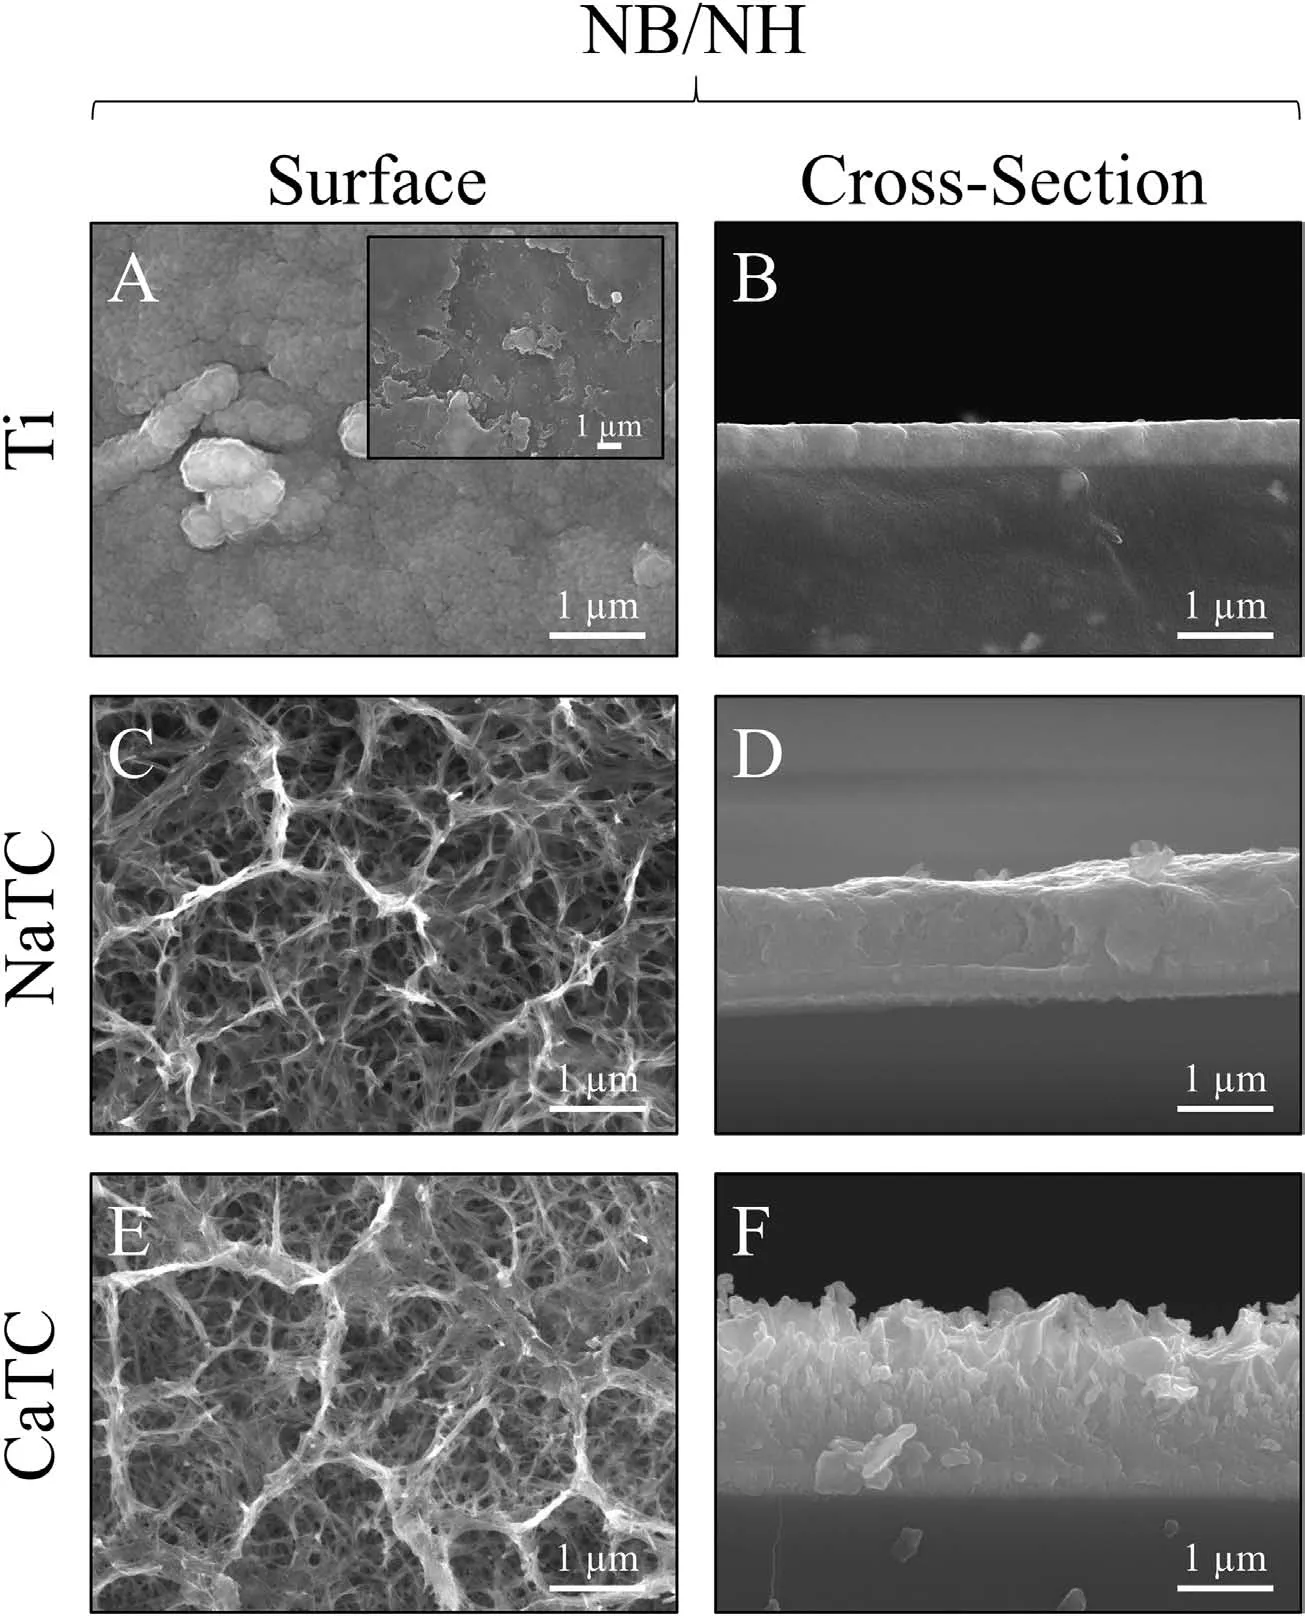
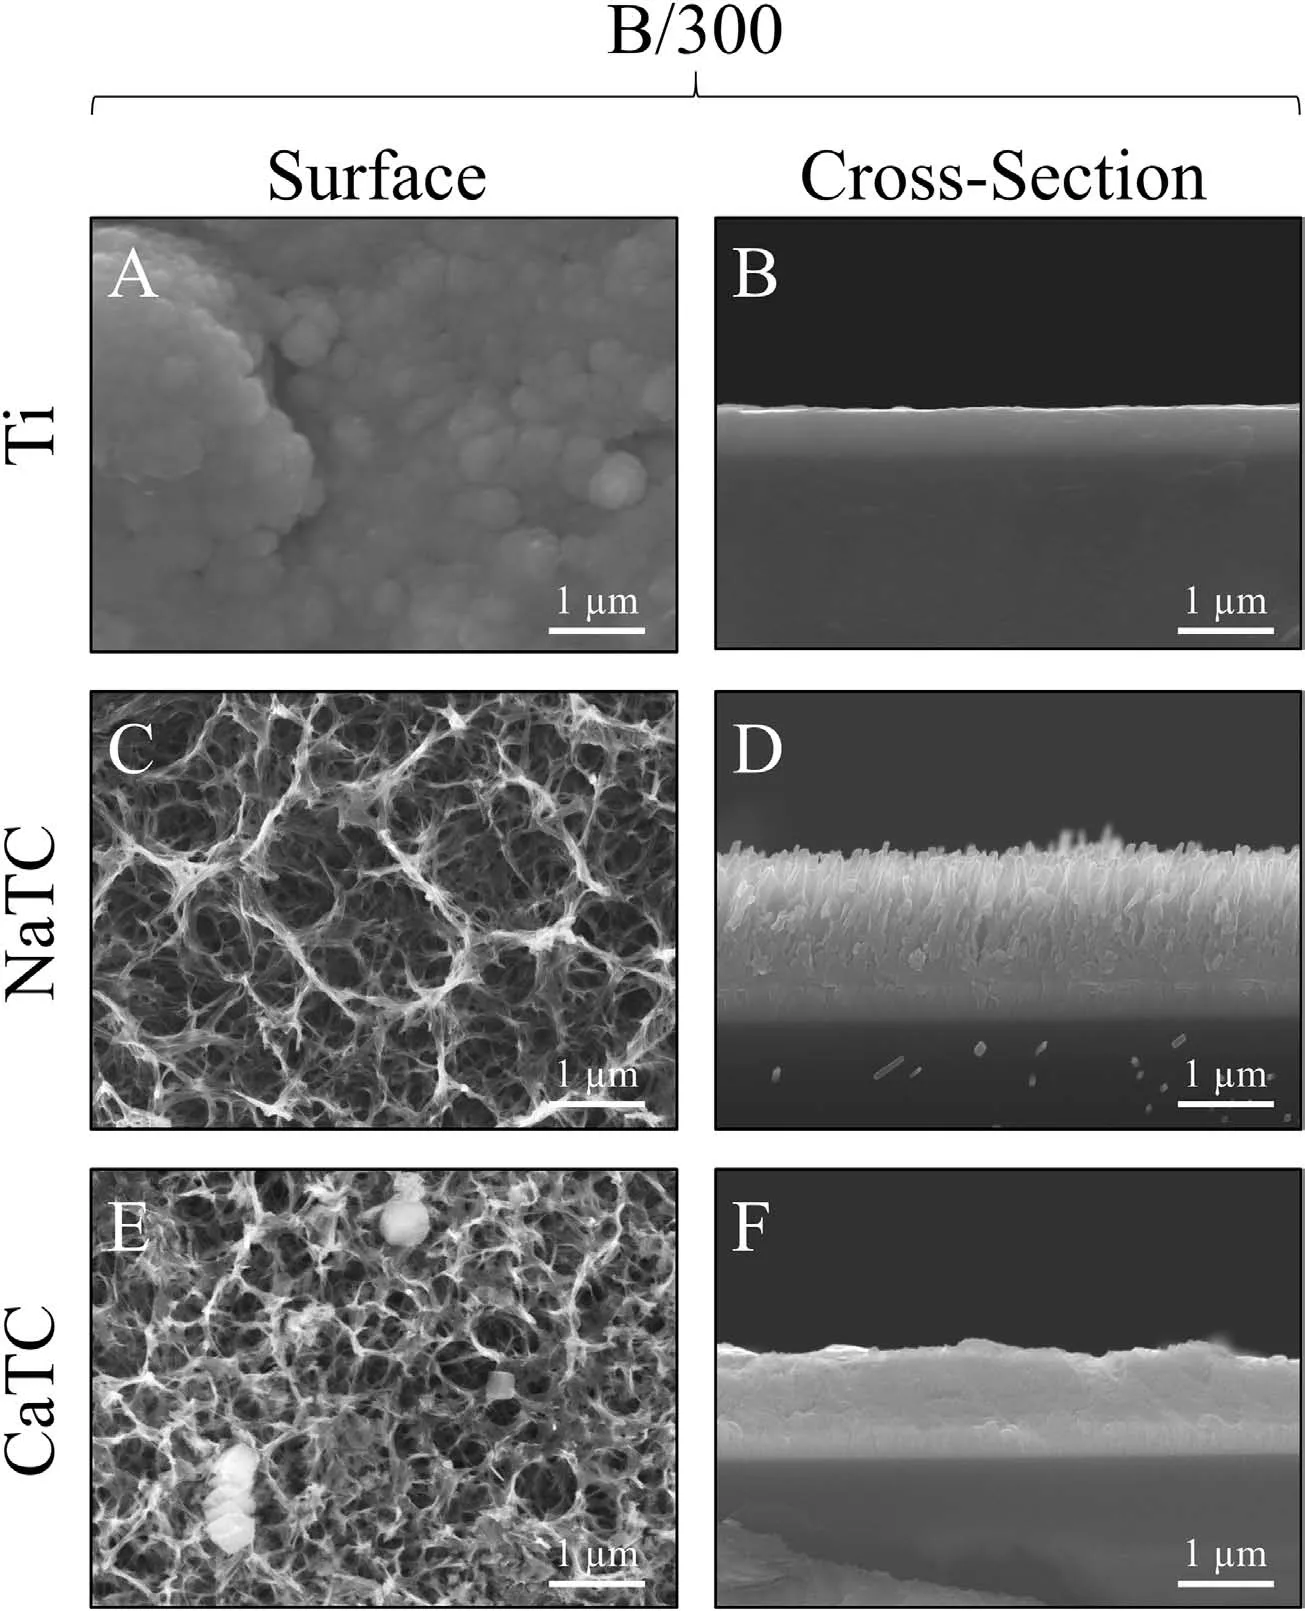
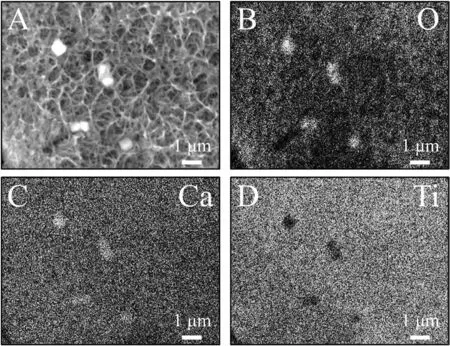
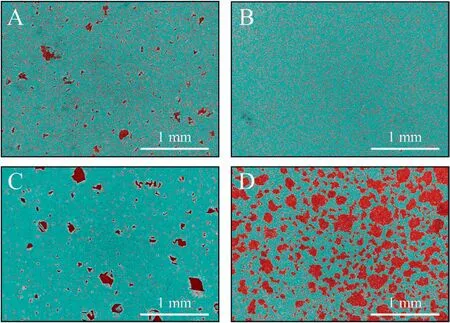
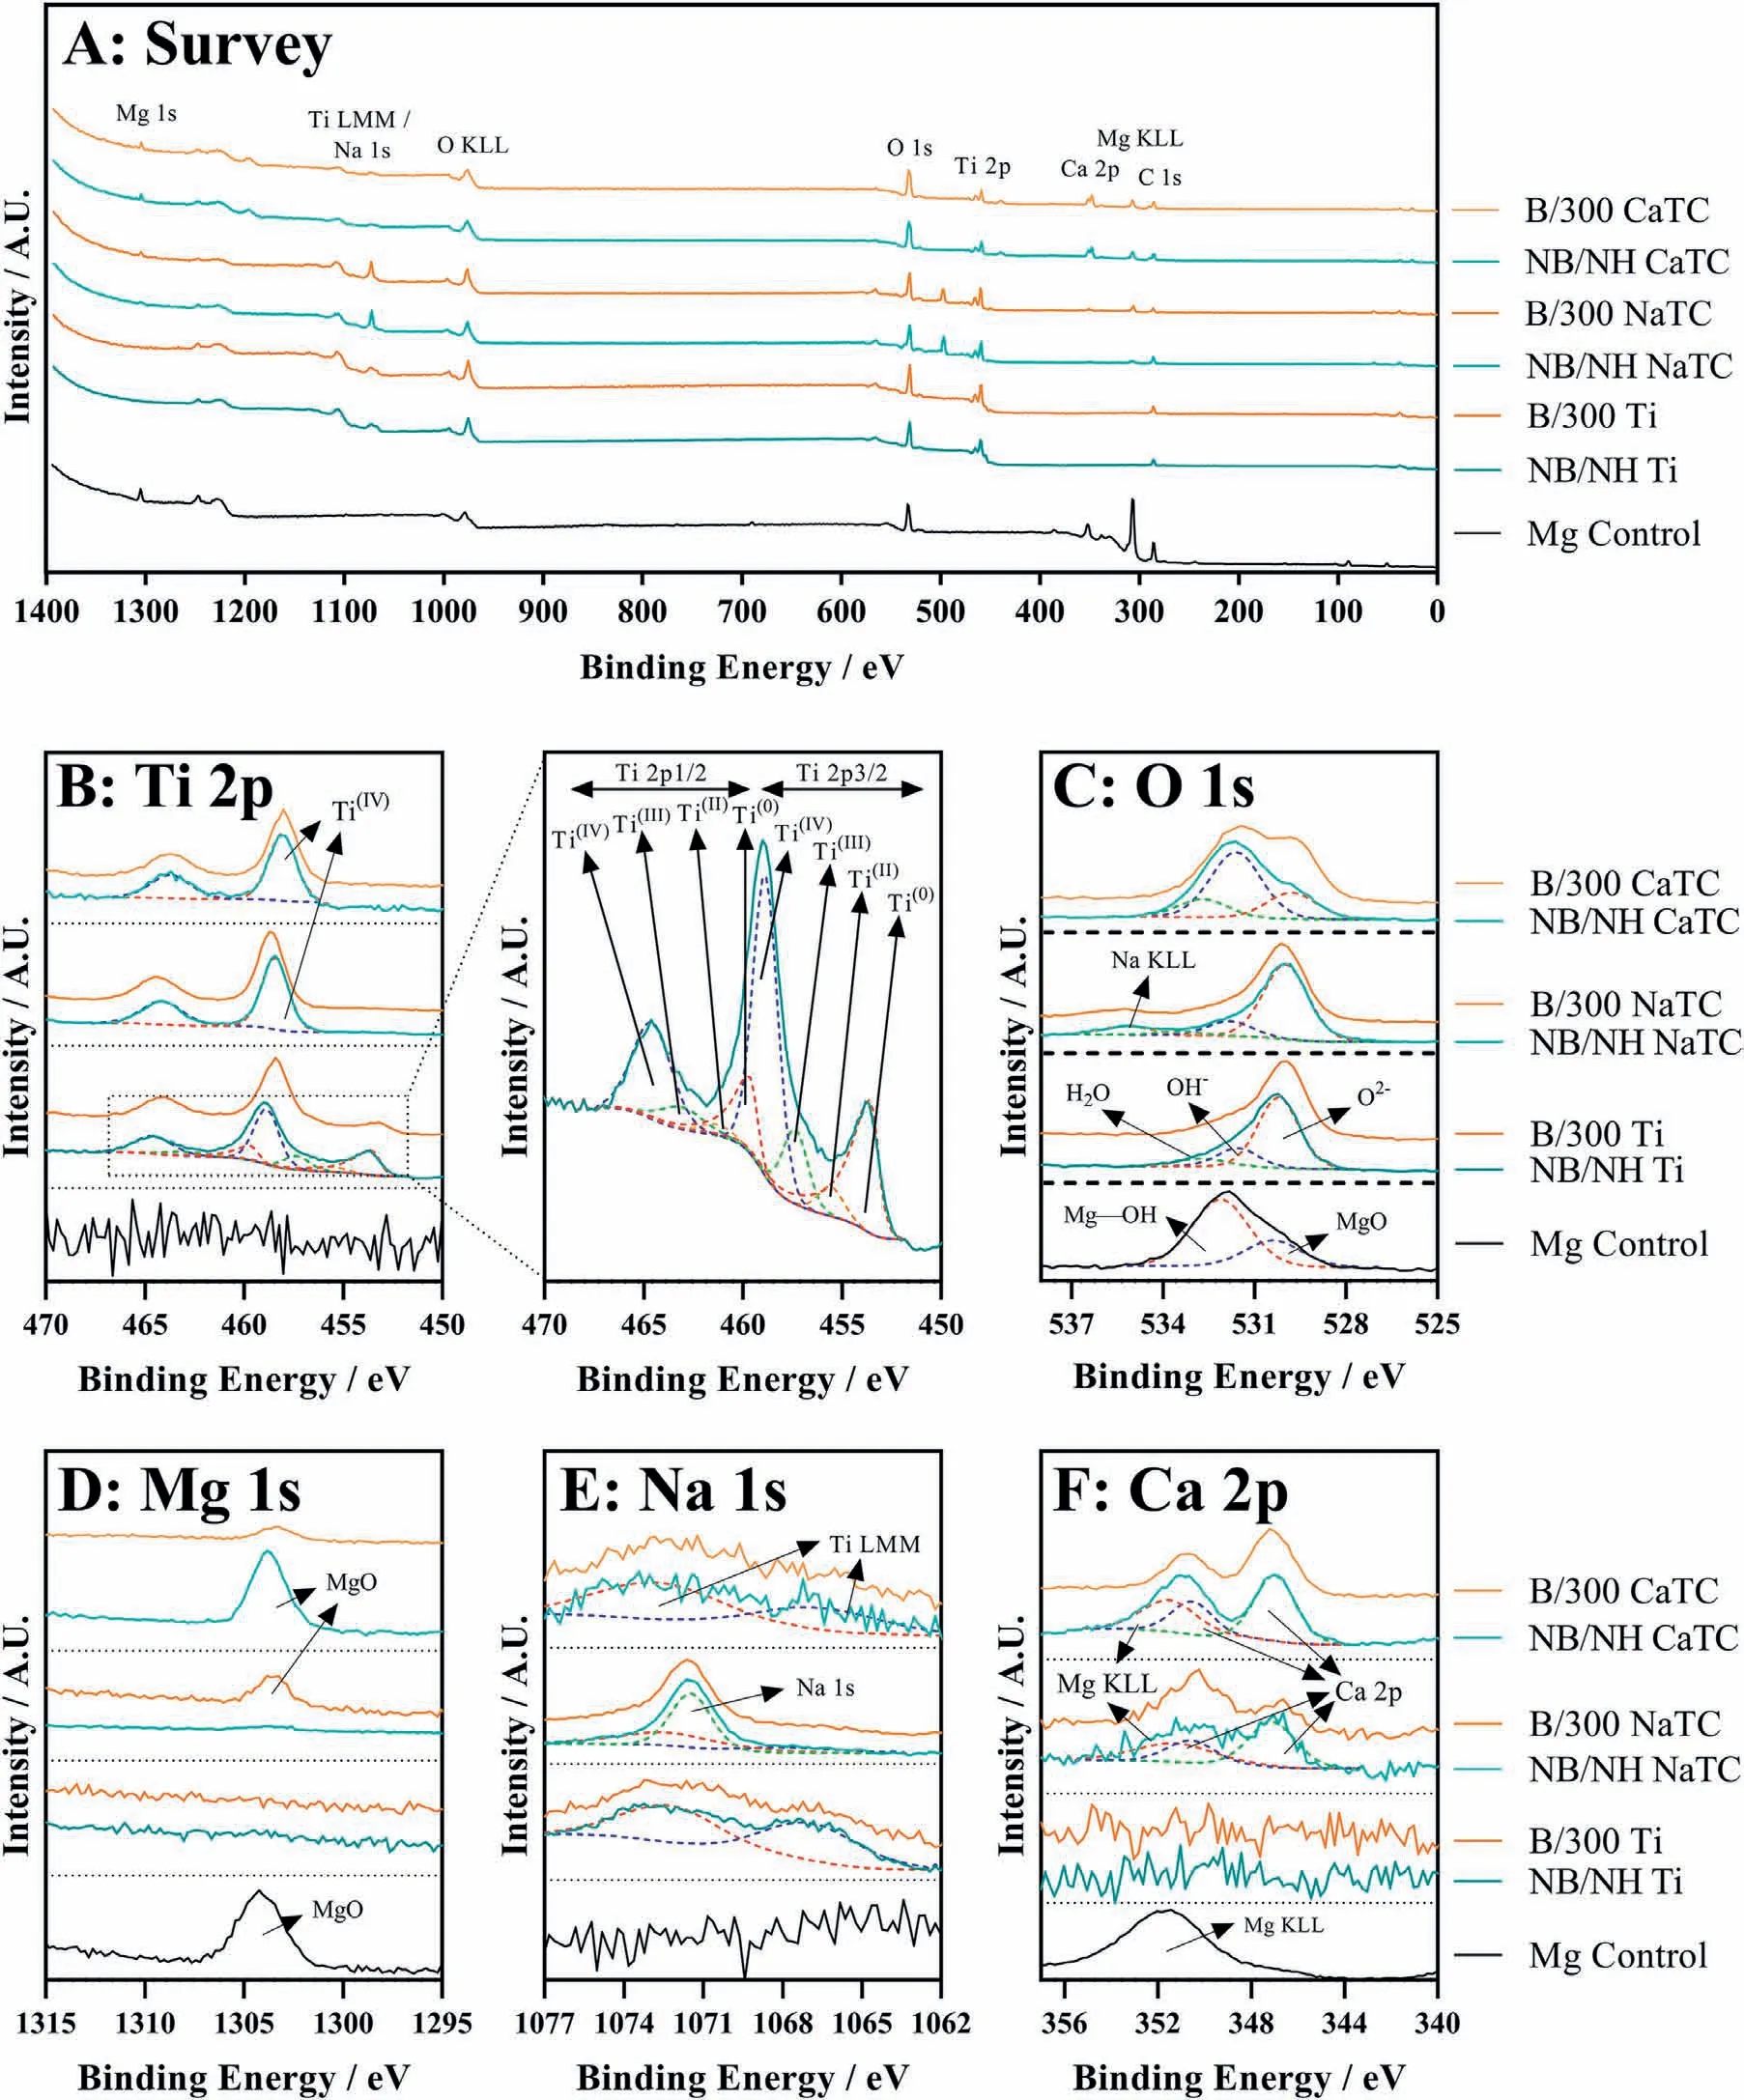
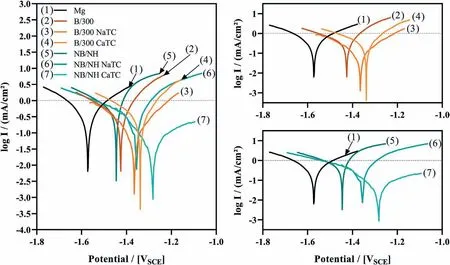
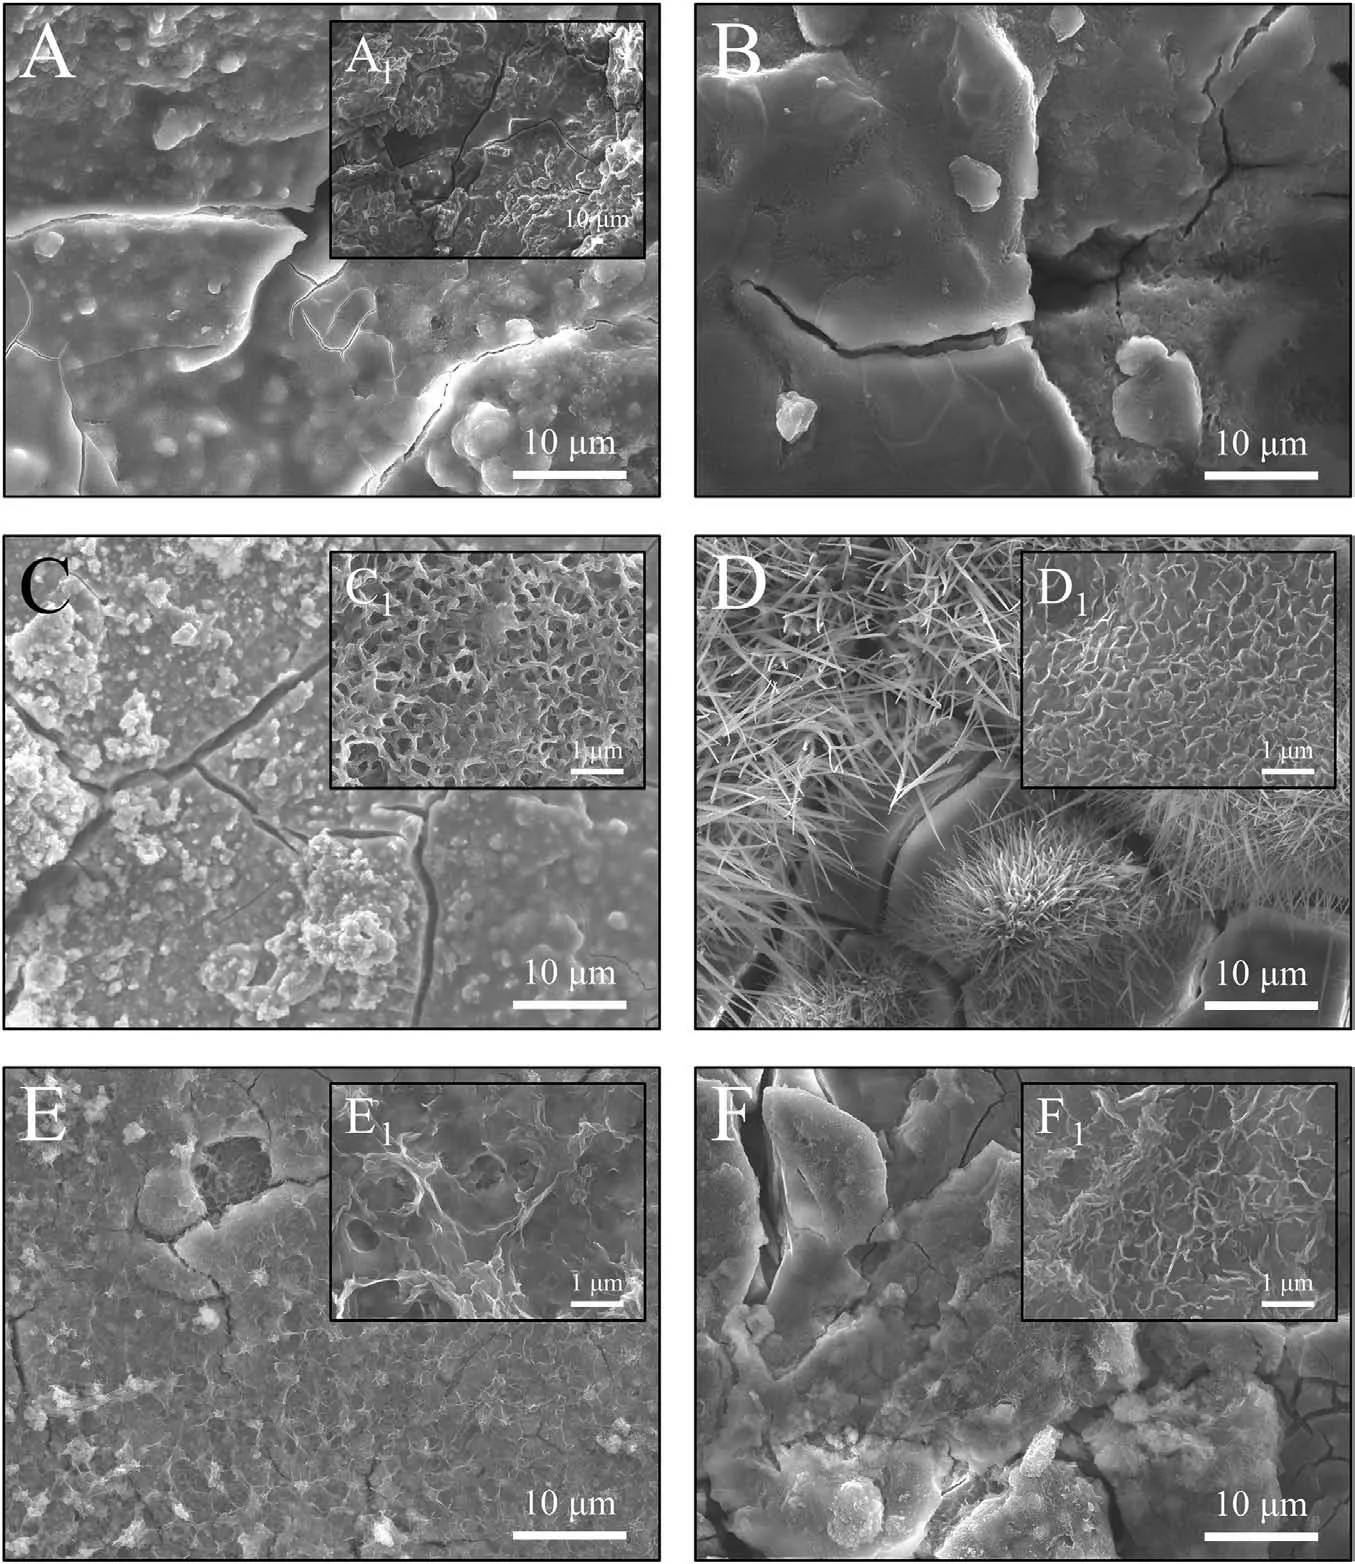
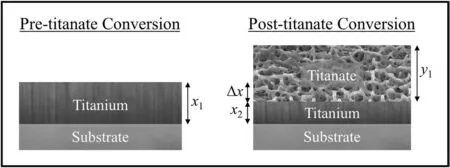
Abstract A novel approach was developed to reduce the corrosion rate of magnesium(Mg)metal,utilising titanate coatings.Magnetron sputtering was used to deposit ca.500nm titanium(Ti)coatings onto pure Mg discs,followed by hydrothermal conversion and ion exchange reactions to produce sodium and calcium titanate coatings.SEM confirmed the characteristic nanoporous structure of sodium and calcium titanate,with thicknesses ranging from ca.0.8 to 1.4μm.XPS analysis confirmed the presence of Ti4+—O,Na—O,and Ca—O bonding,whilst Raman spectroscopy demonstrated characteristic vibrational modes(such as TiO6 octahedral vibrations)of the sodium and calcium titanate perovskite structure.Furthermore,corrosion studies through potentiodynamic polarisation measurements demonstrated the NB/NH CaTC samples to be superior in reducing Mg degradation,compared to other samples tested,through an increase in Ecorr from−1.49 to−1.33V,and the reduction in corrosion current density,icorr,from 0.31 to 0.06mA/cm2 for Mg and NB/NH CaTC samples,respectively.There was a clear trend noted for the NB/NH samples,which showed an increase in Ecorr to more positive values in the following order:Mg Keywords:Magnesium degradation;Titanate;Biodegradable;Ion exchange;Electrochemical corrosion;Magnetron sputtering. Magnesium(Mg)has been a material of interest for medical implants due to its low density(1.7–2.0g/cm3;cortical bone=1.8–2g/cm3[1]),and mechanical properties akin to that of cortical bone(Young’s Modulus ca.45 vs.5–23GPa and Ultimate Tensile Strength=ca.160 vs.35–283MPa,respectively[1]).Its ability to fully degrade in aqueous conditions,and by extension in vivo,makes it an ideal biodegradable biomaterial candidate.Furthermore,Mg has found clinical success with MAGNEZIXR○MgYREZr;magnesium(Mg),yttrium(Y),Rare Earths(RE),zirconium(Zr),screws as fixation orthopaedic devices[2].However,early investigations of Mg showed that its degradation,while non-toxic,was too rapid for tissue regeneration devices,and the evolution of H2gas lead to complications in the healing process of surrounding tissues[3].To combat these shortfalls,modifications to Mg were investigated within the literature to make it a viable biodegradable implant material.General methods within the literature,to reduce the degradation rate of a biomaterial,have included alloying with other elements,such as zinc(Zn)and calcium(Ca)[4],as well as applying bioactive protective coatings,such as polydopamine[5,6],TiO2[5],calcium phosphates/hydroxyapatite(CaP/HA)[7,8],plus others[9]. Of the many different PVD methodologies employed,magnetron sputtering,through the use of permanent and/or electro-magnets to direct secondary electrons produced from plasma-target collisions into a confined area,have demonstrated higher deposition rates[10],as well as decreased operating voltages(typically,−300 to−500V,compared to−2 to−3kV)and vacuum pressures(typically,10−3mbar,compared to 10−2mbar)required for sputtering[11].Magnetron sputtering also offers coating at low temperatures(<150°C),higher coating and plasma densities and the formation of metastable phases[12]further expanding materials available for deposition and substrate selection[13].These advantages suggest that magnetron sputtering could be an ideal process for production of protective coatings for biomedical materials[14]. A recent study showed that magnetron sputtering allowed deposition of Ti thin films onto alternative material substrates,specifically 316L stainless steel,and also successfully demonstrated chemical conversion into titanate structures;previously not achieved within the literature[15].Titanates,initially developed for biomedical applications by Kokubo et al.[16–18],are a class of ceramic materials which enable the production of apatite in vivo through the facilitation of several ion-exchange reactions.However,despite extensive research into titanates,both for osteoconductive[19]and antibacterial[20,21]applications,their applicability has been limited to Ti and Ti alloy substrates,due to the chemical conversion route used.Previous work by the authors outlined the potential translation of these surfaces onto alternative substrate materials,for example,onto Mg for corrosion inhibition and improved biocompatibility[15].This study investigates the production and characterisation of both sodium and calcium titanate surfaces,produced via chemical conversion of Ti magnetron sputtered thin films,and their potential application as corrosion inhibitors for biomedical Mg implants.The use of a titanate coating is a novel approach to tailoring the degradation rate of Mg,since the nanoporous titanate structure not only enables enhanced bioactivity of the Mg implant,but will also enable the release of beneficial ions(Na+and Ca2+)that can aid in bone growth,and modify the surrounding cellular environment(pH and composition)to prevent Mg degradation;an approach previously not investigated within the literature.Furthermore,the chemical conversion step has also demonstrated the promise for passivation of the underlying Mg,further enhancing corrosion inhibition;suggesting a combinatorial approach. 2.1.1.Mg discs A fly press was used to punch Mg discs(10mm diam.,1mm thickness,purity:99.9%,tempered as rolled,Advent Metals Ltd.,UK)from an Mg sheet.No further processing of the discs was conducted due to the reactivity of the substrate. 2.1.2.DC magnetron sputtering of CP-Ti thin films A TEER UDP-650 type 2 unbalanced magnetron sputtering rig with a Ti target(>99.6% purity;175×380mm)mounted was used to deposit Ti coatings onto the Mg discs.Mg discs were secured using double-sided polyimide Kapton tape to a rotational(5 RPM)sample holder mounted at a substrate to target distance of 55±1mm.Ar gas(purity 99.999%;Pureshield BOC)was then introduced a rate of 20 sccm to achieve a working pressure of<1×10⁻³Torr from the pumped base chamber pressure of<1×10⁻⁵Torr. Initially samples were bias cleaned with a pulsed DC bias(pulse width of 250kHz,a step time of 500ns),at a voltage of−150V for 60min.Discs were then separated into two distinct groups,where differing sputtering parameters were used to determine any effects of film density on the degradation rate.These were designated NB/NH(No Bias/No Heating)and B/300(Bias/300 °C).The parameters to achieve ca.500nm thick Ti coatings are detailed in Table 1,utilising previously optimised data for the coating procedure[15]. 2.1.3.Sodium hydroxide chemical treatment A 5M NaOH solution was prepared by dissolving 19.9g of NaOH pellets(purity:99.0%,Sigma-Aldrich)into 100mL of deionised H2O.10mL aliquots were then poured into polypropylene containers for each sample for conversion.A single Ti-coated Mg disc was placed into each container.Containers were kept in an oven at 60 °C for 24h.Discs were then removed and rinsed briefly(ca.1min)in deionised H2O and then dried in a desiccator.The samples treated this way(NB/NH and B/300)were denoted with the suffix NaTC. 2.1.4.Calcium hydroxide ion-exchange chemical treatment A 10mM Ca(OH)2solution was prepared by dissolving 74mg of Ca(OH)2into 100mL of distilled H2O.Again 10mL aliquots were used to submerge the now NaOH-treated substrates(half of the produced NB/NH NaTC and B/300 NaTC samples)in polypropylene containers and heated to 60 °C for 24h.Discs were then removed from the polypropylene containers and rinsed for ca.1min in deionised H2O and then dried in a desiccator.These samples(NB/NH and B/300)were denoted with the suffix CaTC. 2.2.1.Scanning electron microscopy(SEM)and energy dispersive X-ray spectroscopy(EDX) Imaging of both substrate surfaces and cross-sections were performed with a Field-Emission Gun Scanning Electron Microscope(JEOL 7100F FEG-SEM).A 15kV accelerating voltage and a working distance of 10mm,was employed.Cross-sectional images were produced using silica glass discs instead of Mg discs(as used previously[15]),due to the ease of generating sharp cross-sectional fractures and the higher resolution cross-sectional images produced compared to crosssectional polishing;the glass discs were shattered for crosssectional analysis.EDX mapping was conducted over ca.100 μm2(precipitate analysis)and ca.6 mm2areas(delamination analysis)for all samples ensuring a minimum of 250,000 counts(n=5).ImageJ analysis was also conducted on SEM micrographs in order to quantify the level of delaminationthrough thresholding the samples and analysing spalled regions through an“Analyse Particle”plugin,determining the average delamination area,frequency,and delamination percentage. Table 1Coating parameters used for DC Ti magnetron sputtering to achieve a target thickness of ca.500nm,as optimised previously[15].NB/NH stands for No Substrate Bias/No Substrate Heating,whilst B/300 stands for−100V Substrate Bias/300 °C Substrate Heating. 2.2.2.X-ray photoelectron spectroscopy(XPS) A VG ESCALab Mark II X-ray photoelectron spectrometer with a monochromatic Al KαX-ray source was utilised for the XPS analysis.Measurements were taken ca.30° incident to the substrate surface.Calibration was carried out through charge correction of the C 1s photoelectron peak to 284.8eV in each analysis.Survey scans over a binding energy range of 0–1200eV were conducted,as well as high-resolution scans for O,Ti,Na,C,and Ca elements.Survey scans were set to a step size of 1.0eV,number of scans at 5 and a dwell time of 0.2s,while high-resolution scans used a step size of 0.2eV,number of scans to 5 and a dwell time of 0.4s.Resulting spectra were analysed in CasaXPS constraining the Full Width at Half Maximum to the same value for all deconvoluted spectral peaks for the same element,where appropriate.In addition,all j-j coupling/spin orbit splitting peaks,most notably the Ti 2p peaks,were constrained to an area ratio of 2:1 for 3/2:1/2 peaks,respectively.Appropriate line shapes were also observed for asymetric metallic vs.symetric oxide peak deconvolutions. 2.2.3.X-ray diffraction(XRD) A Bruker D8 advanced XRD spectrometer(Cu Kαsource,λ=1.5406 °A,40kV,35mA)was used for determination of substrate crystallinity.To limit the depth of X-ray penetration to the first few microns of the surface,a glancing angle of 1.2° was used.Values of 2θranged from 5° to 65°,with a 0.015°(2θ)step size and a dwell time of 12s. 2.2.4.Raman spectroscopy A HORIBA Jobin Yvon LabRAM HR spectrometer was used for Raman spectroscopy of the substrates.A 532nm laser(25mW power),300μm confocal pinhole and 100x objective were used for spectra acquisition.A SYNAPSE CCD detector(1024 pixels)was used for spectra detection,which was cooled to 213K(−60 °C)thermoelectrically.A 600 lines/mm rotatable diffraction grating along the 800mm path length was used to achieve detection of multiple Raman shifts simultaneously.The instrument was calibrated with the Rayleigh line at 0 cm−1and standard Si(100)reference band at 520.7 cm−1.The final spectrum for each substrate was a composite of 10 spectra using a 10s time window. 2.2.5.Electrochemical corrosion testing Potentiodynamic polarisation(PDP)testing was conducted using a Voltalab PGZ 100(Radiometer analytical,UK)potentiostat and a three electrode electrochemical cell consisting of,one saturated calomel reference electrode(SCE),one 1 cm2Pt auxiliary electrode and one working electrode containing the sample being tested.Each test used 1L of Dulbecco’s Modified Eagle Media(DMEM;MERCK,UK)solution balanced to a pH of 7.4 at 37±1 °C.Open circuit potential(OCP)scans were conducted for 30min,followed by PDP analysis.Anodic and cathodic scans were conducted from a potential of−2V to 1.5V,with a scan rate of 1mV/s.Tafel analysis(through extrapolation of the cathodic region only due to the Negative Difference Effect of the anodic branch[22,23])using Voltamaster software determined both Ecorr,icorr,and Rpvalues for each sample,with the tafel region only shown in the figure for clarity. Additional,qualitative analysis on the potential corrosion rate(vcorr),in mm.y−1,was calculated using Faraday’s rate equation,according to ASTM G102:89(2015)E1: Where CR is the penetration rate unit(mm.y−1),icorr(μA.cm−2)is the corrosion current density,K1is a constant of 3.27×10⁻³(mm.g.μA−1.cm−1.y−1),ρis the materials density(Mg=1.738g.cm−3),and EW is the‘effective weight’,defined as the atomic weight divided by the number of electrons required to oxidise an atom during the corrosion process:Mg=12.15[24].SEM micrographs were also produced for all samples post-electrochemical degradation,and utilised the same parameters outlined in Section 2.2.1. 3.1.1.SEM and EDX Changes in morphology were determined through SEM imaging for all samples in the NB/NH and B/300 sample sets(Figs.1 and 2,respectively)as well as the Mg control(Fig.1A insert).The Mg control and the NB/NH Ti and B/300 Ti samples(Fig.1A insert,Figs.1A,and 2A,respectively)exhibited relatively smooth morphologies with small cavities present;marginal differences were noted between the samples,however,these were not significant and exemplify the step-coverage of magnetron sputtered coatings. Fig.1.SEM Surface and cross-section micrographs with A)and B)NB/NH Ti;C)and D)NB/NH NaTC;and E)and F)NB/NH CaTC.Insert micrograph in A)is of the Mg control,for reference. Table 2Ti coating and titanate thickness determined via SEM assessment.Error values are standard error;n=5.NB/NH(No Substrate Bias/No Substrate Heating);B/300(−100V Bias/300 °C heating);Ti(just Ti coating);NaTC(sodium titanate converted);CaTC(calcium titanate converted). Cross-sectional images show an increase in the overall thickness of the coating when converted from Ti to NaTC,on both the NB/NH(Fig.1B and D)and B/300 samples(Fig.2B and D),as well as the appearance of a bilayer in the final coating formed,consisting of Ti(bottom)and titanate(top),distinguished by contrast in intensity and structure;the titanate was nanoporous in morphology compared to the columnar sputter grown Ti coatings.The thickness of both the Ti and titanate portion of the coatings are quantified in Table 2,which showed a decrease in the thickness of the Ti layer in all titanate samples and a significant increase in the total coating thickness due to the titanate growth.Furthermore,the thickness of both NB/NH and B/300 Ti coatings(Table 2)were close to the intended 500nm coating thickness.The Ti layer revealed a consistent reduction in thickness from ca.500nm to ca.300nm for all titanate samples except for B/300 CaTC(Fig.2F)at ca.380nm.It was noted that the thickness of the titanate layer showed no pattern between either sputtering parameters and/or chemical character,with a range of thicknesses from ca.820nm on B/300 CaTC to ca.1.42μm on the B/300 NaTC sample. Fig.2.SEM Surface and cross-section micrographs with A)and B)B/300 Ti;C)and D)B/300 NaTC;and E)and F)B/300 CaTC. Table 3EDX elemental data of titanate converted DC magnetron sputtered Ti films.Values given are mean values±standard error(n=5).All unconverted samples contained 100% Ti via EDX.NB/NH(No Substrate Bias/No Substrate Heating Ti coating);B/300(−100V Bias/300 °C heating Ti coating);NaTC(sodium titanate converted);CaTC(calcium titanate converted). Analysis of the elemental composition of NB/NH NaTC,NB/NH CaTC,B/300 NaTC and B/300 CaTC samples determined via EDX is summarised in Table 3.The O and Ti content were similar for NB/NH NaTC,NB/NH CaTC and B/300 NaTC,while B/300 CaTC showed higher Mg content at 31.5 at.%,correlating with decreased O and Ti content.NB/NH and B/300 NaTC samples showed an increased Na content(8.0 and 7.1 at.%,respectively)with trace(<0.5 at.%)Ca content while CaTC samples exhibited the inverse with low Na and higher Ca content(NB/NH=4.8 at.%,B/300=3.1 at.%).Precipitates on the B/300 CaTC sample were found to be rich in Ca and O,as confirmed via EDX(Fig.3). Fig.3.EDX mapping of precipitates on the B/300 CaTC sample,exhibiting increased intensities of Ca and O,with a reduction in Ti. Fig.4.EDX Mapping of Mg(red)and Ti(blue)overlaying SEM images of delamination(Defined as the clear Mg regions(red)on the EDX micrographs)of A)NB/NH NaTC,B)NB/NH CaTC,C)B/300 NaTC and D)B/300 CaTC.(For interpretation of the references to colour in this figure legend,the reader is referred to the web version of this article.) EDX mapping(Fig.4)of the samples suggested partial delamination had occurred in the coatings following wet chemical conversion,particularly for the B/300 NaTC and CaTC samples.Of the coatings produced,the NB/NH samples performed better,with the NB/NH CaTC samples showing minimal delamination(<0.1%).Delamination data,quantified from ImageJ analysis of the SEM micrographs,which are summarised in Table 4 and indicated the B/300 samples,particularly the CaTC sample,experienced a far higher degree of delamination in total area of delamination(ca.40.3% vs.<0.1%,respectively)and size of delaminated regions(ca.3402.9μm2vs.238.4μm2,respectively)than the NB/NH CaTC coatings. 3.1.2.XPS XPS analysis(Fig.5)of high-resolution Ti 2p(Fig.5B),O 1s(Fig.5C),Mg 1s(Fig.5D),Na 1s(Fig.5E),and Ca 2p(Fig.5F)peaks demonstrated significant differences in peak deconvolutions,spectral shifts,and peak intensities,corresponding to alternative chemical structures produced.All survey spectra(Fig.5A)detailed noticable differences between the Ti coated(NB/NH Ti and B/300 Ti),sodium titanate converted(NB/NH NaTC and B/300 NaTC),and calcium ionexchanged(NB/NH CaTC and B/300 CaTC)samples,however,better comparison can be made in the high-resolutionspectra(Fig.5B-F).The survey spectra was ultimately used to determine the elemental composition of the sample surface’s,outlined in Table 5.All samples exhibited some Mg,despite the shallow penetration depth,except for the Ti coated samples.The comparison of NaTC and CaTC samples showed high Na content in NaTC samples becoming zero upon conversion to CaTC,with an associated increase in Ca content.A full account of each deconvoluted peak for each sample is presented in the supplementary information(Tables S1 and S2). Table 4ImageJ quantitative analysis for delamination of titanate coatings on Mg substrates with values given as mean±standard error(n=5).NB/NH(No Substrate Bias/No Substrate Heating Ti coating);B/300(−100V Bias/300 °C heating Ti coating);NaTC(sodium titanate converted);CaTC(calcium titanate converted). Fig.5.XPS survey and high-resolution spectra and corresponding peak deconvolutions of Ti coated(NB/NH Ti and B/300 Ti),sodium titanate converted(NB/NH NaTC and B/300 NaTC)and calcium ion-exchanged(NB/NH CaTC and B/300 CaTC)samples.A)Survey,B)Ti 2p with insert spectra showing detailed deconvolutions for the NB/NH Ti sample,C)O 1s,D)Mg 1s,E)Na 1s,and F)Ca 2p elemental peaks. Table 5Surface element compositional analysis conducted via XPS survey spectra component fitting.The quoted errors are calculated area standard deviations using CasaXPS.NB/NH(No Substrate Bias/No Substrate Heating);B/300(−100V Bias/300 °C heating);Ti(just Ti coating);NaTC(sodium titanate converted);CaTC(calcium titanate converted). O 1s high-resolution scans(Fig.5C)for the Ti coated samples detailed 3 constituent peaks corresponding to O2−(Ti4+—O;ca.71.6%),OH−/defective oxides(Ti—OH/Ti3+—O/Ti2+—O;ca.18.8%),and H2O(ca.9.7%).Similar peaks were noted for the NaTC samples with the addition of a peak at 535.2eV(ca.9%)due to Na KLL Auger electrons.This peak was lost during the conversion to the CaTC samples,with 3 similar deconvoluted peaks to the Ti coated samples corresponding to O2−(Ti4+—O;ca.23–43%),OH−/defective oxides(Ti—OH/Ti3+—O/Ti2+—O;ca.49–60%),and H2O(ca.8–16%),although the relative peak intensities/areas were different. Ti 2p high-resolution analysis(Fig.5B)corroborated the O 1s findings,with the Ti coated samples(NB/NH Ti and B/300 Ti)exhibiting Ti in all 4 valence states;Ti4+(2p 3/2 ca.458.7eV;ca.51–64%),Ti3+(2p 3/2 ca.457.2eV;ca.13%),Ti2+(2p 3/2 ca.455.3eV;ca.5%),and Ti—Ti(2p 3/2 ca.453.3eV;ca.17–31%).The number of deconvoluted peaks for Ti 2p doublets decreased to a single doublet for the NaTC(NB/NH NaTC and B/300 NaTC)and CaTC(NB/NH CaTC and B/300 CaTC)samples corresponding to Ti(IV)/TiO2(2p 3/2 at ca.458.3eV);the CaTC samples exhibited a shift(~0.1–0.4eV)to lower binding energies compared to NaTC samples. The Na 1s region(Fig.5E)had an asymmetric peak that resolved into 3 peaks at ca.1071.5eV(44–53%),ca.1068.2eV and 1071.5eV(combined these accounted for the remaining peak area percentage)relating to Na—O and two Ti LMM Auger electron peaks,respectively,for both NaTC samples.For both the Ti coated and CaTC samples,only two constituent peaks were present corresponding to the Ti LMM Auger peaks only.Three peaks were also present in the Ca 2p region(Fig.5F)for CaTC(NB/NH CaTC and B/300 CaTC)samples attributed to Ca 2p doublets(2p 3/2 ca.347.0eV;combined ca.67 and 95% for NB/NH CaTC and B/300 CaTC samples,respectively)and Mg KLLb Auger electrons at 351.5eV(33 and 5% for NB/NH CaTC and B/300 CaTC samples,respectively;a significant increase in the relative quantity of Mg KLL Auger electrons for the B/300 sample is noted). Fig.6.XRD spectra of all samples types including an insert zoomed in view of two Ti peaks present in both NB/NH Ti and B/300 Ti samples,with annotated crystal planes from Mg(ICDD PDF 00–035–0821;Black)and Ti(ICDD PDF 00–044–1294;Red). 3.1.3.XRD XRD analysis(Fig.6)of the Mg control sample demonstrated peaks at ca.32.2°,34.4°,36.6°,47.8° and 57.4°,which were in good agreement with the ICDD database file for Mg(PDF 00–035–0821)for peak position,however,the peak intensities revealed preferred orientation toward the(002)crystal plane.NB/NH Ti and B/300 Ti coatings exhibited the addition of small,broad peaks at 38.2° and 40.0° corresponding to the ICDD database file for Ti(PDF 00–044–1294)at the(002)and(101)Ti planes,respectively.The NB/NH Ti coating also showed a bias toward the(002)plane,whilst B/300 had an approximately equal split between the two plane orientations.Chemical treatment of both NB/NH and B/300 Ti sputtered coatings resulted in loss of Ti peaks,while Mg peaks remained unaltered.No titanate peaks were observed for any of the converted samples. Fig.7.Raman spectra of all samples with annotated bands.For the NB/NH Ti and B/300 Ti samples,A=anatase and R=rutile. 3.1.4.Raman spectroscopy Raman spectroscopy(Fig.7)of the NB/NH Ti samples contained bands corresponding to anatase/rutile mixed phases with bands at ca.169 cm−1distinct to the anatase structure,whilst bands at ca.245,417 and 600 cm−1are from the overlay of both.NB/NH NaTC and B/300 NaTC samples both demonstrated a band at ca.194 cm−1attributed to the Na—O—Ti bending mode and bands at ca.282 cm−1and 436 cm-1characteristic of Na—O—Ti stretching modes.The band at ca.440 cm−1was characteristic of Ti—O bending,whereby Ti and O atoms were 6-and 3-coordinated,respectively.The band at ca.893 cm−1is due to Ti—O stretching modes,while bands at 625 and 691 cm−1can be assigned to Ti—O—Ti octahedral[TiO6]vibrations. CaTC Raman spectras differed between NB/NH and B/300 samples,with the NB/NH CaTC sample exhibiting bands associated with the underlying Mg substrate,as described above.However,both samples exhibited the presence of bands at ca.185,440 and 276 cm−1corresponding to the Ca—O—Ti bending mode and Ca—O—Ti stretching modes,respectively.Additionally bands present at ca.700 and 798 cm−1were suggested to be due to Ti—O—Ti stretching modes,and ca.870 cm−1from the Ti—O stretching mode,emerging within a broad band between 582 and 943 cm−1. 3.2.1.Potentiodynamic polarisation analysis Fig.8 depicts typical Tafel polarisation curves for the Ticoated Mg samples(NB/NH Ti and B/300 Ti)and the titanate(NaTC and CaTC suffixes)converted samples.Samples that occupied the lower right quadrant on the graph relative to the Mg control had both lower corrosion current density(icorr)and higher corrosion potential and were thus relatively more stable within the solution with a lower tendency to corrode.It was clear from the data presented that the NB/NH CaTC sample exhibited the lowest icorrand highest Ecorrvalues(ca.−1.33V and 0.06mA/cm2,respectively.See Table 6)of the samples tested,particularly compared to the Mg control(ca.−1.49V and 0.31mA/cm2,respectively)exhibiting the highest icorrand lowest Ecorrvalues,respectively.There were clear trends noted for the NB/NH samples,which showed an increase in Ecorrvalues in the following order:Mg 3.2.2.SEM of electrochemically degraded samples Following electrochemical corrosion,the morphological changes occurring on the surface were explored via SEM analysis(see Fig.9).All samples exhibited cracking at the surface,with significant alteration to the surface roughness,anticipated through crevice or pitting corrosion.All titanate converted samples maintained discrete regions characteristic of titanate surfaces,with clear formation of precipitates,in the form of nanoneedles rich in magnesium,chlorine,and oxygen,as detailed from EDX mapping(Fig.S1)exemplified in the B/300 NaTC sample(Fig.9D),and nano-features rich in calcium,phosphorous,and oxygen on the NB/NH NaTC sample(Fig.9C). 4.1.1.DC magnetron sputtered Ti coatings Generation of a suitable barrier between Mg and the surrounding extracellular fluid is a complex and demanding challenge in order to mitigate additional necessary surgeries to remove non-degradable fixation devices.This study explored a novel approach for generating bioactive titanate layers onto biodegradable Mg,to facilitate use under in vivo corrosion conditions.Recent studies have investigated the potential of titanate layers for increased corrosion protection,such as the study conducted by Arumugam et al.,however,the substrate material utilised was a Ti-20Nb-13Zr alloy;a nonbiodegradable material[33].Their study demonstrated improved corrosion resistance of titanate converted surfaces,exemplifying their potential as a corrosion inhibition surface.To date,the presented work was the only such study of titanate coatings being used to modify the corrosion rate of Mg-based materials. Fig.8.Representative Tafel plots from potentiodynamic polarisation curves of all coating samples in reference to Mg controls.Left-hand graph combines all samples,whilst the top right and bottom right graphs show localised regions of the B/300 and NB/NH samples,respectively,for better trend observations. Table 6Ecorr and icorr values demonstrating the effect of coating on the degradation rate of Mg.Error values are standard error;n=3.The values for pure Mg have been compared with similar studies within the literature and are within an agreeable tolerance despite the variance in testing methodologies[25–32]. SEM micrographs of the Ti coated(NB/NH Ti and B/300 Ti)and native Mg discs(Fig.1),demonstrated clear evidence of the magnetron sputtering methodology providing good step coverage,as detailed by Swann[10].The Ti coating structure appeared to be columnar for all the NB/NH samples,as confirmed via XRD(Fig.6),which is in good agreement with previous work[15],with a preferential orientation in the(002)plane(Ti PDF 00–044–1294)characteristic of such coatings.However,the B/300 samples,exhibited a more equiaxed structure akin to bulk materials[15].This was due to the increased energy of deposited Ti species by the combination of higher bias and temperature.The presence of the Mg peaks in the sample types tested was due to the X-ray penetration depth being greater than the thicknesses of the produced coatings[34]. There was good agreement between the characterisation techniques used to quantify the Ti coatings deposited on the Mg substrate,however,due to the shallow penetration depth of Raman and XPS,only the top passivated surface layer(caused by atmospheric exposure)was detected.Raman analysis(Fig.7)demonstrated clear anatase and rutile modes for both the NB/NH and B/300 Ti samples(similar to bands exhibited in studies by Exarhos[35],Ocana et al.[36],and Hsu et al.[37]),with the NB/NH sample exhibiting a preferred anatase structure,whilst the B/300 Ti had equal anatase and rutile phases.This was expected since the atomic energy provided during the ion-bombardment process was higher in the B/300 sample due to the-100V bias and 300 °C substrate heating,allowing atomic reordering to occur into the higher energy rutile phase;similar to the findings presented by Simionescu et al.[38].These peaks were generated from Ti—O bonds,either through vibration,stretching or bending,and can be seen clearly in the XPS spectra presented(Fig.5).The Ti found within the titania layer,which is due to the passivation of the Ti coating with air,is present in all of the possible valence states:Ti4+,Ti3+,Ti2+,and Ti,however,preferential formation of the Ti4+valence state,akin to TiO2(Anatase/Rutile)was noted.The Ti3+valence state was statistically more likely,compared to the Ti2+state due to thermodynamic favourability,as outlined by Hanawa et al.[39]. Fig.9.SEM micrographs of electrochemically degraded samples in DMEM.A)NB/NH Ti with insert A1=Mg;B)B/300 Ti;C)NB/NH NaTC;D)B/300 NaTC;E)NB/NH CaTC and F)B/300 CaTC.Micrographs A1,C1,D1,E1 and F1 are all higher resolution areas of interest,particularly noting regions akin to nanoporous titanate structures. 4.1.2.Sodium titanate conversion SEM imaging of NB/NH and B/300 NaTC samples(Figs.1C and 2C)revealed the characteristic nano-porous structure of sodium titanate expected from the chemical treatment used[40].Successful conversion of the Ti sputtered surface to sodium titanate was supported by EDX(Table 3)and XPS analysis(Fig.5 and Table 5),both confirming the presence of Na—O.XPS analysis also showed a change in the quantity of deconvoluted Ti 2p doublet peaks,with four doublets of each oxidation state reduced to one doublet of Ti(IV)at 458.5eV(2p 3/2),characteristic of the TiO6octahedral structure of sodium titanate[20].In addition,Raman spectra(Fig.7)of both NaTC samples exhibited bands expected of sodium titanate,as detailed by Viana et al.[41]and Zhang et al.[42],further supporting successful conversion.SEM cross-sections(Figs.1 and 2)detailed two distinct layers in the coating:Ti coating and the sodium titanate structure.The increase in the total thickness of the coating suggests that the titanate structure grows from the Ti base,while the Ti coating reduces in thickness,providing material for titanate growth(Fig.10).This suggested that the thickness of the titanate layer was not limited by Ti thickness(>0.5μm),and thus the thickness of the sputtered Ti coating could be reduced further and still produce the same thickness of titanate structures.This would not only reduce the coating time,improving efficiency,as well as reducing the residual stress of the coating,which is partially dependant on thickness[43].The disadvantage of residual Ti in the coating is the possibility of long term complications of Ti metal breakdown[44]as well as galvanic corrosion occurring between Mg and Ti metals[45].Fig.10 demonstrated the change in coating thickness upon titanate conversion.Optimisation of the coating would involve the reduction of x2to zero,while maximising y1thickness via minimisation of x1. Fig.10.Schematic of the effect on coating thickness due to titanate conversion of the original titanium coating.x1 is the original titanium coating thickness,x2 is the post-titanate converted titanium thickness,Δx is the reduction in Ti thickness or penetration of the titanate layer,x2 is the new Ti thickness,with y1 being the thickness of the produced titanate layer. The presence of Ca in XPS and EDX elemental analyses(Table 3),detected in NaTC samples,was suggested to be due to Ca contamination of the NaOH used for hydrothermal conversion;this has been observed in sodium titanate synthesis[46].Ca2+bonds preferentially,due to increased electrostatic attraction,over Na+within the titanate structure,inhibiting the apatite forming ability as a result of the reduced release of Na+[46].Despite this,the confirmation of a sodium titanate layer highlights a novel method for coating Mg substrates with an osteoconductive bioactive surface.A proposed hypothesis from the authors,described the potential for magnesium titanate to form,due to the localised contact between the Ti and Mg surfaces in the presence of an alkaline aqueous environment:if Mg2+ions were present in solution they would exchange with Na+ions in the forming titanate due to preferential bonding of multivalent ions[47].This however was not observed,and suggested that the Mg substrate was passivated with an oxide/hydroxide layer in the presence of the high molarity NaOH(pH>12),similar to the findings of Lips et al.[48],and Ismail et al.[49]. 4.1.3.Calcium titanate ion-exchange EDX(Table 1)elemental compositions between NaTC and CaTC and XPS elemental analysis(Table 5 and Fig.5)exemplifies the replacement of Na+content for Ca2+for the CaTC samples,indicating successful conversion of sodium titante to calcium titante.XPS further supported this(Table 5 and Fig.5)due to the loss of the Na 1s peak,the emergence of a clear Ca doublet,as well as a distinct alteration in the realtive peak intensities of the O 1s deconvolutions due to a change in bonding from Ti—O—Na to Ti—O—Ca[50].The SEM surface images(Fig.1)possess the same nanoporous morphology as sodium titanate,whilst Raman analysis(Fig.7)demonstrated the same bands as the NaTC samples,indicative of the isomorphic ionic conversion from sodium to calcium titanate[51,52]. The CaTC samples also exhibited precipitation on their surfaces(Figs.1E,2E,and 3),identified as being rich in Ca and O via EDX mapping(supplementary Fig.S1)and XPS analysis(peak position 346.8eV,from Yaseen et al.[53]),suggesting Ca(OH)2precipitation due to Ca(OH)2solution’s low solubility[53,54].This could potentially be resolved through further wash steps within the methodology,however this may cause unnecessary aqueous exposure of the Mg substrate.CaCl2has previously been used in calcium titanate synthesis[55],however this was deliberately avoided as the presence of Cl−ions in solution accelerates Mg degradation[56].Ca(OH)2has been used in dentistry to promote hard tissue growth in teeth from dissolution of Ca2+and antimicrobial activity by increasing local pH[57].Hence,the presence of this salt could be advantageous in the correct application[44,55,58]. From the preliminary electrochemical degradation data presented,the NB/NH CaTC sample outperformed all other sample types tested.There was a marked increase of 0.16V compared to the uncoated Mg sample,and an increase of 0.15V on the Ti coated sample alone.It was hypothesised that the inclusion of calcium within the titanate structure may have a beneficial effect on the corrosion resistance as Ca has been shown to be beneficial in Mg alloying or coatings[59,60].However,in both B/300 and NB/NH samples,this was clearly not the case with the corrosion potential,Ecorr,demonstrating no significant difference between the NaTC and CaTC samples.However the Ecorrresults showed a clear qualitative trend for the NB/NH samples:Mg>NB/NH Ti>NB/NH NaTC>NB/NH CaTC. On the NaTC samples(both NB/NH and B/300)there is a clear increase in the formation of calcium,phosphorous and oxygen rich regions,likely from the DMEM solution used.Titanates produced via aqueous chemical treatments,have the ability to facilitate complex ion-exchange reactions due to their ionic structure,which over time,will form apatite both in SBF in vitro and extracellular fluid in vivo.This ability enables titanates to generate bone,enhancing the adhesion between the osseous-environment and the implant.Combining this property with a degradable material such as Mg,can enhance the bonding of the fracture fixation implant,enabling bone healing to occur at the interface of the fracture ends,whilst also facilitating a more controlled degradation of Mg. As described by Wei et al.[61],nanorods/nanowhiskers/nanoneedles;all names widely used in the literature for similar structures,can form from MgO,Mg(OH)2,in addition to the more complex Mg2(OH)3Cl·4H2O.As noted in the NB/NH NaTC samples,there is clear formation of Mg,Cl,and O rich(Fig.S1)nanoneedles on the sample’s surface,potentially composed of Mg2(OH)3Cl·4H2O,although further comprehensive analysis would be needed to confirm this due to the size of the structures present. EDX mapping(Fig.4)of all titanate samples revealed cracking and partial delamination of the coatings to varying degrees.Delamination was due to the release of residual stresses within the Ti sputtered coatings upon conversion to titanate and a poor interfacial strength between the coating and the Mg substrate,even with the use of magnetron sputtering,which is known for good film adhesion[62].Comparison of relative delamination(Table 4)showed a higher degree of delamination present in the B/300 samples,attributed to the higher residual stresses present in those samples due to the B/300 sputtering parameters[15].The use of a bias voltage and higher temperature in the sputtering procedure results in higher energy bombardment of the surface by Ti ions,increasing local temperature and the compressive stress of the coating upon cooling. Both XPS(Table 5)and EDX(Table 3)elemental analyses show the presence of Mg post conversion.As XPS is a surface analysis method,Mg content detected is due solely to delamination of the coating exposing the substrate surface.It must be noted however that the Mg content from EDX measurements was still proportional to the degree of delamination,despite the increased penetration depth.The appearance of Mg bands in the Raman spectra for the NB/NH CaTC sample(Fig.7)suggests significant delamination of the coating,as the Mg bands are not present in the other titanate sample spectra. Any degree of delamination is unfavourable for a coating intended to reduce the rate of degradation as it not only exposes the substrate,leaving areas as if untreated,but could create crevices where pitting corrosion could occur[63].Future work should focus on the elimination of such delamination,which could involve many different routes:the addition of an interlayer to mediate the Ti-Mg interface;reduction of coating thickness minimising residual stress in the coatings;or the use of alloys of magnesium to increase the interface strength to the sputtered Ti and/or increase Tmof the substrate to allow heat treatment to relieve the residual stress before chemical treatment,are a few directions this research could take.Despite the degree of delamination,the NB/NH CaTC sample still performed favourably compared to the Mg substrate alone and exhibited minimal delamination. The demanding paradigm of reducing the degradation rate of magnesium to an acceptable standard for orthopaedic applications has long been a significant issue in biomaterials science.This paper demonstrates the first insights into the tailoring of Mg’s degradation rate through the successful application of both sodium and calcium-containing titanate structures,of which,has yet to be achieved in the literature. Formation of nano-porous surface morphologies characteristic of titanate structures were achieved and determined via SEM(surface and cross-section)analysis.The thickness of the Ti layer utilised in this study was thinner than in previous studies(ca.500nm vs.4μm),and demonstrated titanate structures of similar thicknesses to previous studies(ca.1.5μm).This concluded that an equilibrium state has been achieved both through oxygen penetration and Ti depth(>0.5μm),to produce similar titanate thicknesses despite different Ti thickness. Despite the preliminary data demonstrating the NB/NH CaTC sample provides corrosion protection for Mg substrates(Ecorr=ca.−1.33vs.−1.49V;icorr=ca.0.06vs.0.31mA.cm−2,respectively),further work is necessary to address the issue of coating delamination,which was exhibited in the majority of samples tested,with the best performing sample type(NB/NH CaTC)exhibited the lowest coating delamination.This can be achieved by either enhancing the interfacial strength of the coating with the Mg substrate,or reducing the residual stress of the sputtered coatings. Declaration of Competing Interest The authors declare that they have no known competing financial interests or personal relationships that could have appeared to influence the work reported in this paper. Acknowledgements This work was supported by the Engineering and Physical Sciences Research Council[grant numbers EP/K029592/1,EP/L022494/1].The authors would like to gratefully acknowledge the Nanoscale and Microscale Research Centre(nmRC)at the University of Nottingham for FEG-SEM,and Raman access.In particular,the authors would like to thank Philip Wadge,for assistance and discussions regarding corrosion quantification. Supplementary materials Supplementary material associated with this article can be found,in the online version,at doi:10.1016/j.jma.2020.07.001.1.Introduction
2.Materials and methodology
2.1.Substrate preparation
2.2.Materials characterisation


3.Results
3.1.Topographical,structural and compositional analysis




3.2.Combined degradation analysis
4.Discussion
4.1.Topographical,structural and compositional analysis

4.2.Electrochemical degradation and delamination analysis
5.Conclusions
杂志排行
Journal of Magnesium and Alloys的其它文章
- Modified embedded-atom method interatomic potentials for Mg–Al–Ca and Mg–Al–Zn ternary systems
- Dual alloying improves the corrosion resistance of biodegradable Mg alloys prepared by selective laser melting
- The corrosion behavior of Mg–Nd binary alloys in the harsh marine environment
- In vitro and in vivo evaluations of Mg-Zn-Gd alloy membrane on guided bone regeneration for rabbit calvarial defect
- In vitro corrosion resistance,antibacterial activity and cytocompatibility of a layer-by-layer assembled DNA coating on magnesium alloy
- Relieving segregation in twin-roll cast Mg–8Al–2Sn–1Zn alloys via controlled rolling
