The utility of two-dimensional shear wave elastography and texture analysis for monitoring liver fibrosis in rat model
2021-03-05LiHongGuGungXingGuPingWnFengHuLiQingXi
Li-Hong Gu , , Gung-Xing Gu , Ping Wn , Feng-Hu Li , Qing Xi ,
a Department of Liver Surgery, Renji Hospital, School of Medicine, Shanghai Jiaotong University, Shanghai 200127, China
b Department of Ultrasound, Renji Hospital, School of Medicine, Shanghai Jiaotong University, Shanghai 200127, China
Keywords:Shear wave elastography Ultrasound Texture analysis Fibrosis Rat
ABSTRACT Background: Liver fibrosis is a common pathological change caused by a variety of etiologies. Early diagnosis and timely treatment can reverse or delay disease progression and improve the prognosis. This study aimed to assess the potential utility of two-dimensional shear wave elastography and texture analysis in dynamic monitoring of the progression of liver fibrosis in rat model.Methods: Twenty rats were divided into control group ( n = 4) and experimental groups ( n = 4 per group)with carbon tetrachloride administration for 2, 3, 4, and 6 weeks. The liver stiffness measurement was performed by two-dimensional shear wave elastography, while the optimal texture analysis subsets to distinguish fibrosis stage were generated by MaZda. The results of elastography and texture analysis were validated through comparing with histopathology.Results: Liver stiffness measurement was 6.09 ±0.31 kPa in the control group and 7.10 ±0.41 kPa,7.80 ±0.93 kPa, 8.64 ±0.93 kPa, 9.91 ±1.13 kPa in the carbon tetrachloride induced groups for 2,3, 4, 6 weeks, respectively ( P < 0.05). By texture analysis, histogram and co-occurrence matrix had the most frequency texture parameters in staging liver fibrosis. Receiver operating characteristic curve of liver elasticity showed that the sensitivity and specificity were 95.0% and 92.5% to discriminate liver fibrosis and non-fibrosis, respectively. In texture analysis, five optimal parameters were selected to classify liver fibrosis and non-fibrosis .Conclusions: Two-dimensional shear wave elastography showed potential applications for noninvasive monitoring of the progression of hepatic fibrosis, even in mild fibrosis. Texture analysis can further extract and quantify the texture features in ultrasonic image, which was a supplementary to further visual information and acquired high diagnostic accuracy for severe fibrosis.
Introductio n
Liver fibrosis is a common pathological change caused by a variety of etiologies. Early diagnosis and timely treatment can reverse or delay disease progression and improve the prognosis [1 , 2]. Liver biopsy is the gold standard for the diagnosis of liver fibrosis. However, biopsy is invasive and can lead to injury and bleeding. Furthermore, liver biopsy is not a good dynamic monitoring method due to repeated puncture [3 , 4]. Conventional ultrasound is the preferred method to evaluate diffuse liver disease which is noninvasive, convenient and real-time. But the diagnostic accuracy of liver fibrosis is not satisfactory, especially at an early stage [5]. In addition, this approach lacks quantitative parameters for liver fibrosis staging.
In recent years, the study of noninvasive techniques which based on elastic properties of soft tissue was encouraging [6]. In pace with the evolving of the research, some literatures reported that the cut-offvalue for staging liver fibrosis induced by different etiology were diverse, besides, some confounding factors such as intrahepatic and extrahepatic cholestasis, acute inflammation, congestion and outflow tract obstruction can also alter liver stiffness[7 –9]. Therefore, it will be more reliable to dynamically observe the change of elasticity with the development of liver fibrosis in a cohort of homogenous cases. Besides, the visual information of ultrasonic image should be analyzed and quantified to offer more texture feature. The technique of texture analysis can obtain the information of gray value and relative position in the image and generate a series of texture features describing the structure [10].
In this study, we used two-dimensional shear wave elastography (2-D SWE) and texture analysis to access the potential application of 2-D SWE and texture analysis in dynamic monitoring of the progression of hepatic fibrosis in rat model.
Methods
Animal model
Adult male sprague-dawley rats with a body weight of 180-220 g were provided by the animal center of our hospital to induce liver fibrosis. Twenty rats were given free drinking water and striped feed. After three days of normal feeding, they were divided into five groups, with 4 rats in each group. Group A was the control group, while group B-E was the experimental groups. 10% CCl4(Sinopharm Chemical Reagent Co., Ltd.,China) diluted by olive oil(CB22BA0 0 07, Sangon Biotech, China) was intraperitoneal injected at a dose of 2 mL/kg, three times a week for 2, 3, 4, and 6 weeks,respectively, to induce liver fibrosis. The changes of liver elasticity and texture parameters were measured. The rats were sacrificed at week 2, 3, 4, and 6 to observe the general morphological and pathological changes of the tissue samples.
Liver stiffness measurements
2-D SWE was performed by a sonographer using the Aixplorer ultrasound diagnostic apparatus (Supersonic Imagine, Aixen-Provence, France) equipped with SL10-2 linear array probe with a frequency of 2-10 MHz.
All animals were fasted for two hours prior to SWE examination and were anesthetized using 1.5% isoflurane in a 1:2 mixture of O2/N2O. The rats were placed in the supine position, and the fur was shaved after anesthesia to fully expose the upper abdominal. Ultrasound transmission gel (Shanghai Medical Dressing Factory, Shanghai, China) was spreaded on the skin of the animals to get a good view.
Conventional ultrasonic scanning was performed first, and the image depth was set to 2.5 cm. After clearly displaying the twodimensional image, SWE mode was used to measure the liver stiffness. The range of SWE sampling frame was 10 ×10 mm, and 1-2 mm below the liver capsule to avoid the influence of liver capsule,and the SWE range was set at 0-100 kPa. When the color filled more than 90% of the sampling frame, the image was stabilized for 3-4 seconds to reduce the measurement error from any artifacts or vascular signals. A 5-mm-diameter region of interest was then positioned ( Fig. 1 ). The quantitative detection area can show the mean modulus of elasticity in the detection area in kPa. Five liver stiffness measurements (LSM) were obtained for each rat and the average was calculated to indicate liver elasticity (kPa).
Texture analysis
MaZda software (MaZda 4, Technical University of Lodz, Institute of Electronics, Poland) was used to analyze the texture of ultrasonic images in our study ( Fig. 2 ). The ultrasonic images were recorded in bmp format and the region of interest was drawn in the ultrasonic image. To minimize the influence of contrast variation and brightness, the ±3 sigma normalization option was selected which was equivalent to the range [μ-3σ,μ+ 3σ],where “μ” was the image mean and “σ” denoted its standard deviation [10]. From the five texture categories consisting of histogram, co-occurrence matrix, run length matrix, absolute gradient and autoregressive (AR) model, 259 kinds of feature parameters were pre-defined. Feature reduction and the optimal texture subsets were selected based on three automatic techniques including fisher coefficient (Fisher), minimization of both classification error probability and average correlation coefficient (POE + ACC) and mutual information measure (MI), respectively. Subsequently, the feature subsets were analyzed by four texture feature classification methods including raw data analysis (RDA), principal component analysis (PCA), linear discriminant analysis (LDA) and nonlinear discriminant analysis (NDA) generated by B11 software (B11 3.3, Technical University of Lodz, Institute of Electronics) and the misclassification number and misclassification rate (MCR) by each method were given.
Histologic evaluation
Rats were sacrificed at week 2, 3, 4 and 6 of CCl4inducing.The gross morphology of the liver was observed. Liver tissues were fixed in 4% paraformaldehyde, and then embedded in paraffin.The slices (4μm) were deparaffinized and stained with Masson’s trichrome. Two slices from each rat were used for histological assessment. Fibrosis staging was evaluated using the METAVIR scoring system on a 5-point scale (F0 –no fibrosis; F1 –portal fibrosis without septa; F2 –portal fibrosis with few septa; F3 –numerous septa without cirrhosis; and F4 –cirrhosis) [11]. Fibrosis was considered significant if the METAVIR F score was ≥2.
Statistical analysis
All data were first analyzed for normality of distribution by using the Kolmogorov-Smirnov test. Continuous normally distributed variables were represented as mean ±standard deviation (SD).Non-normal variables were summarized as median and range. Categorical variables were described as number and percentage. Chisquared test or Fisher’s exact test were used to determine the distribution of categorical variables between groups. The Student’sttest was performed to compare the means of normally distributed variables between groups. To determine differences between groups for continuous non-normally distributed variables,medians were compared using the Mann-WhitneyUtest. Optimal cut-offvalues to predict different fibrosis stages were identified by receiver operating characteristic (ROC) curve. Statistical analysis was performed by using SPSS (IBM SPSS, version 22.0, Armonk,NY, USA). APvalue<0.05 was considered as statistically significant difference.
Results
Liver fibrosis induced by CCl 4 in rat model
All rats in the control group had normal histologic findings,in the experiment group, all 16 rats developed fibrosis, among which 5 rats were scored F1, 6 rats were scored F2, and 5 rats were scored F3, respectively. The gross pathology showed the liver parenchyma and the capsule were gradually turned tough with the progression of liver fibrosis ( Fig. 3 ).
2-D SWE and liver fibrosis stage in rat model
LSM was 6.09 ±0.31 kPa, with a range of 5.3-6.7 kPa in the control group. The rats after 2 week CCl4-induced (LSM 7.10 ±0.41 kPa, range 6.1-8.1 kPa) were classified as F1 in three and F2 in one. The animals after 3 weeks CCl4-induced (LSM 7.80 ±0.93 kPa,range 6.4-9.7 kPa) were classified as F1 in two and F2 in two and those after 4 weeks CCl4-induced (LSM 8.64 ±0.93 kPa, range 7.0-10.5 kPa) were classified as F2 in two and F3 in two. The animals after 6 weeks CCl4-induced (LSM 9.91 ±1.13 kPa, range 7.0-11.6 kPa) were classified as F2 in one and F3 in three ( Table 1 ). Distributions of LSM compared with CCl4-induced time in rat model are shown in Fig. 4 A.

Fig. 1. 2D-SWE images of the rat liver: the range of SWE sampling frame was 10 ×10 mm, a 5-mm-diameter region of interest was positioned (the blue circle), and the liver stiffness measurement was 5.1 kPa.
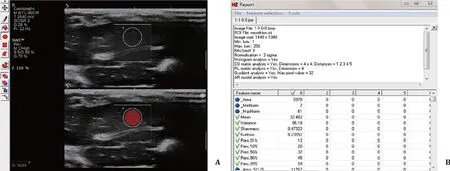
Fig. 2. The ultrasonic image textures analysis in the rat model was generated by MaZda software. A: the region of interest (the red circle) was loaded over image; B: 259 kinds of texture parameters were obtained by feature extraction.

Table 1 Liver fibrosis stage in control group and CCl 4 -induced rat model.
The elastic value of F0 was 6.09 ±0.31 (range 5.3-6.7) kPa,while the elastic values were 6.91 ±0.38 (range 6.1-7.6) kPa,8.05 ±0.70 (range 7.0-9.7) kPa and 10.18 ±0.79 (range 8.9-11.6)kPa at F1, F2 and F3, respectively. Distributions of LSM compared with liver fibrosis stages are shown in Fig. 4 B. Increasing liver stiffness values were correlated with the progression of liver fibrosis in rat model.
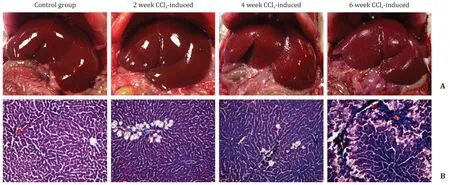
Fig. 3. A: Histologic changes in the control group and 2, 4, 6 weeks CCl 4 -induced groups in rat model, the capsule of the liver gradually turned coarse and the texture became heterogeneous with the development of liver fibrosis. B: Photomicrographs stained with Masson trichrome (original magnification ×200) to evaluate histologic changes, and Masson trichrome indicated the change from normal to peri-sinusoidal fibrosis and bridging fibrosis.

Fig. 4. Liver stiffness measurements in the control group and experimental groups (2 weeks, 3 weeks, 4 weeks, 6 weeks CCl 4 -induced rat model), increasing liver stiffness was correlated with the progressive of liver fibrosis in rat model ( A ). Box-and-whisker plot of 2D-SWE at stage F0, F1, F2 and F3 shows the interquartile range (central box),median (thick line), and range (thin lines) of liver stiffness ( B ).
Texture analysis and fibrosis stage in rat model
Thirty feature parameters were obtained from all the 259 parameters by feature extraction from five texture categories generated by MaZda. Histogram and co-occurrence matrix texture category owned a high proportion of texture parameters in staging liver fibrosis, which at F0 vs F1-F3 ( ≥F1), F0-F1 vs F2-F3 ( ≥F2),F0-F2 vs F3 was 76.67% (23/30), 80.00% (24/30) and 90.00% (27/30),respectively ( Table 2 ). Number of misclassified images and misclassification percentage given for RDA , PCA , LDA and NDA were shown in MCR, respectively ( Table 3 ). The total range of MCR in F0 vs F1-F3 ( ≥F1), F0-F1 vs F2-F3 ( ≥F2), F0-F2 vs F3 was 15%-45% (3/20-9/20), 5%-55% (1/20-11/20) and 0-15% (0/20-3/20), respectively. The MCR percentage given for NDA was more accurate than other classification methods, which at F0 vs F1-F3 ( ≥F1), F0-F1 vs F2-F3( ≥F2), F0-F2 vs F3 was 15%-20% (3/20-4/20), 5%-10% (1/20-2/20)and 0 (0/20), respectively.
ROC curve of 2-D SWE and texture analysis in classified liver fibrosis
The ROC curve of 2-D SWE for the diagnostic performance in staging liver fibrosis generally showed high correction. For discriminating F0 vs F1-F3 ( ≥F1), the area under the ROC was 0.98 (95%CI: 0.96-1.00), with a sensitivity of 95.0% and a specificity of 92.5%at the cut-offelastic value of 6.65 kPa. For classifying stage F0-F1 vs F2-F3( ≥F2) and F0-F2 vs F3, the cut-offelastic value was 7.35 kPa and 9.25 kPa, and the area under the ROC was 0.98 (95% CI:0.96-1.00) and 0.99 (95% CI: 0.98-1.00), with a sensitivity and a specificity of 93.3%, 92.7% and 97.3%, 92.0%, respectively. By Fisher,POE + ACC and MI feature reduction, thirty texture feature subsets were selected. Five optimal parameters for each were selected by ROC for classifying liver fibrosis, MinNorm, Mean, Perc.99%, SumEntrp and Teta2 for discriminating F0 vs F1-F3 ( ≥F1) with a sensitivity and specificity range of 50.0%-87.5% and 50.0%-75.0%,respectively. For discriminating F0-F1 vs F2-F3 ( ≥F2), the five optimal parameters were Mean, Perc.90%, Perc.99%, Variance and Sum-Varnc with the sensitivity and specificity range of 72.7%-90.9% and 6 6.7%-6 6.7%. For classified F0-F2 vs F3, Mean, Perc.10%, Perc.50%,AngScMom and InvDfMom were selected and the range of sensitivity and specificity were 80.0%-100.0% and 73.3%-93.7%, respectively( Table 4 ).

Table 2 The frequency of each feature category selected by Fisher, POE + ACC, and MI feature selection methods in MaZda.
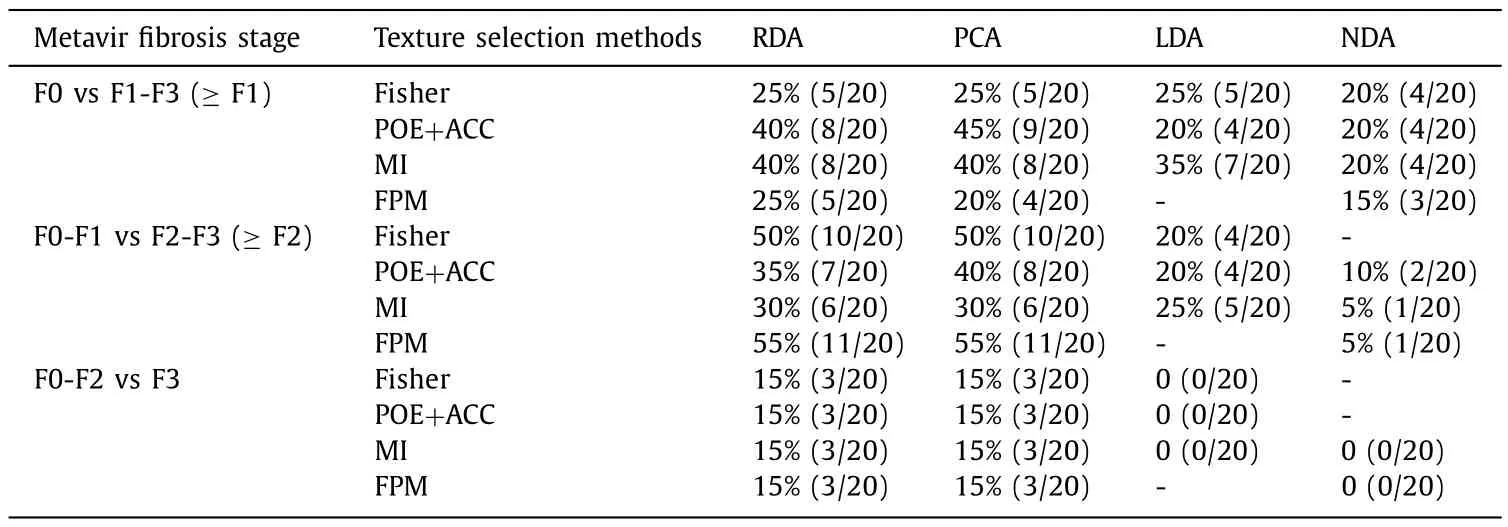
Table 3 Number of misclassified images and misclassification given for RDA, PCA, LDA and NDA.
Discussion
In our study, 2-D SWE and texture analysis were used to dynamically monitor the progression of liver fibrosis in CCl4-induced rat model. We found that liver stiffness was associated with the progression of liver fibrosis, and the fibrosis staging was highly distinguishable, even at an early stage. Ultrasonic imaging texture analysis had high diagnostic accuracy for severe fibrosis, but less accurate for mild fibrosis.
Elastography, first reported by Ophir in 1991, reflects the elastic characteristics of tissues by measuring their stiffness [12]. Elastography has been extensively studied in recent years due to the improvement of elastic modalities, including transient elastography, point-shear wave speed measurement and 2-D SWE [ 13–15].We applied 2-D SWE, the latest elastic technique in our study,which can quantify the liver stiffness and evaluate the degree of liver fibrosis. Compared with Fibroscan, 2-D SWE had the advantage of Doppler ultrasound imaging, which can avoid the influence of hepatic vascular and duct structures when measuring liver stiffness [16 , 17].
Elastography evaluation had achieved satisfactory results in distinguishing severe fibrosis and cirrhosis, but less accurate in distinguishing substantial fibrosis [ 18–20]. However, recent studies suggest that different cut-offvalues should be used for the staging of liver fibrosis due to different etiologies. We dynamically monitored the changes in the elastic value in CCl4-induced rat model,and found that increasing liver stiffness values were correlated with the progression of liver fibrosis and even distinguished the early stage (the score was stage 1). However, further studies reported that several factors including intrahepatic and extrahepatic cholestasis, acute inflammation, congestion and outflow tract obstruction also alter the liver stiffness and may affect the diagnostic accuracy [ 7-9 , 21]. In addition, the estimation of hepatic parenchymal stiffness by elastography did not include the texture information. This information can reflect the homogeneous phenomena in the image and may reduce the influence factors questioned in elastography.
Therefore, in our study, we further analyzed the texture information which showed the gray spatial distribution patterns and relative position of the ultrasonic images to bridge the gap between texture analysis and imaging findings of staging liver fibrosis. Several studies performed texture analysis based on CT and MR, which acquired promising results, however, liver fibrosis evaluated by CT or MR was time-consuming and costly, and was not the first choice for routine follow-up [ 22–24]. Jian et al. assessed the diagnostic value of 2D-SWE combined with textural analysis in liver fibrosis staging. The result showed the capability of texture analysis to diagnose liver fibrosis staging, the study included 4 sets of indexes for texture analysis [25].
In our study, histogram and co-occurrence matrix had the most frequency texture parameters for staging liver fibrosis which was similar to previous study [26]. Histogram is the simplest way to describe texture statistics which reflects the probability of thebrightness of the image on every gray level [27 , 28]. Co-occurrence matrix described the brightness change of the second-order statistic image, and reflected the consistency and relativity of the image in the region [29]. To classify liver fibrosis, the utility of NDA had the lowest MCR and showed a good difference. The sensitivity and specificity of texture parameter calculated by ROC curve showed promising results in classifying severe fibrosis, but less accurate in mild liver fibrosis.
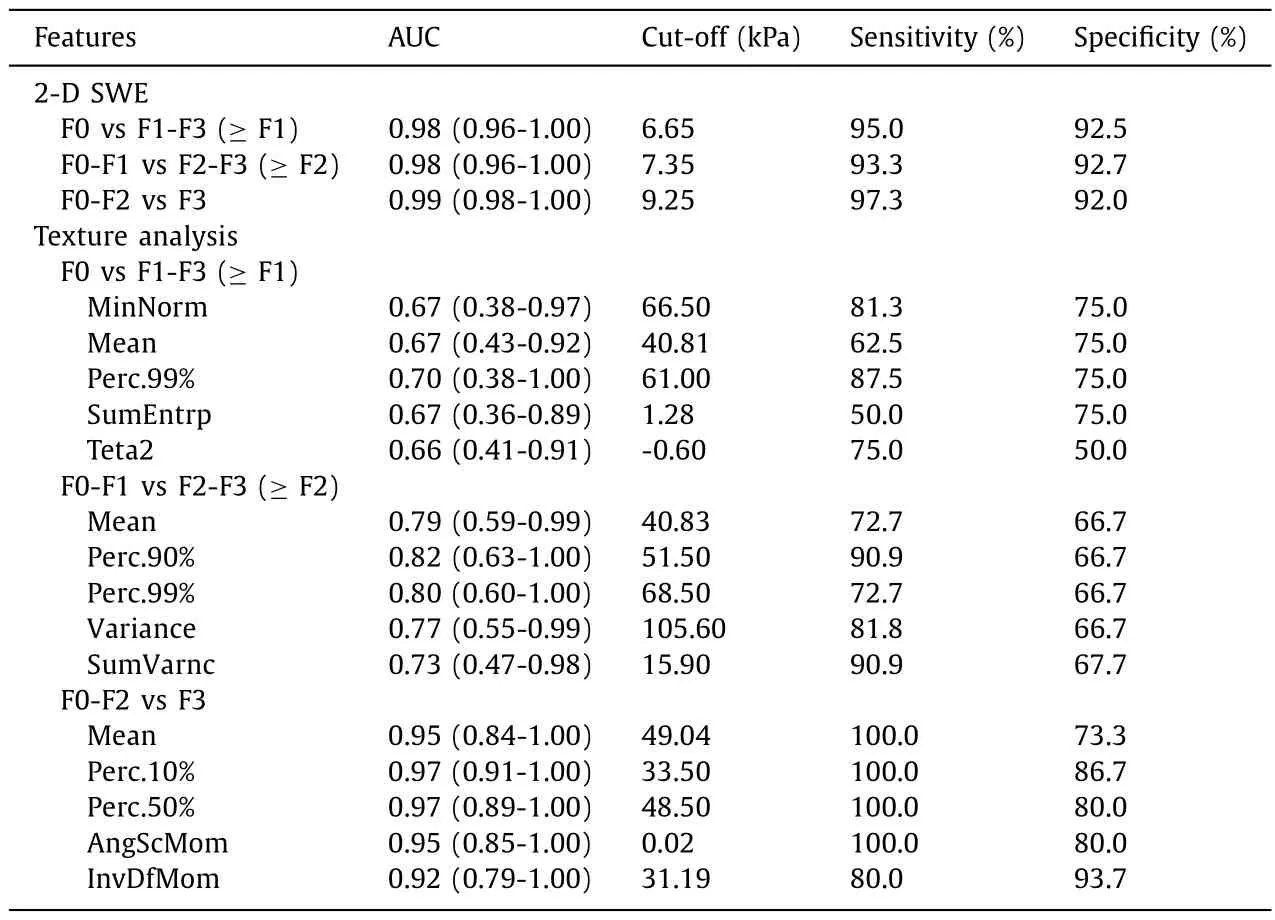
Table 4 The diagnostic accuracy of 2-D SWE and five optimal texture parameters in different degrees of liver fibrosis in CCl 4 induced rat model.
Our study had several limitations. First, a small cohort of rat model induced by CCl4was investigated in our study which may lead to chance findings. The data regarding texture analysis had not been confirmed in an additional validation cohort. Second, the pathogenesis of liver fibrosis induced by CCl4in rats was not totally the same as that of human liver. Liver fibrosis is caused by a variety of etiologies and the cut-offelastography values of liver fibrosis in different etiology are not the same. A liner array transducer was performed in our study, and the liver stiffness measured by a liner array transducer and a convex array transducer was slight different [30 , 31]. Third, the ultrasound was performed by one sonographer, we did not evaluate within-group variation and between-group variation. According to previous studies, the variation between different operators was not significant, and the stability and repeatability of liver stiffness measurement are relatively good [ 32–34].
In conclusion, 2D-SWE showed potential applications for noninvasive monitoring of the progression of liver fibrosis, even in mild fibrosis. Imaging texture analysis can further extract and quantify the texture features in ultrasonic image, which was a supplementary to further visual information and had high diagnostic accuracy for severe fibrosis.
Acknowledgments
None.
CRediT authorship contribution statement
Li-Hong Gu:Data curation, Formal analysis, Funding acquisition, Writing - original draft.Guang-Xiang Gu:Project administration, Investigation, Methodology.Ping Wan:Investigation, Methodology, Funding acquisition.Feng-Hua Li:Supervision, Writing - review & editing.Qiang Xia:Conceptualization, Supervision, Writing- review & editing.
Funding
This study was supported by grants from the National Natural Science Foundation of China (81900594), Clinical Research Plan of Shanghai Hospital Development Center (Grant 16CR3109B)and Shanghai Youth Sci & Tech Talent Jump starting Program(18YF1412700).
Ethical approval
All experiments were performed in accordance with the National Institutes of Health’s Guide for the Care of Use of Laboratory Animals and approved by the institutional animal care and committee of our hospital.
Competing interest
No benefits in any form have been received or will be received from a commercial party related directly or indirectly to the subject of this article.
杂志排行

Hepatobiliary & Pancreatic Diseases International的其它文章
- Liver transplantation and BCLC classification: Limitations impede optimum treatment
- Do the existing staging systems for primary liver cancer apply to combined hepatocellular carcinoma-intrahepatic cholangiocarcinoma?
- Overlap of concurrent extrahepatic autoimmune diseases is associated with milder disease severity of newly diagnosed autoimmune hepatitis
- Aggressive surgical approach in patients with adrenal-only metastases from hepatocellular carcinoma enables higher survival rates than standard systemic therapy
- Integrating transcriptomes and somatic mutations to identify RNA methylation regulators as a prognostic marker in hepatocellular carcinoma
- Impact of referral pattern and timing of repair on surgical outcome after reconstruction of post-cholecystectomy bile duct injury: A multicenter study