Integrating transcriptomes and somatic mutations to identify RNA methylation regulators as a prognostic marker in hepatocellular carcinoma
2021-03-05YueYanYunHaiLuoDaoFengZhengTongMuZhongJunWu
Yue Yan, Yun-Hai Luo, Dao-Feng Zheng, Tong Mu, Zhong-Jun Wu
Department of Hepatobiliary Surgery, The First Affiliated Hospital of Chongqing Medical University, Chongqing 40 0 016, China
Keywords:RNA methylation Hepatocellular carcinoma Prognostic marker Epigenetics
ABSTRACT Background: RNA methylation modifying plays an important role in the occurrence and progression of a range of human cancers including hepatocellular carcinoma (HCC), which is characterized by a mass of genetic and epigenetic alterations. However, the treatment targeting these alterations is limited.Methods: We used comprehensive bioinformatics analysis to analyze the correlation between cancerassociated RNA methylation regulators and HCC malignant features in network datasets.Results: We identified two HCC subgroups (cluster 1 and 2), which had clearly distinct clinicopathological, biofunctional and prognostic characteristics, by consensus clustering. The cluster 2 subgroup correlated with malignancy of the primary tumor, higher tumor stage, higher histopathological grade and higher frequency of TP53 mutation, as well as with shorter survival when compared with cluster 1. Gene enrichment indicated that the cluster 2 correlated to the tumor malignancy signaling and biological processes. Based on these findings, an 11-gene risk signature was built, which not only was an independent prognostic marker but also had an excellent power to predict the tumor features.Conclusions: Our study indicated that RNA methylation regulators are vital for HCC malignant progression and provide an important evidence for RNA methylation, methylation regulators are actionable targets for anticancer drug discovery.
Introduction
Hepatocellular carcinoma (HCC), with approximately 750,0 0 0 deaths each year, is one of the most common lethal cancers worldwide [1]. At present, HCC occurrence and progression are considered an intricate molecular pathological process involving multi-gene alterations and multi-step processes [2]. Persistent inflammatory microenvironment, such as viral infection, obesity and diabetes, causes hepatic parenchymal necrosis and regeneration. The long term inflammation results in the chromosomal instability and gene mutations in the hepatocytes [3–5]. However,the specific mechanics are still unclear and therefore, the potent drugs for molecular targeted therapy are sparse. Sorafenib is so far the only FDA-approved drug for advanced HCCs [6].
Emerging data indicated that RNA methylation regulates RNA splicing, nuclear export, translation and degradation. RNA methylation impacts almost all RNAs, like messenger RNAs(mRNAs) [7], tRNAs [8], microRNAs (miRNAs) [9], circular RNAs(cirRNAs) [10], ribosomal RNAs (rRNAs) [11], small nuclear RNAs(snRNAs) [12]and small nucleolar RNAs (snoRNAs) [13]. The majority of those RNAs are in the forms of N1-methyladenosine(m1A), 5-methylcytosine (m5C) and N6,2 ′ -O-dimethyladenosine(m6A). However, these cancer-associated RNA methylations are on the RNA molecules, and the downstream biological functions are not consistent. A recent study found that m6A demethylase fat mass and obesity associated protein (FTO), acting as an oncogene, is up-regulated in acute myelocytic leukemia (AML), resulting in the decreased m6A and differentiation inhibition; FTO depletion enhances differentiation and decreases cell proliferation, cell colonies formation and promotes apoptosis [14]. Agent inhibiting demethylase FTO catalytic activity has anti-tumor effect via targeting FTO/m6A/MYC/CEBPA signaling pathway [15]. Methyltransferase like 3 (METTL3) has an inhibitory reaction to haematopoietic stem cell differentiation and is up-regulated in AMLs, while METTL3 depletion induces myeloid differentiation and cellular apoptosis [16 , 17]. This irreconcilable opposition is also seen in the gliomas. ALKBH5 as a demethylase is up-regulated in glioblastomas and correlated with poor prognosis, and its down-regulation blocks self-renewal of glioblastoma stem cells and prolongs mice survival [18]. Similarly, depletion of the METTL3-METTL14 complex, which is vital for initiation of m6A methylation process, decreases m6A burdens and facilitates glioblastoma stem cells growth leading to a poor survival [19]. But the recent research has suggested that reducing levels of m6A by silencing METTL3 could inhibit glioblastomas progression and improve the survival [20].
The data above indicate that different tumors or the same tumor at different phases have the differential sensitivity to methylations. HCC is characterized by a mass of genetic and epigenetic alterations, including aberrant activation of WNT signaling pathway and loss-of-function mutation in theTP53suppressor gene [21 , 22].This study aimed to elucidate the role of methylation regulators in HCC at different phase and different differentiation grade, the correlation between each key regulator and HCC clinicopathological feature. We tried to uncover the specific mechanisms of HCC evolution and to facilitate further anticancer drugs discovery.
Methods
Datasets acquisition and preprocessing
Transcriptome sequencing profiling data, corresponding clinical features and annotated somatic mutations of 424 HCC patients were acquired from the Cancer Genome Atlas (TCGA) [23].A meta-data comprising 7 independent expression datasets of 401 HCC patients, including GSE75271, GSE45436, GSE62232, GSE29721,GSE41804, GSE40873 and GSE6222, were obtained from Gene Expression Omnibus (GEO) [24]. The 7 GEO datasets, from Affymetrix Human Genome U133 plus 2.0 Array platforms, have been normalized with Robust Multi-array Average (RMA) algorithm and batch effects corrected by the Combat method. The study was approved by the Committee for Medical Research Ethics of the First Affiliated Hospital of Chongqing Medical University. The clinical features for the TCGA sequencing data were summarized in Table 1 .
Screening cancer-associated RNA methylation regulators
We screened 58 genes of RNA methylation regulators, 55 of them have been reported in high-quality studies in various cancers, 3 of them, includingTRMT10C,NSUN7andBMT2[25]have not yet been well reported in cancer topics, especiallyNSUN7andBMT2, needing further study.
Bioinformatics and statistical analysis
We analyzed the expression of selected RNA methylation regulators under the different clinicopathological characteristics in HCC through “limma” package in R (version 3.6) and screened out the hub genes [26]. To further investigate the possible sharing clinicopathological features of the hub genes, we applied an unsupervised clustering algorithm via “ConsensusClusterPlus” package (clustering by paritioning around medoids, resampling proportion of 0.8) [27]. The Pearson correlation coefficients were carried out to measure the correlation between these hub genes. Next, we used principal component analysis (PCA) to perform dimensionality reduction on the TCGA transcriptional profile and to verify the consensus clustering results described above. Gene ontology (GO)and Kyoto Encyclopedia of Genes and Genomes (KEGG) pathway enrichment analysis were conducted to the genes, which highly express in the clusters, with the Database for Annotation, Visualization and Integrated Discovery (DAVID) ( http://david.ncifcrf.gov ) [28 , 29]. The Gene Set Enrichment Analysis (GSEA) was also performed to corresponding genes further evidencing a specific link between clustering results and HCC clinicopathological characteristics [30].
To mining the prognostic value of the hub genes, we combined univariate Cox regression analysis and LASSO (Least Absolute Shrinkage and Selection Operator) regression analysis to find out a certain robust and succinct subset ("glmnet" package in R) [31]. Consequently 11-gene risk signature has been identified and a coefficient for each gene was also retrieved from the LASSO.A risk score was calculated for the samples using the formula below:

where x is the expression of each selected gene in model for patient i, a is LASSO coefficient for the corresponding gene and r is consistent with the number of genes within the risk signature.
According to the median risk score, we stratified HCC patients into the “high-risk” and “low-risk” group. The Kaplan-Meier (KM)with log-rank test ("survival" package in R) was used to calculate survival in the patients grouped by the different clusters and the risk levels (high or low). Receiver operating characteristic (ROC)curve was built by "survival ROC" package to test the gene signature prediction capability of the 1, 3 and 5-year survival, clusters andTP53as well asCTNNB1mutations [32]. Finally, to assess the genes signature of cancer-associated RNA methylation regulators independence as a prognostic marker in HCC, we use univariate and multivariate Cox proportional hazard regression model to measure the prognostic value of the risk score. To compare categorical variables in different groups, the Chi-square and Fisher exact tests were used. All statistical analyses and graphic visualizations were achieved by R in version 3.6.0 ( https://www.r-project.org/ ).
Results
HCC patients showed clear correlations with up-regulated expression of most cancer-associated RNA methylation regulators
As to these chosen RNA methylation regulators linked to specific human cancers, we first studied the relationships between the genes and HCC pathological features. Expression of each gene in different histological types, including 50 normal liver samples and 374 HCC samples from the TCGA dataset, and 137 normal liver samples and 264 HCC samples from the GEO meta-data, is presented as heat maps ( Fig. 1 A and B). It showed that the expressions of 45 (77.6%) cancer-associated RNA methylation regulator genes were significantly up-regulated,NSUN6was the only gene that expression significantly down-regulated and 4 (6.9%)genes, namelyHENMT1,METTL14,TET2andTRDMT1, were with no significant expression in both TCGA dataset and meta-data of GEO. Rest of the expressions of 8 (13.8%) genes, includingALKBH1,ALKBH3,ALKBH5,ALKBH8,TRMT11,YTHDC1,YTHDC2andZC3H13were with the same trend but no significant expression in the TCGA dataset or GEO validation datasets. The correlations between the gene expression levels ofMETTL6,KIAA1429,IGF2BP1,IGF2BP2,FBL,RNMT,NSUN5andNSUN6, and the histological types were further validated by quantitative box plot ( Fig. 1 C and D). As shown,METTL6,KIAA1429,IGF2BP1,IGF2BP2,FBL,RNMTandNSUN5were increased in the tumor group, whileNSUN6expression was decreased.

Fig. 1. Expression patterns of 58 cancer-associated RNA methylation regulators in HCC with the different histological types (normal vs. tumor). A: The expressions of selected RNA methylation regulators in TCGA dataset; B: the expressions of selected RNA methylation regulators in GEO meta-data; C: gene expression levels of METTL6, KIAA1429,IGF2BP1, IGF2BP2, FBL, RNMT, NSUN5 and NSUN6 quantitative box plot for TCGA dataset; D: gene expression levels of METTL6, KIAA1429, IGF2BP1, IGF2BP2, FBL, RNMT, NSUN5 and NSUN6 quantitatively plotted for GEO meta-data. *: P < 0.05; **: P < 0.01; ***: P < 0.001.
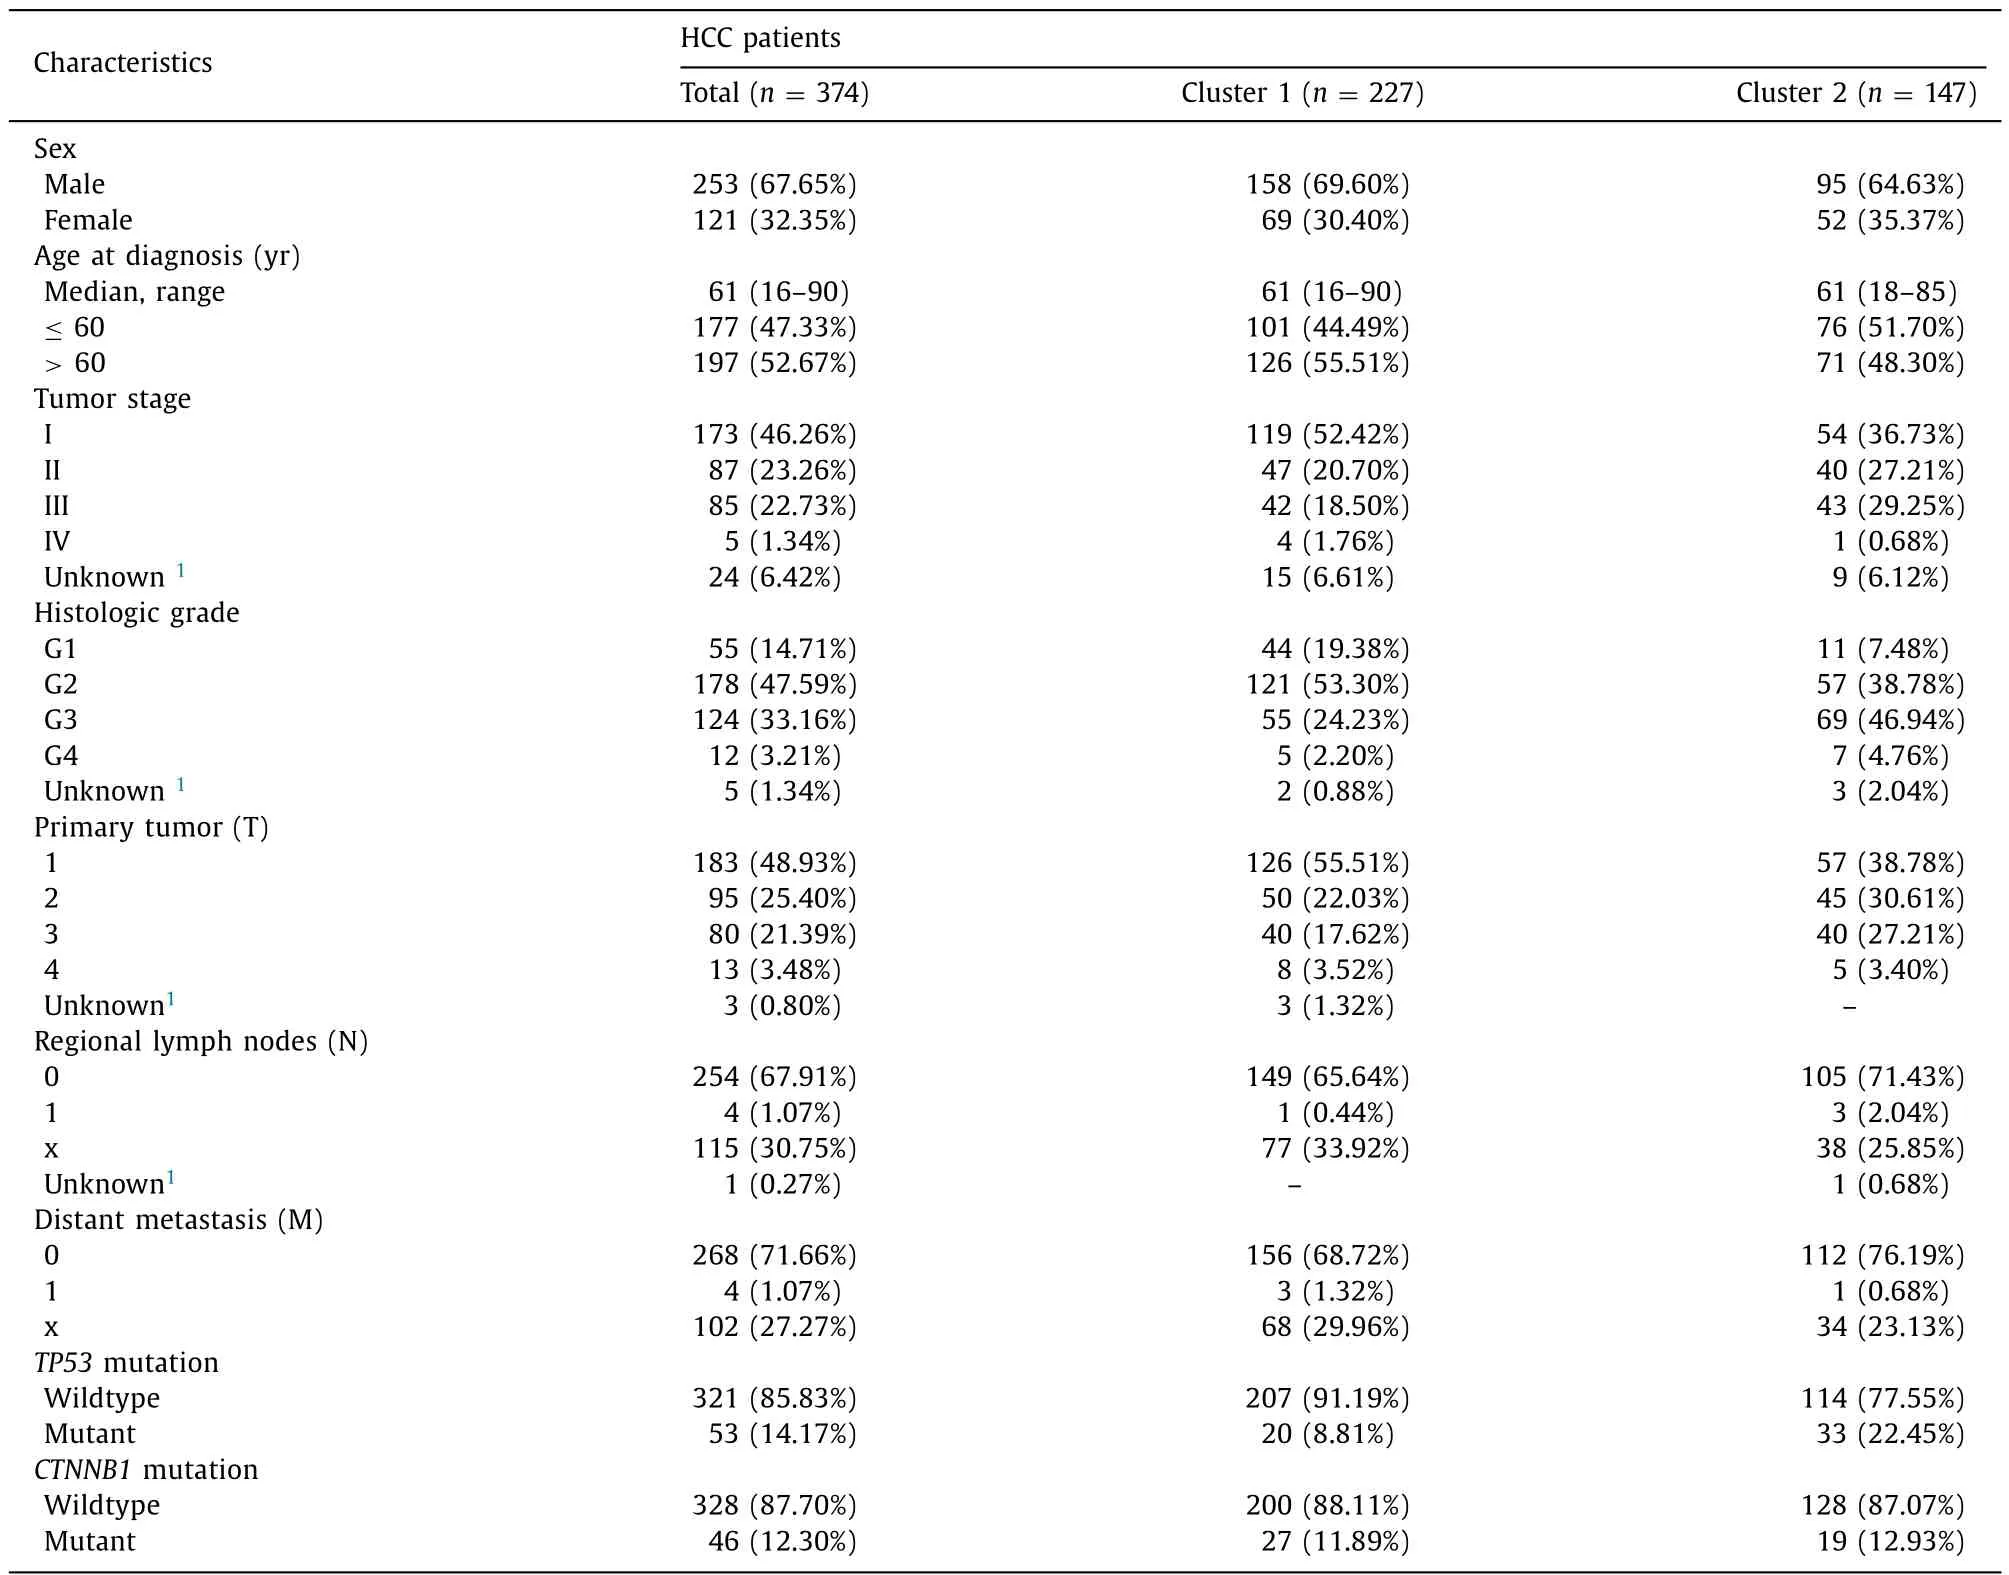
Table 1 The clinicopathological characteristics of HCC patients from TCGA dataset.
Next, we focused on the expression levels of the 58 cancerassociated RNA methylation regulator genes under the different tumor histopathological grades,TP53andCTNNB1mutation status in TCGA dataset ( Fig. 2 A, B and C). The results showed that 38 out of 58 (65.5%) genes were significantly up-regulated in the undifferentiated group (grade 3 and 4) compared with the differentiated group (grade 1 and 2) ( Fig. 2 A), 32 out of 58 (55.2%)genes were significantly up-regulated in theTP53mutants group compared with the wildtype ( Fig. 2 B), and 5 out of 58 (8.6%) genes were significantly up-regulated as well as 7 out of 58 (12.1%) genes were significantly down-regulated in theCTNNB1mutant group compared with the wildtype respectively ( Fig. 2 C).
Increasing malignancy of HCC involves up-regulated expression of cancer-associated RNA methylation regulators in high histopathological grade
In order to narrow the scope of the research and classify the subgroups, we selected 38 hub genes with a significant upregulation within the undifferentiated group, which has been mentioned above, for consensus clustering analysis. According to the proportion of ambiguous clustering (PAC) measurement, when the number of clustering k values range from 2 to 4, each k value seems to be with a lower rate of discordant assignments across the permuted clustering iterations ( Fig. 3 A and B). However, when the k value is 3 or 4, we noticed that the consensus matrix suggested the strong correlations within the corresponding subgroups(Fig. S1). Thus, we further studied the clinical features in HCC patients who have been separated into the “cluster 1” and “cluster 2”finally based upon the 38 selected genes expression patterns. Compared with the cluster 1, the HCC patients in cluster 2 subgroup were significantly correlated with malignancy of primary tumor(P= 0.0127), higher tumor stage (P= 0.0067), higher histopathological grade (P<0.0 0 01) and more likelihood ofTP53mutation(P= 0.0 0 06) ( Fig. 3 C).
Moreover, for a better understanding of the interrelationships between each hub gene, we also analyzed the correlations among them ( Fig. 4 A). In general, it is suggested that the gene expressions were positively correlated with each other, and sorted by correlation coefficients, the top five areHNRNPA2B1andHNRNPC(r= 0.78),TRMT6andMETTL6(r= 0.75),HNRNPCandMETTL3(r= 0.72),RBM15BandYTHDF1(r= 0.72) as well asMETTL6andHNRNPC(r= 0.71). These results are consistent with our previous findings ( Fig. 3 C) and further illustrate the interrelationship of the expressions between each gene of selected RNA methylation regulators.
Next, we investigated the TCGA transcriptome profiling data to test the clustering efficacy, compared survival rates between the clustering subgroups and studied genome annotation of the upregulated genes in the corresponding transcriptome, which have been distributed into the cluster 1 and cluster 2. Principal component analysis (PCA) were carried out to perform dimensionality reduction on the transcriptional profiling data and it showed that two evident distributions segregated by the clustering subgroups( Fig. 4 B). Moreover, we also observed a shorter survival rate in the cluster 2 subgroup than the cluster 1 subgroup (P= 0.001)( Fig. 4 C).

Fig. 2. Expression patterns of 58 cancer-associated RNA methylation regulators in HCC with the different histological grades and mutations in genes. A: The expression levels of selected RNA methylation regulators with different grades; B: the expression levels of selected RNA methylation regulators with TP53 mutation and wildtype; C: the expression levels of selected RNA methylation regulators with CTNNB1 mutation and wildtype. P < 0.05 means statistically significant.
In addition, we found that 432 genes were up-regulated in cluster 1, and 1006 genes were up-regulated in cluster 2 (with fold change>2 and FDR<0.05), and then annotated their functions using the gene ontology (GO) enrichment analysis for the biological processes (BP) ( Fig. 4 D), KEGG pathway analysis ( Fig. 4 E)and gene set enrichment analysis (GSEA) ( Fig. 4 F). The GO enrichment indicated that compared with the up-regulated genes in cluster 1, the counterparts in cluster 2 were enriched in biological processes which probably were linked up with tumor malignant progressions, such as extracellular matrix (ECM) organization, cell cycle, DNA replication, fibroblast proliferation, cytokinesis regulation, regulation of WNT signaling pathway, epithelial-mesenchymal transition (EMT), tissue homeostasis and regulation of phosphorylation ( Fig. 4 D). The KEGG pathway analysis showed that it resembles GO results, with relation to the tumor malignancy signaling pathway ( Fig. 4 E). Besides, GSEA also revealed that the malignant hallmarks of the tumors, including PI3K-AKT-mTOR signaling pathway (NES = 1.61,P<0.001, FDR<0.001), MYC downstream targets activation (v1 set: NES = 1.92,P<0.001, FDR<0.001; v2 set:NES = 1.77,P<0.001, FDR<0.001) and E2F targets (NES = 2.01,P<0.001, FDR<0.001), were significantly correlated with the genes up-regulated in cluster 2 ( Fig. 4 F). All the above findings illustrate that up-regulation of the 58 methylation regulator genes in high tumor histopathological grade were closely correlated with the malignancy of HCC.
Prognostic value of cancer-associated RNA methylation regulators and establishment of an 11-gene risk signature
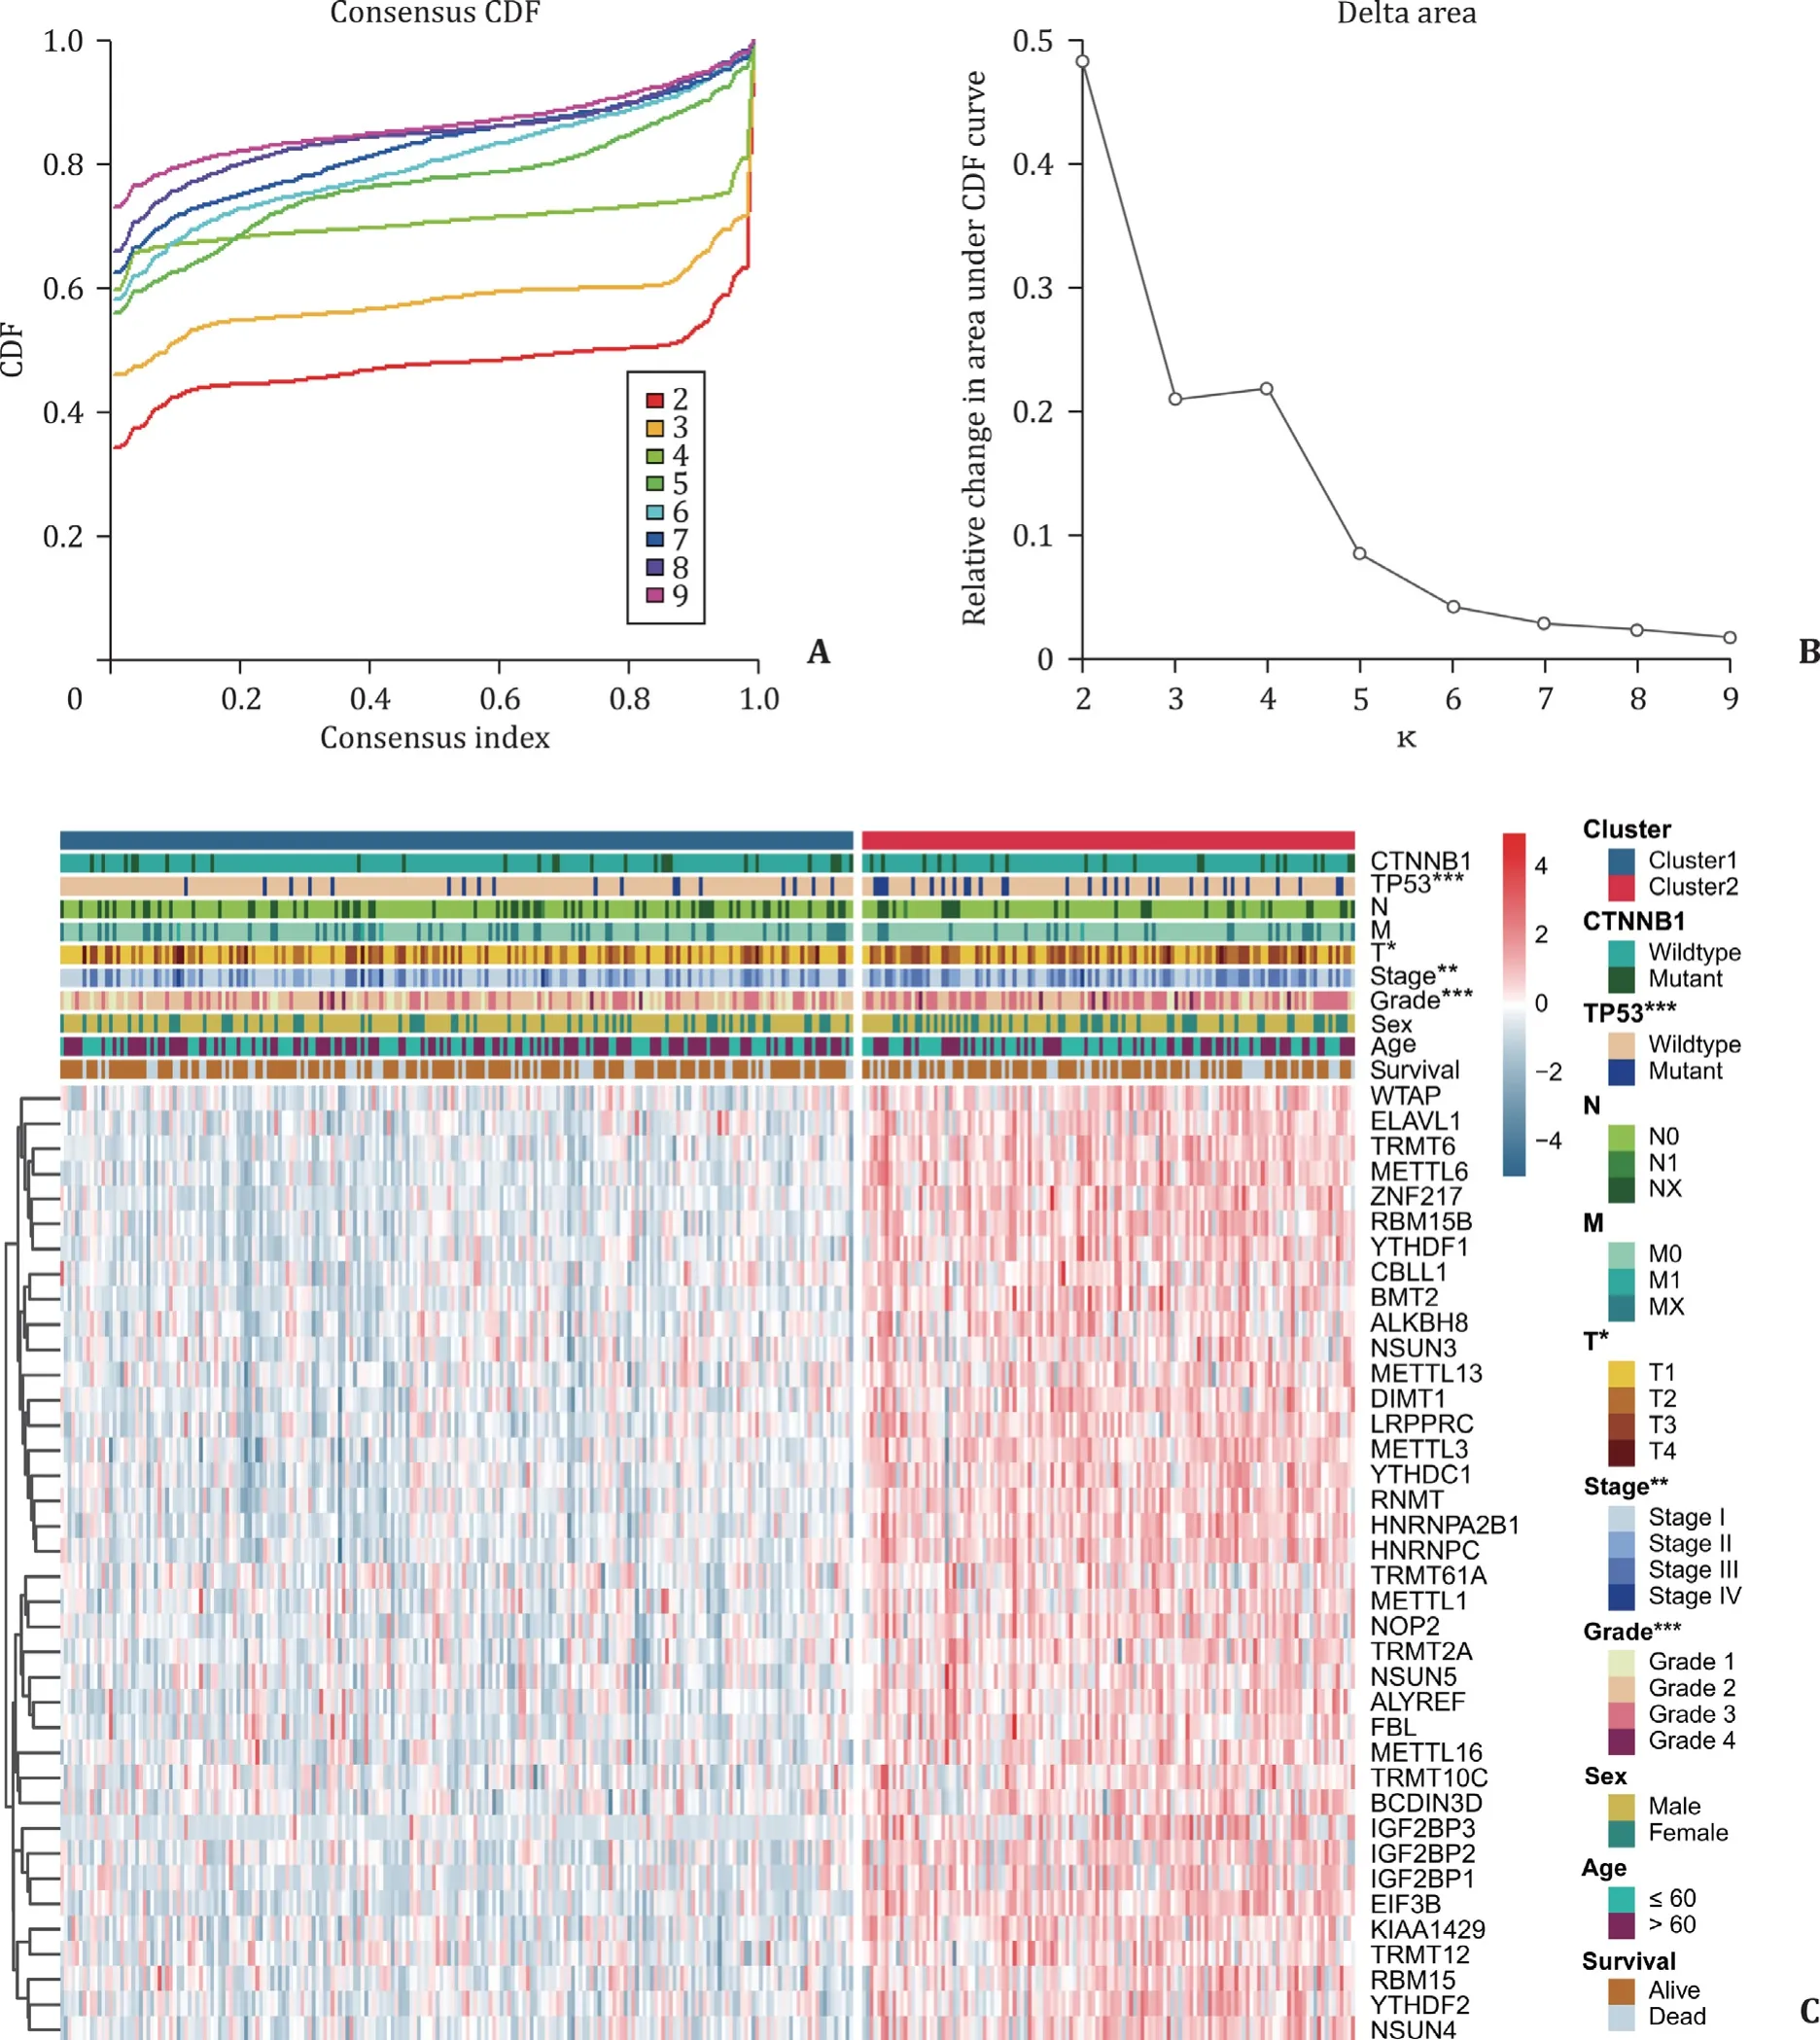
Fig. 3. Consensus clustering to identify the subgroups, and the differential clinicopathological features within cluster 1 and 2. A: Consensus clustering cumulative distribution function (CDF) with k valued 2 to 9; B: relative change in area under the CDF curves with k valued 2 to 9; C: Heat map for clinicopathological features in subgroups (cluster 1 and 2). *: P < 0.05; **: P < 0.01; ***: P < 0.001.
Furthermore we explored the prognostic value of these 38 hub genes that were highly expressed in advanced histopathological grades of HCC. The results, as measured by univariate Cox regression in TCGA dataset, showed that 33 out of 38 (86.8%) tested genes were significantly correlated with the patients survival (P<0.05), while all of these genes affected the patient negatively (HR>1) ( Fig. 5 A). LASSO regression analysis was adopted to build a risk signature based upon the optimal value of lambda ( Fig. 5 B),and the LASSO coefficients for each gene in risk signature were used to calculate every patient’s risk score. Finally, 11-gene signature, namelyMETTL6,TRMT6,YTHDF2,TRMT10C,NSUN4,IGF2BP3,LRPPRC,TRMT61A,YTHDF1,NSUN5andRNMT, has been found, with each gene LASSO coefficient listed in Fig. 5 C. To investigate the prognostic role of the 11-gene risk signature, we separated the patients in TCGA dataset into the low and high risk groups on the basis of the median risk score, which was calculated to be 4.902. We then found that the HCC patients with high risk scores had significantly shorter survival than those with low scores (P<0.001; Fig. 5 D), and the similar results were observed in differentiated group (P<0.001; Fig. 5 E), as well as undifferentiated group(P= 0.022; Fig. 5 F).
Gene risk signature significantly correlated with HCC clinical characteristics and served as an independent prognostic marker
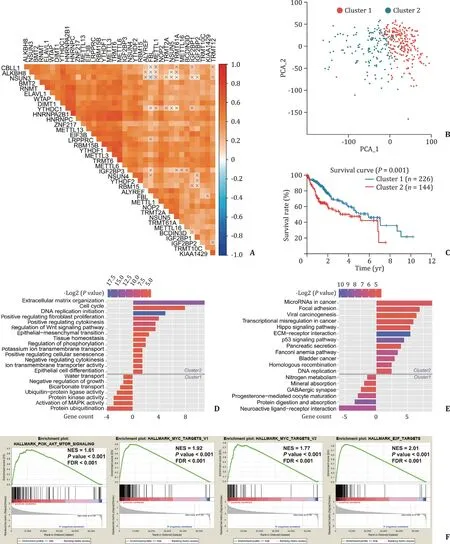
Fig. 4. Interrelationships between each hub gene in subgroups and biological functions enrichment. A: Spearman correlation analysis for hub genes; B: principal component analysis for the whole RNA transcriptome in TCGA dataset; C: Kaplan–Meier survival curves for HCC patients in two clusters; D: Gene ontology (GO) terms for the biological processes of up-regulated genes in the cluster 1 (below the gray line) and cluster 2 (above the gray line); E: Kyoto Encyclopedia of Genes and Genomes (KEGG) pathway enrichment of up-regulated genes in the cluster 1 (below the gray line) and cluster 2 (above the gray line); F: Gene Set Enrichment Analysis (GSEA) for up-regulated genes in cluster 2.
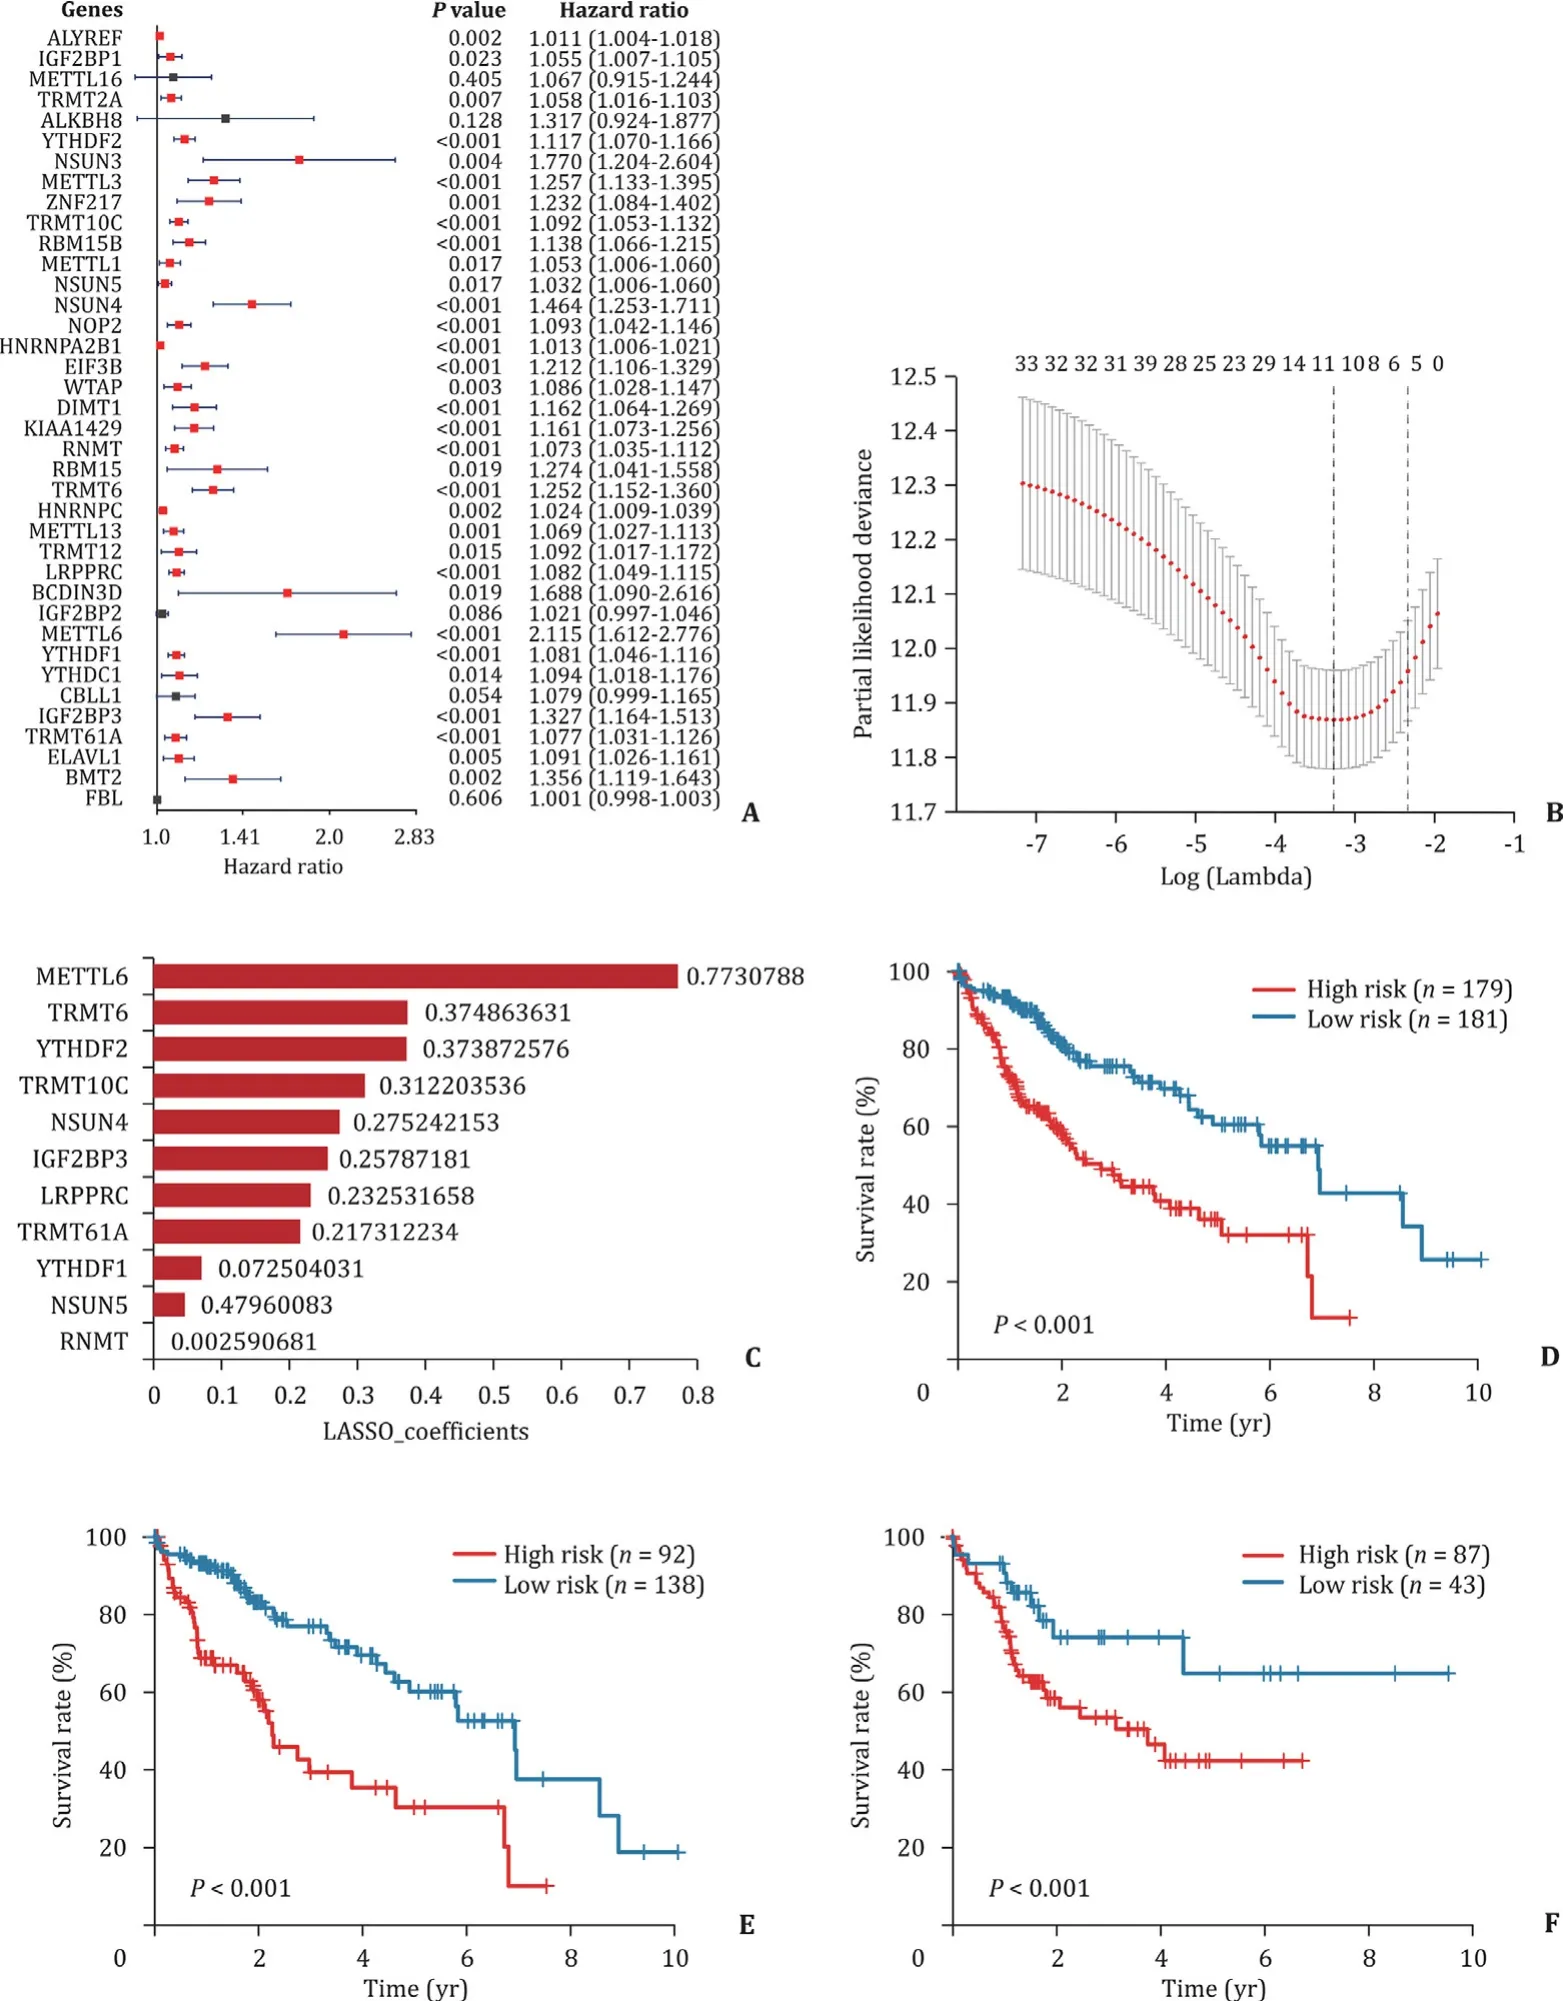
Fig. 5. Risk signature and survivals under the different HCC features in eleven RNA methylation regulators. A: The gene signature first screening by univariate Cox regression for hub genes; B: lambda values calculated by LASSO algorithm for further screening the risk signature; C: coefficients for each gene in final risk signature; D: Kaplan–Meier survival curves for patients in TCGA dataset; E: Kaplan–Meier survival curves for differentiated group patients in TCGA dataset (grade 1/2); F: Kaplan–Meier survival curves for undifferentiated group patients in TCGA dataset (grade 3/4). LASSO: Least Absolute Shrinkage and Selection Operator; TCGA: The Cancer Genome Atlas.
These 11-gene expression patterns of HCC patients were stratified into the “low risk” and “high risk” groups, which is presented as a heat map ( Fig. 6 A). As shown, compared with the low risk group, the HCC patients in the high risk subgroup were significantly correlated with a poor survival status (P= 0.0011), higher histopathological grade (P<0.0 0 01), higher tumor stage (P= 0.0054),malignancy of primary tumor (P= 0.0194), lymph node metastasis(P= 0.0392), distant metastasis (P= 0.0275) andTP53mutation(P= 0.0 0 04) ( Fig. 6 A). Meanwhile, we also quantitatively graphed each clinical feature via the risk score ( Fig. 6 B). The results illustrated that the risk scores were significantly different in HCC patients stratified by survival status, histopathological grade,tumor stage, primary tumor condition, lymph node metastasis,distant metastasis andTP53mutation, whereas the patient’s sex,age at diagnosis orCTNNB1mutation did not, in TCGA dataset( Fig. 6 B).
The ROC curves of the 11-gene risk signature were then used to demonstrate the sensitivity (true positive rate) and specificity(1 minus the false positive rate) in predicting the clinical features of HCC patients in TCGA dataset ( Fig. 7 A). Overall it indicated that this gene risk signature had an excellent power to predict for the 1-, 3- and 5-year survival rate of patients (AUC: 0.865,0.878 and 0.880, respectively), clustering subgroup (AUC: 0.871),CTNNB1mutations (AUC: 0.711) andTP53mutations (AUC: 0.857).In the meantime, its predictive efficacy was better than that of AFP as well as tumor histopathological grade ( Fig. 7 A). Moreover we ran the univariate analysis and multivariate Cox regression for the TCGA dataset to study whether the 11-gene risk signature was an independent prognostic indicator. The results of univariate analysis showed that the tumor stage (P<0.001), primary tumor (T)(P<0.001), distant metastasis (M) (P= 0.023) and risk score (P<0.001) were correlated with the HCC patients survival, but not the age, sex, tumor grade, regional lymph nodes (N),TP53mutation orCTNNB1mutation ( Fig. 7 B). Moreover, after incorporating these clinical features into multivariate Cox regression, the results showed that only the risk scores were significantly associated with the survival. This result indicated that the risk score, driven from 11-gene signature, could independently predict the HCC patients’prognosis (P<0.001, Fig. 7 C).
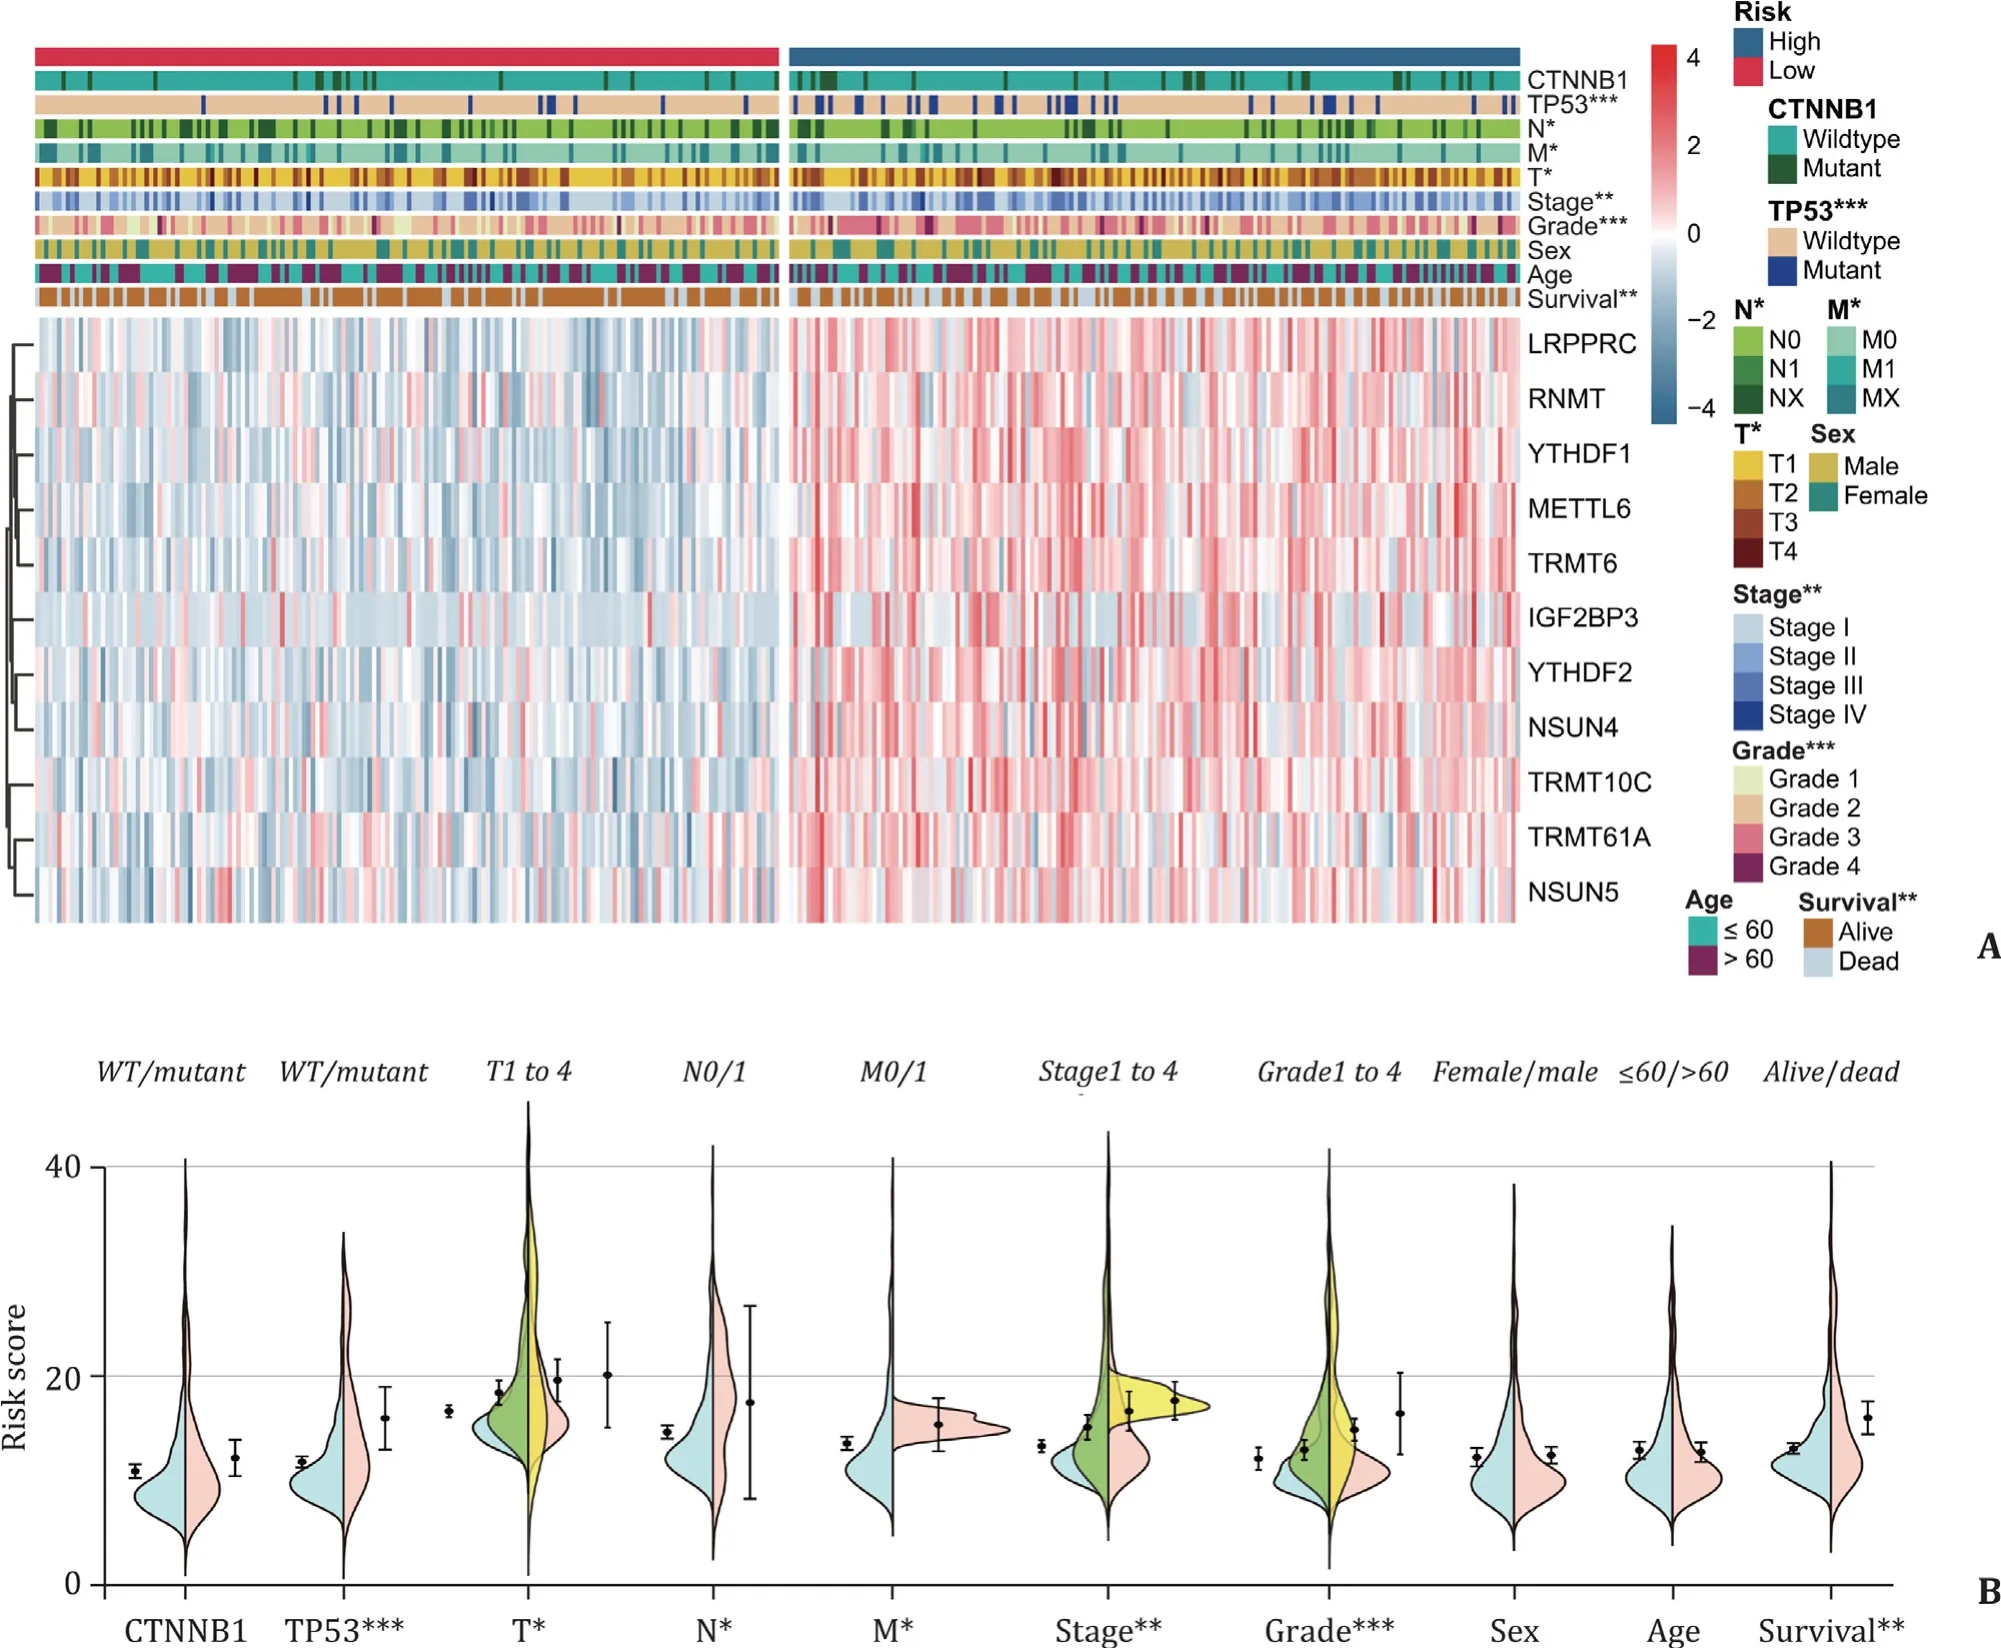
Fig. 6. Correlations between HCC clinicopathological features and the gene risk signature. A: Heat map for clinicopathological features and genes expression patterns in high- and low-risk group; B: the risk score stratified by HCCs clinicopathological features. *: P < 0.05; **: P < 0.01; ***: P < 0.001. WT: wildtype.
Discussion
HCC is one of malignant neoplasms with the highest incidence and mortality worldwide [33]. It is demonstrated that molecular signatures play important roles in early detection and prognosis of variety of cancers [34-36], which logically also play important roles in HCC patients. In this study, we comprehensively investigated the correlations between clinicopathological features and gene expression patterns, and the potential prognostic value within 58 selected cancer-associated RNA methylation regulators in HCC patients, on the basis of data obtained from TCGA and GEO. We observed that gene expressions of the 58 selected RNA methylation regulators were significantly associated with clinicopathological features, such as sample type, histological grade,TP53mutation andCTNNB1mutation. Overall, HCC showed higher gene expression patterns compared to normal liver samples for most of the selected RNA methylation regulators (45 out of 58, 77.6%) in both TCGA and GEO datasets. Moreover histological grade of HCC was indispensable for judging the prognosis and estimating tumor progression [37]. Furthermore, most of the methylation regulator genes are up-regulated in the high histological grade. Our analyses indicated that the RNA methylation regulators play clearly considerable roles in HCC.
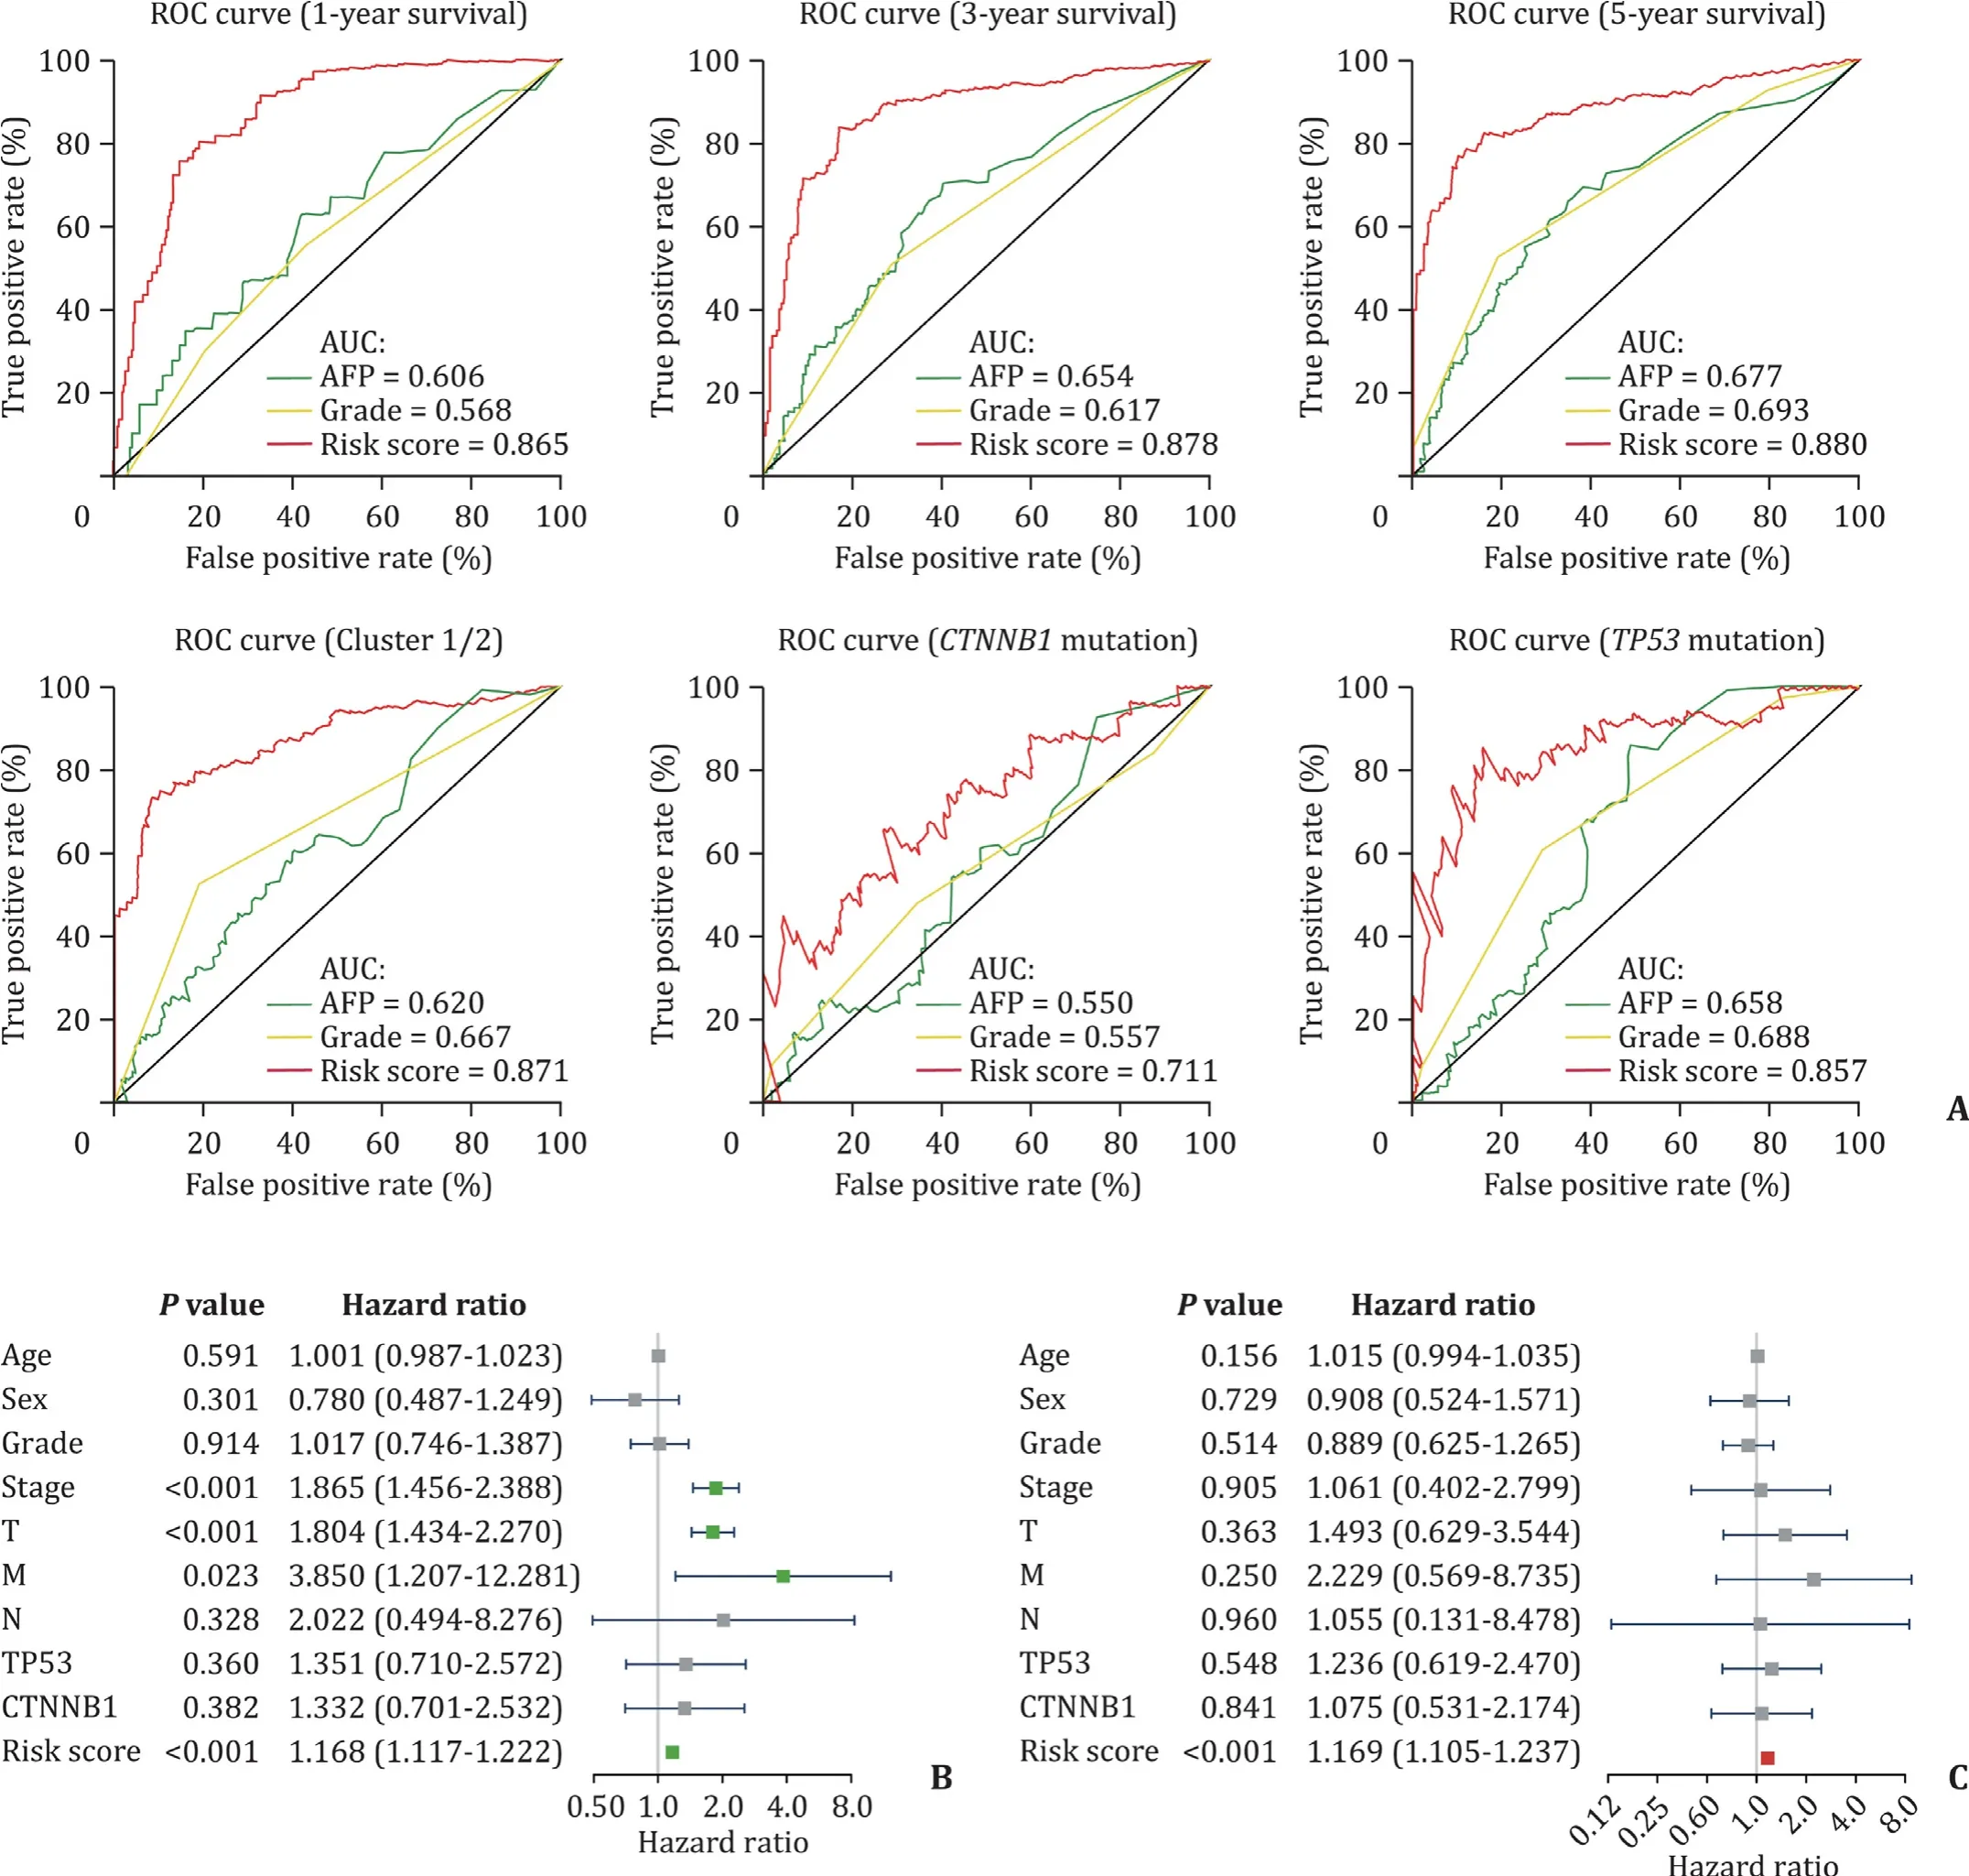
Fig. 7. Predictive efficiency and prognostic value of the gene risk signature. A: Predictive efficiency of risk signature for 1-, 3- and 5-year survival, the clusters and mutation in TP53 as well as CTNNB1 ; B: univariate analysis for risk signature; C: multivariate Cox regression analysis for risk signature.
Recent studies have explored HCC genomic alterations and have identified two most significantly mutated genes (SMGs) by Mut-SigCV algorithm [21 , 22], including the tumor suppressor geneTP53and the WNT pathway oncogeneCTNNB1, and the mutations of these two genes are closely associated with HCC development [38].We found that the up-regulated expression of most RNA methylation regulators was highly correlated withTP53mutation status.The activation of p53 pathway in various causes, such as DNA damage, is an important mechanism to control G1 into S phase for cell cycle and consequently induces transcription of target genes,such asCDKN1A, maintaining genomic homeostasis [39 , 40]. The RB1 is a downstream target controlling the G1/S phase transition and phosphorylated RB1 protein modulated by CDK4/cyclin D1 complex induces the expression of E2F transcript factor which has been suppressed by p53 activation. E2F activation enhances G1 to S phase transition [39].CDKN1Abinding to CDK4/cyclin D1 complex inhibits the corresponding protein kinase activity resulting in the inability of the complex to phosphorylate RB1, and then the non-phosphorylated RB1 remaining bounded to E2F renders is incapable to activate and causing cycle arrest [39 , 41]. Inactivation of the TP53 pathway is much more consistent in HCC and theTP53mutations have been observed in 31% of tumors [21 , 42]. Therefore, RNA methylation regulators that are highly expressed in theTP53mutant group may affect the malignancy of HCC by tuning the cell cycle. Additionally, circadian rhythm maintenance and cell cycle modulation is just one of the earliest established effects of RNA methylation regulators on cell functions [43 , 44]. Besides, it has been generally considered that somatic mutations in TP53 signaling pathway and WNT pathway occur in a mutually exclusive manner [45 , 46]. In this study, we also observed an apparently different expression patterns between the genes inTP53andCTNNB1mutation groups.
We identified two HCC subgroups by consensus clustering based on the gene expression patterns of representative RNA methylation regulators which were significantly up-regulated in undifferentiated groups (Grade 3 and 4), and demonstrated that these cancer-associated methylation regulators, called hug genes,highly expressed in cluster 2 were closely associated with both tumor increasing malignancy and a poor prognosis in patients survival. The TCGA transcriptome profiling data stratified with the clusters showed two clearly distinct distributions, and more importantly, these genes allocated into cluster 1 and cluster 2 have been enriched in the opposite biological functions and signaling pathways. It is consistent with the previous findings.A number of early studies have shown that a high level of expression or abnormal intracellular distribution ofβ-Catenin is negatively correlated with tumor differentiation and HCC patient prognosis [47 , 48]. One of the key mechanisms is that the aberrant WNT pathway activation causes tumorigenesis. The combination of cytosolic unconjugatedβ-Catenin protein and transcriptional factor LEF-1/Tcf family promotes sustained transcription of c-myc and cyclin D1 [47 , 49 , 50]. Abnormal activation of the WNT signaling pathway or activating mutation inCTNNB1both inhibit the phosphorylation ofβ-Catenin, thereby increase the level of cytosolic unconjugatedβ-Catenin, and then lead to HCC malignant proliferation and tumor development [47 , 51 , 52]. We observed that up-regulated RNA methylation regulators in HCC high-grade group were clearly associated with HCC malignant clinicopathological features, biological functions and signaling pathways, and enriched in tumor hallmarks, including PI3K-AKT-mTOR signaling pathway,MYC and E2F downstream targeting gene sets. It is revealed that up-regulation of these hug genes may promote HCC progression.
Applying RNA methylation regulators to anticancer drug field is promising but remains in its infancy, and whether the expression patterns of RNA methylation regulators could be used as a prognostic marker is logically an important issue [25]. In this study, an 11-gene risk signature, derived from selected RNA methylation regulators, acted as an independent indicator to predict HCC features as well as patients survival. It is worth noting that, in this risk signature,TRMT10C, which has not yet been well reported in cancerassociated topics, is a newly discovered m1A9 (1-methyladenosine in nucleotide position 9) “writer” on mitochondrial tRNAs in eukaryotes, also called mitochondrial ribonuclease P protein subunit 1 (MRPP1) [53]. Currently it is mainly indicated thatTRMT10Chas involved in the maturation of mitochondrial tRNAs, and mutations inTRMT10Ccaused certain defects in RNA function as well as inactivate oxidation respiratory chain [54 , 55]. Although the functional mechanism of the 11 genes for HCC still needs further elucidation,their expressions have significant correlation with the prognosis of patients and may be serving as a potential target for anticancer drugs discovery.
In conclusion, our study systematically demonstrated the expressions, biological functions and prognostic value of 58 selected cancer-associated RNA methylation regulators and suggested that RNA methylation regulators were highly correlated with HCC malignancy and patients prognosis. Moreover, given the prognostic value of the signature and emerging new biological features of the RNAs modifying, this study provides important evidence for RNA methylation regulators as actionable targets for anticancer drug discovery.
Acknowledgments
We are very grateful to the contributions from the TCGA and GEO networks, the R project for statistical computing (including the Rtools) as well as all the selfless authors of all statistics packages in R.
CRediT authorship contribution statement
Yue Yan:Conceptualization, Formal analysis, Methodology, Software, Visualization, Writing - original draft.Yun-Hai Luo:Data curation, Resources, Validation, Writing - review & editing.Dao-Feng Zheng:Data curation, Validation, Writing - review & editing.Tong Mu:Data curation, Validation, Writing - review & editing.Zhong-Jun Wu:Conceptualization, Data curation, Resources, Supervision, Validation, Writing - review & editing.
Funding
None.
Ethical approval
The study was approved by the Committee for Medical Research Ethics of the First Affiliated Hospital of Chongqing Medical University.
Competing interest
No benefits in any form have been received or will be received from a commercial party related directly or indirectly to the subject of this article.
Supplementary materials
Supplementary material associated with this article can be found, in the online version, at doi: 10.1016/j.hbpd.2020.05.002 .
杂志排行
Hepatobiliary & Pancreatic Diseases International的其它文章
- Liver transplantation and BCLC classification: Limitations impede optimum treatment
- Do the existing staging systems for primary liver cancer apply to combined hepatocellular carcinoma-intrahepatic cholangiocarcinoma?
- Overlap of concurrent extrahepatic autoimmune diseases is associated with milder disease severity of newly diagnosed autoimmune hepatitis
- Aggressive surgical approach in patients with adrenal-only metastases from hepatocellular carcinoma enables higher survival rates than standard systemic therapy
- The utility of two-dimensional shear wave elastography and texture analysis for monitoring liver fibrosis in rat model
- Impact of referral pattern and timing of repair on surgical outcome after reconstruction of post-cholecystectomy bile duct injury: A multicenter study