Mechanism of coconut husk activated carbon modified by Mn(NO3)2
2021-01-12HuangBangfuShiZheCaiMingYuAnhe
Huang Bangfu Shi Zhe Cai Ming Yu Anhe
(Faculty of Metallurgical and Energy Engineering, Kunming University of Science and Technology, Kunming 650093, China)(Clean Metallurgy Key Laboratory of Complex Iron Resources of the University in Yunnan Province,Kunming University of Science and Technology, Kunming 650093, China)
Abstract:To study the mechanism by which activated carbon is modified by HNO3 and Mn(NO3)2, the pore texture and surface chemical characteristics of carbon materials in coconut husk activated carbon (AC) were examined via scanning electron microscopy (SEM), Brunauer-Emmett-Teller (BET), X-ray diffraction (XRD), Fourier-transform infrared spectroscopy (FTIR), and X-ray photoelectron spectroscopy (XPS). After being modified by HNO3, the millipore character of AC became deformed, and the character of the adjacent pores remained consolidated. The surface manganites of Mn/AC-1 presented as block and reticular fiber structures, Mn/AC-2’s surface manganites presented as petty mammock crystals, and Mn/AC-3’s surface manganites were observed as gauze nanosheets that interlace to fill in the pore canal. Nitric acid modification was shown to enlarge surface pores but decrease the specific surface area of AC. Mn loading can be used to construct a new pore structure that, in turn, increased the total specific surface area as well as the specific surface area and the volume of the millipores. Mn/AC-2’s pore structure was optimized at a calcination temperature of 500 ℃ and a loading quantity of 5%. The ash content of AC was considerably reduced after modified by HNO3. The active materials for Mn/AC-1 mainly consisted of Mn3O4, with a few Mn2O3 crystals, whereas Mn/AC-2’s materials were mainly Mn3O4 and some MnO crystals. Mn/AC-3 was exclusively composed of Mn3O4. HNO3 activation and Mn loading modification did not considerably affect the functional group species present on the catalyst. Modification conditions using the same loading quantities and higher calcination temperatures decreased the number of O—H and N—H bonds while conversely increasing the number of CC and C—O bonds. On the contrary, the use of a higher loading quantity while maintaining the same calcination temperature increased the number of O—H and N—H bonds. A higher loading quantity is beneficial for increasing Mn4+ species. A higher calcination temperature is beneficial for increasing Mn3+ species. The results can optimize the conditions under which Mn/AC catalyst modification occurs, thus improving the physical and chemical properties of carbon-based sorbents.
Key words:HNO3; Mn(NO3)2; coconut husk activated carbon; physicochemical property; modification mechanism
Activated carbon (AC) is a good catalytic carrier and is sorbent due to its large specific surface area and the presence of numerous surface functional groups as well as its chemical stability and favorable adsorptive properties. AC is often used in sewage treatment and gas cleaning applications because it is an abundant material that is commonly available from stable sources[1-3]. The acidity, adsorption capacity, and catalytic performance of coconut husk AC are all determined by its pore structure and the quantity of associated surface functional groups. Thus, the physicochemical properties of AC form the foundation for the adsorption of polar and nonpolar materials. Unmodified coconut husk AC has been shown to exhibit limited adsorptive properties compared with modified coconut husk AC.
Previous studies[4-8]have shown that AC modified by MnOx, CuO, Fe2O3, and CeO2exhibited low-temperature catalytic activity. In particular, the active metal oxide, MnOx, has an amorphous valence state and high acidic strength and is renowned for the ease with which voltinism occurs. Catalysts modified by the Mn species have a high oxygen content and are less prone to losing specific surface area and pore diameter[6-9]. The conditions under which modification occurs eventually determine the valence state and surface topography of a manganite on the catalyst under investigation. Existing research has mainly focused on the desulfurization and denitrification performance of carbon-based loaded Mn catalyst[10-12]. However, very few studies have carefully evaluated the mechanism by which Mn/AC is prepared using Mn(NO3)2.
To understand how Mn(NO3)2affects AC, coconut husk AC modified using HNO3and Mn(NO3)2was investigated. The effects of HNO3and Mn(NO3)2on the pore texture and surface chemical characteristics of carbon materials were examined using scanning electron microscopy (SEM), Brunauer-Emmett-Teller (BET), X-ray diffraction (XRD), Fourier-transform infrared spectroscopy (FTIR), and X-ray photoelectron spectroscopy (XPS). The surface topography, pore structure, type of active material, and functional groups associated with AC, HNO3/AC, and Mn/AC were systematically studied to optimize the conditions under which the modification of the Mn/AC catalyst occurs and to improve the physical and chemical properties of carbon-based sorbents.
1 Experimental
1.1 Catalyst preparation
Coconut husk AC (Chongqing Huaxi Cativated Create Factory) was used as the pure carbon material. The AC was washed with distilled water and soaked in a water bath for 2 h before being dried in an oven at 100 ℃. The AC sample was immersed in 4 mol/L of nitric acid at 80 ℃ for 2 h. The HNO3/AC product was obtained by drying the sample in an oven at 100 ℃.
10 g of the HNO3/AC sample were then immersed in Mn(NO3)2liquor (100 mL) and ultrasonically stirred for 24 h. Afterward, the sample was dried at 102 ℃ for 4 h. Using a programmed rate of 15 ℃/min, the dried sample was calcined in a vacuum tube furnace for 3 h. The resulting Mn/AC catalyst subjected to the modification conditions is given in Tab.1.

Tab.1 Catalyst of Mn/AC preparation condition
1.2 Material characterization
To study the changes in the samples’ surface microtopography before and after modification, the microstructure of the carbon materials was investigated via SEM using a XL30 ESEM-TMP microscope. The BET surface areas of AC, HNO3/AC, and Mn/AC were measured via an N2adsorption isotherm at 77 K using an UADRASORB-EVO analyzer. Total pore and micropore volumes were obtained using the Barret-Joyner-Halenda (BJH) method. Characteristics such as pore size distribution,pore volume, and the type of pore canal were obtained by analyzing the adsorption tendency of the catalyst. To confirm the phase composition of AC, HNO3/AC, and Mn/AC, a PHI5000 VERSAPROBE-Ⅱ analyzer was used to conduct XRD experiments. FTIR spectra were recorded using a Fourier-transform infrared spectrometer (NICOLET IS10) to study changes in the surface functional groups of AC, HNO3/AC, and Mn/AC. To obtain the information about the oxidation state of manganese on the catalyst surface and ensure the chemical compositions of the surface layer, XPS spectra of Mn/AC were recorded using a multifunctional scanning imaging photoelectron spectrometer (PHI5000 VERSAPROBE-Ⅱ).
2 Results and Discussion
2.1 SEM results
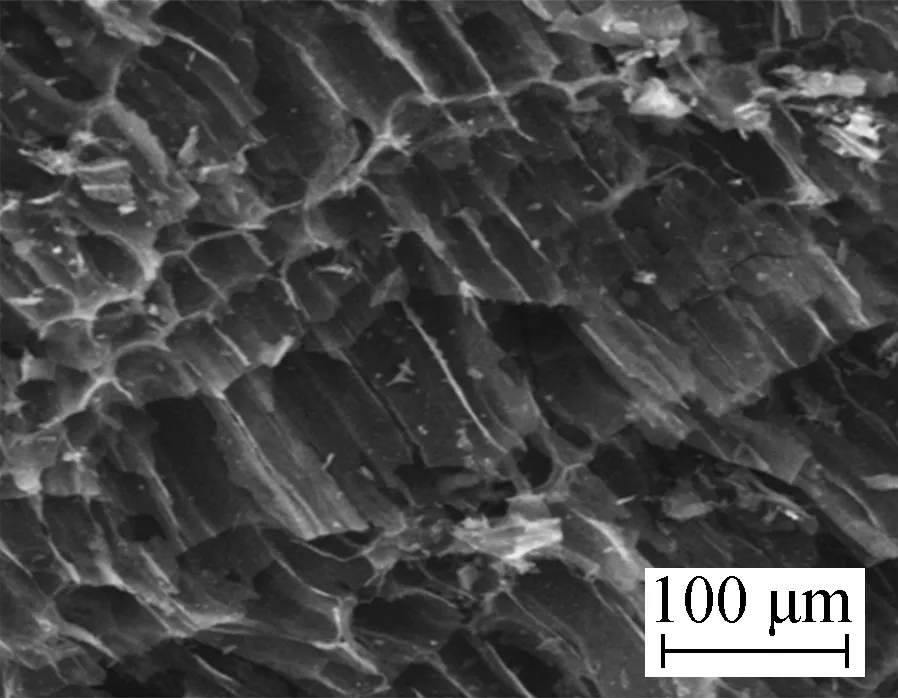
Surface microtopography (500× magnification) of the samples before and after modification by HNO3is shown in Fig.1(a) and Fig.1(b). As shown in Fig.1(a), coconut husk AC developed a clear pore structure, a distinct boundary, a smooth wall of holes, and a faviform surface structure, whereas Fig.1(b) shows that the surface microtopography of HNO3/AC becomes unsymmetrical and disordered since the same area has more ditches and air void structures. Similarly, a number of gully-like pores formed on the surface.
(a) (b)
Fig.1Scanning electron micrograph. (a) AC 500×; (b) HNO3/AC 500×
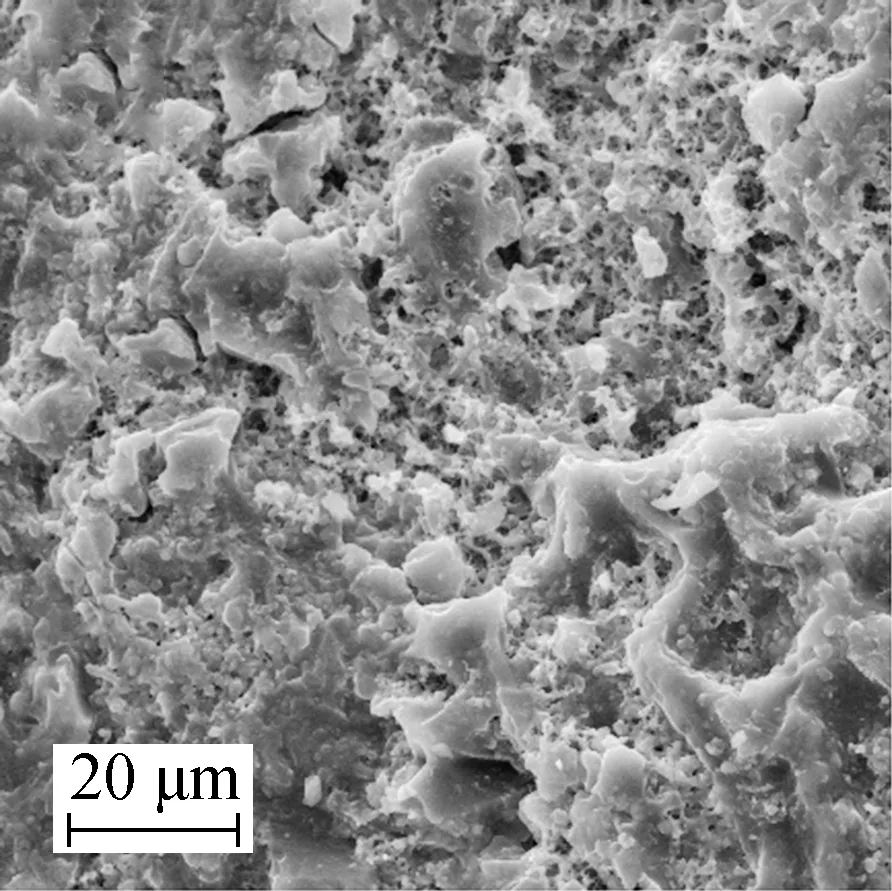
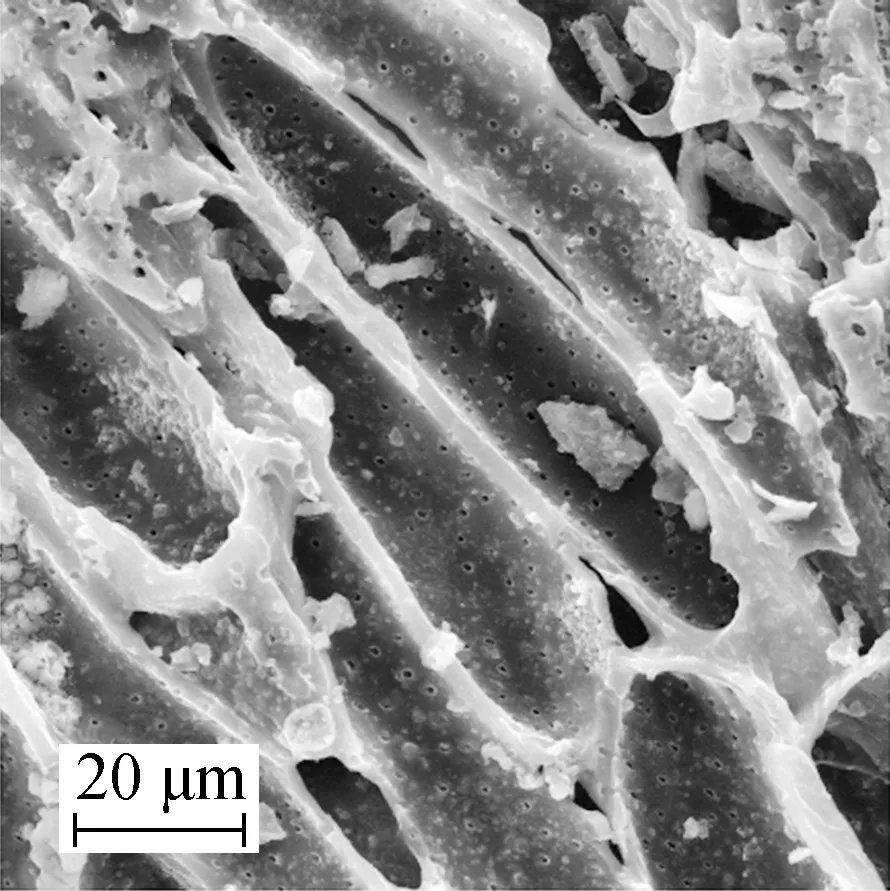
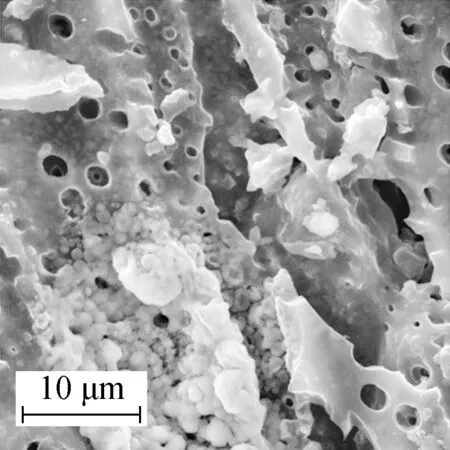
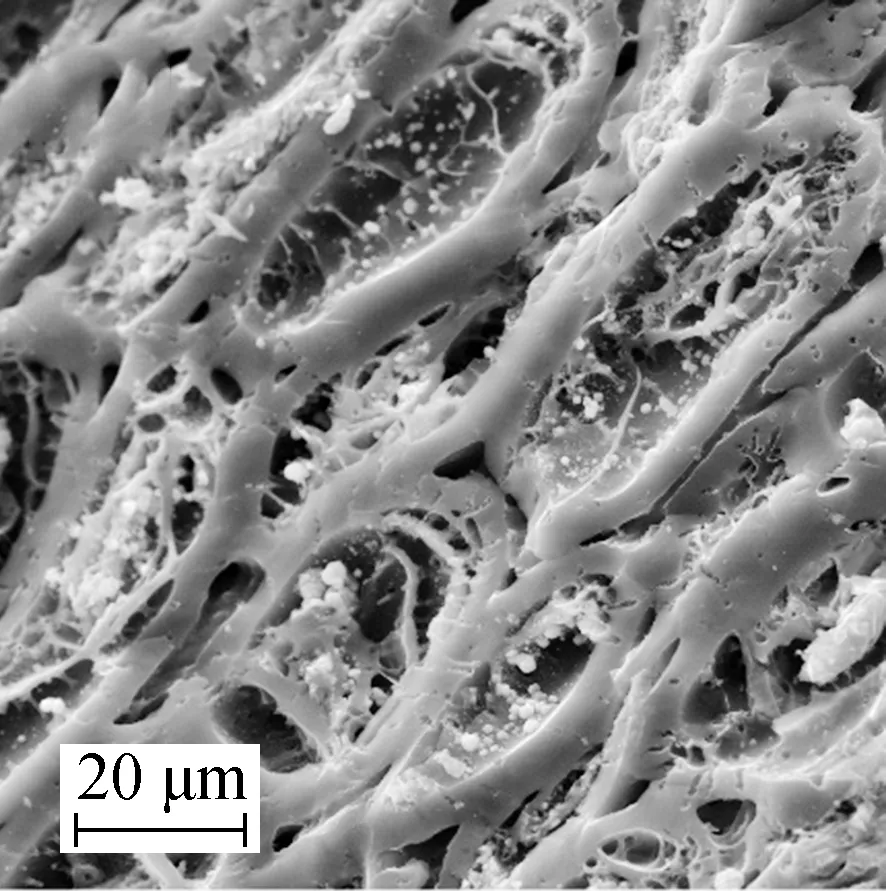
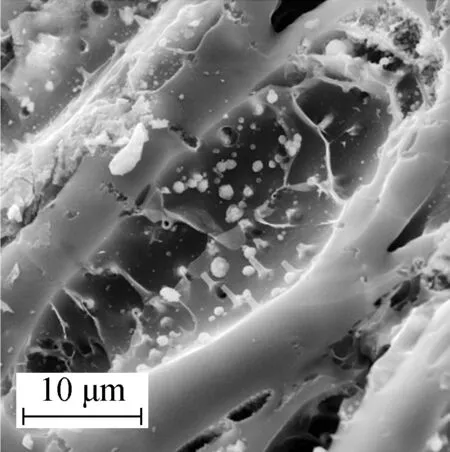
The surface microtopography of Mn/AC-1 is shown in Fig.2(a) and Fig.2(b), whereas the surface microtopography of Mn/AC-2 is shown in Fig.2(c) and Fig.2(d). Details about the surface microtopography of Mn/AC-3 are given in Fig.2(e) and Fig.2(f). All images were taken at 2 000× and 5 000× magnification.
(a)

(b)
(c)
(d)
(e)
(f)
As shown in Figs.2(a) and (b), manganites on the surface of Mn/AC-1 were present as block and network fiber structures. Block manganites were observed as laminiplantation that adhered to the surface of AC and almost completely covered the pore structures. However, the reticular fibers were observed as cross connections that maintained the adjacent pore space that had formed a multi-hole surface skeleton structure. New pore space structures supported more activated adsorption sites[13]. There were also network structures in the space between the blocks and on the surface of AC, which meant that the blocks had disappeared prior to their reformation as network fiber structures.
Figs.2(c) and (d) show the disappearance of block and network fiber structures with increasing calcination temperatures. Petty mammock crystals were scattered across the surface of Mn/AC-2 with irregular shapes and an inset in the slit. Grainy manganites accumulated in the pore space structures and unveiled partly covered pore spaces. No large-scale blocking phenomenon was observed, and the pore space structures were clearly visible.
Compared with the phenomenon observed in Mn/AC-1, there was significantly improved distribution of the Mn/AC-3 manganites when the loading quantity was increased (see Figs.2(e) and (f)). Large grains accumulated, and large voile-like nanosheets interlaced to fill the available pore space. Several uniform, compact nanosheets interlaced to form ordered network structures[14]. Grainy manganites adhered to the walls of the pore space that, in turn, exhibited prismatic perfection and net post structures.
2.2 BET results
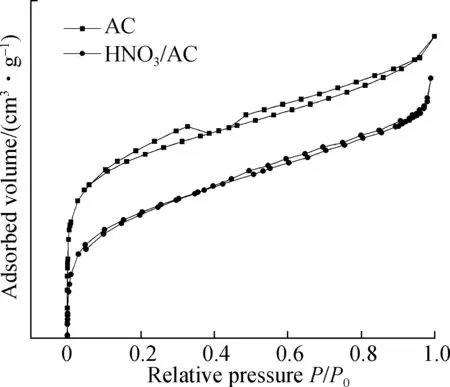
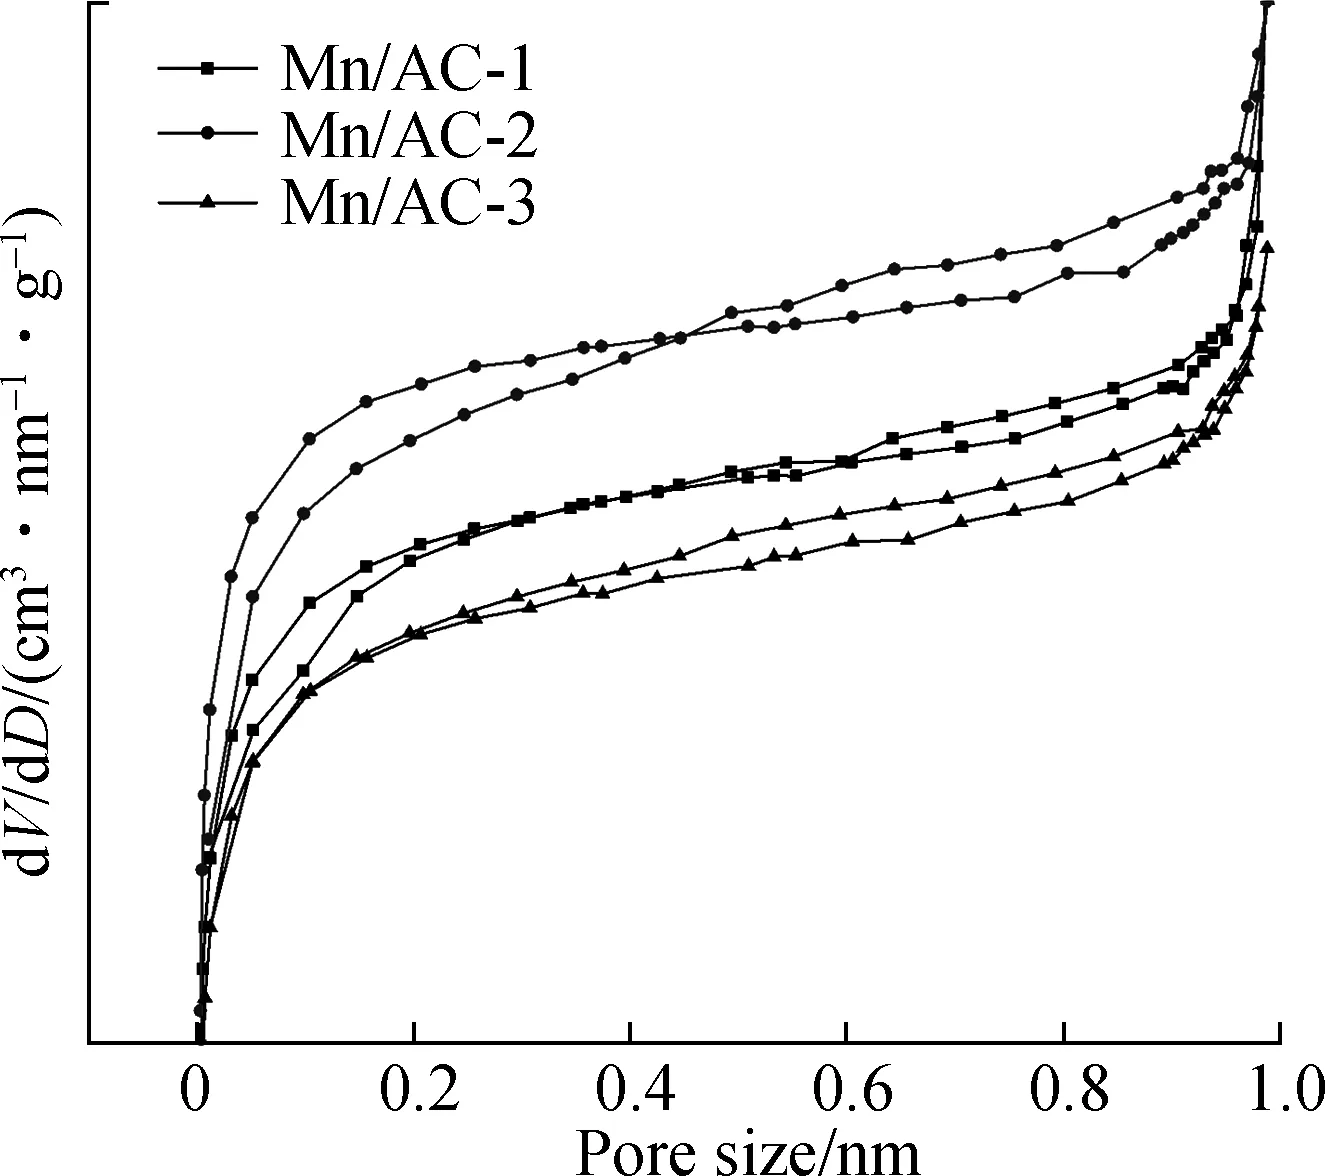
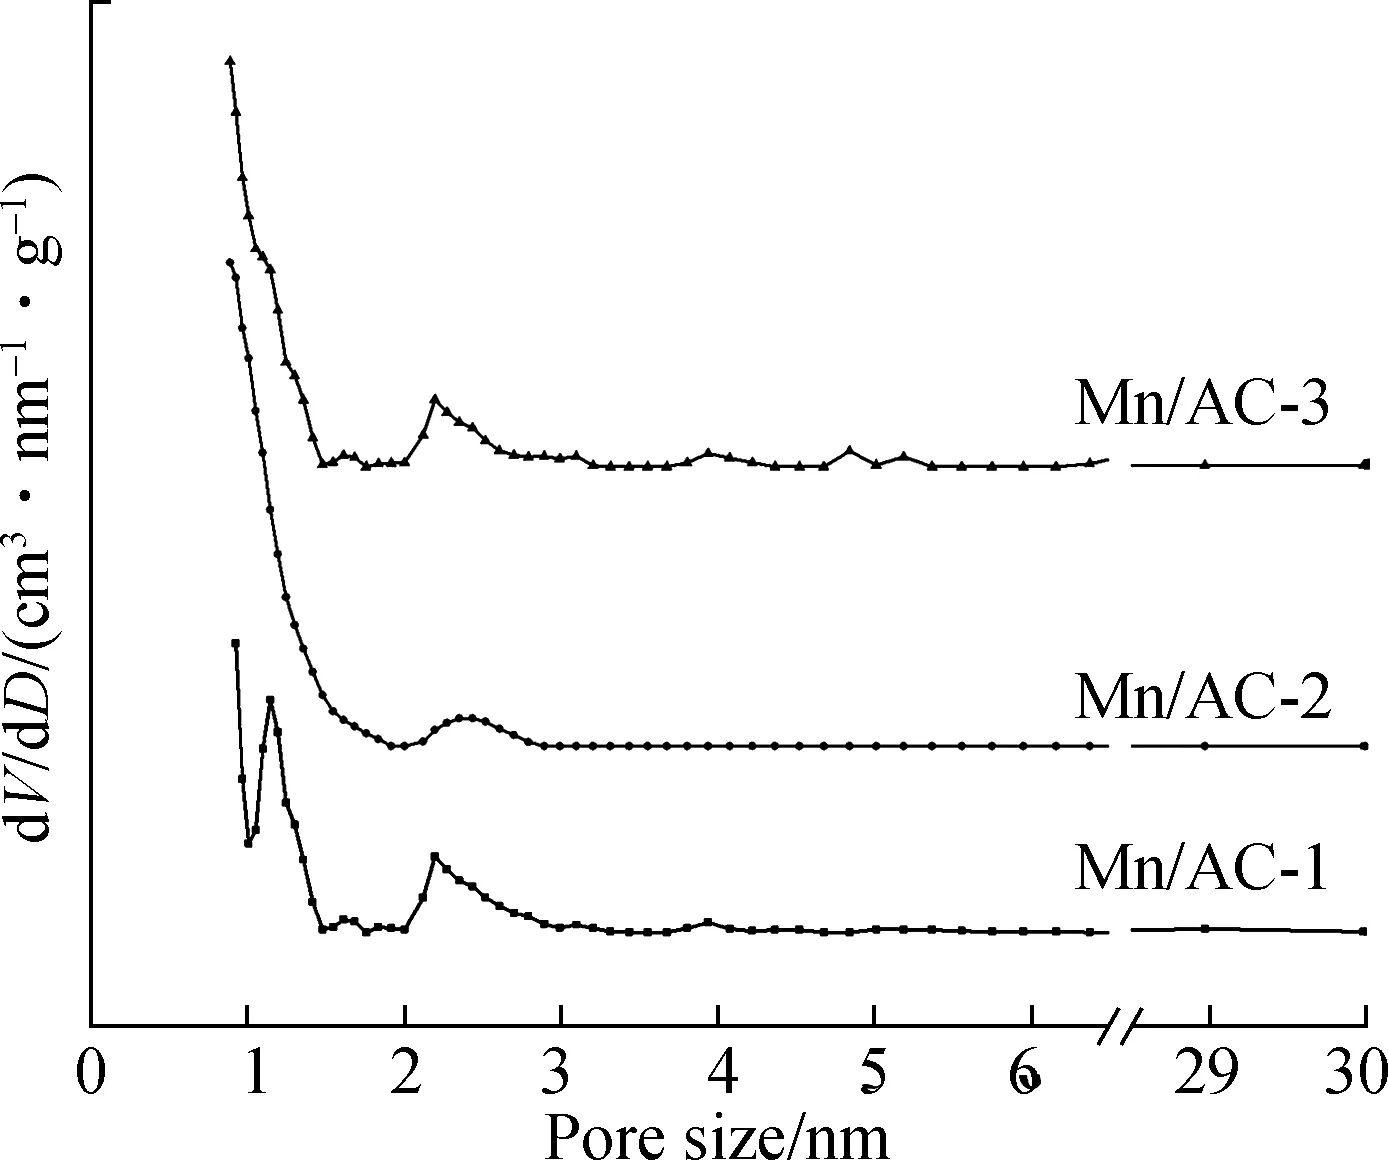
The BET characterization results for the AC, HNO3/AC, and Mn/AC catalysts are shown in Fig.3, Fig.4 and Tab.2. As shown in Fig.3(a), the volume of N2adsorbed by AC and HNO3/AC rapidly increased during the initial stages at a low relative pressure due to the presence of numerous micropores. The numerous micropores that were present during the initial stages of N2adsorption on AC and HNO3/AC can be defined as Type Ⅰ micropores according to the IUPAC classification scheme[15]. The diameters of the micropores were almost 2 nm, and the micropore structure that had developed occupied an immense specific surface area (see Tab.2 and Fig.3(b)). Calculations revealed that the micropore volume accounted for 69.97% of the total pore volume, and the micropore specific surface area accounted for 83.37% of the total specific surface area. This was the reason for the relative absence of mesopores and macropores. The average pore diameter and total pore volume increased slightly after nitric acid modification, and this was due to the opening of many previously closed pores, an action that was triggered by the reaction between nitric acid and carbon. This, in turn, caused some of the micropores to disappear and the carbon skeleton to collapse. Consequently, the micropore structure was destroyed; the micropore specific surface area decreased to 190.595 m2/g; and the total specific surface area decreased to 132.604 m2/g. Thus, although nitric acid modification enlarged the pores, it also resulted in a decrease in the specific surface area of AC.
The nitrogen isotherm adsorption-desorption curves and pore size distributions for Mn/AC are shown in Fig.4. The numerous micropores that were present during the initial stages of N2adsorption on Mn/AC-1, Mn/AC-2, and Mn/AC-3 can also be defined as Type Ⅰ micropores according to the IUPAC classification scheme[15]. As shown in Fig.4(b) and Tab.2, the micropore contents are in the following order: Mn/AC-2>Mn/AC-1>Mn/AC-3. The volume of N2adsorbed on Mn/AC-1, Mn/AC-2, and Mn/AC-3 also rapidly increased under a high pressure. The reason for this may be that capillary condensation occurred under medium and high pressures in the relatively narrow free space. Thus, micropores and mesopores appeared as Type Ⅳ. A circular hysteresis ring was formed due to the condensation and evaporation processes within the capillaries that did not occur at the same pressure. The adsorption capacity of Mn/AC-2 was at its maximum, indicating the presence of narrower pore spaces and mesopores.
(a)
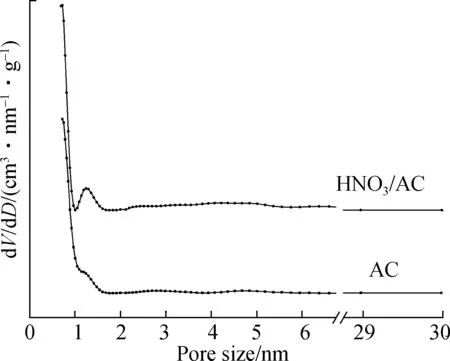
(b)Fig.3 AC and HNO3/ACBET characterization. (a) Nitrogen isotherm adsorption-desorption curve; (b) Pore size distribution
(a)
(b)

Tab.2 Specific surface area and pore structure parameters of samples
Compared with HNO3/AC, the millipore volume, millipore specific surface area, and total specific surface area of Mn/AC-2 increased to 43.62%, 49.13%, and 26.37%, respectively. This tendency is also reflected in Mn/AC-1 and Mn/AC-3. The reason for this may be the block and network fiber of surface manganites, which formed new structures and increased the specific surface area. Compared with AC, Mn/AC-2 was shown to have optimized pore structure parameters. Thus, its total pore volume and diameter were lower than those of Mn/AC-1. The reason for this may have been the presence of grain manganites in the narrow slit and pore spaces that promoted the formation of more millipore structures. This, in turn, increased the specific surface area and decreased the pore diameter of Mn/AC-2. The pore structure parameters for Mn/AC-3 were the same as those for Mn/AC-1 and were shown to be inferior to the parameters for Mn/AC-2. The reason for this may be excess loading, which blocked the pore spaces and decreased the pore structure parameters.
2.3 XRD results
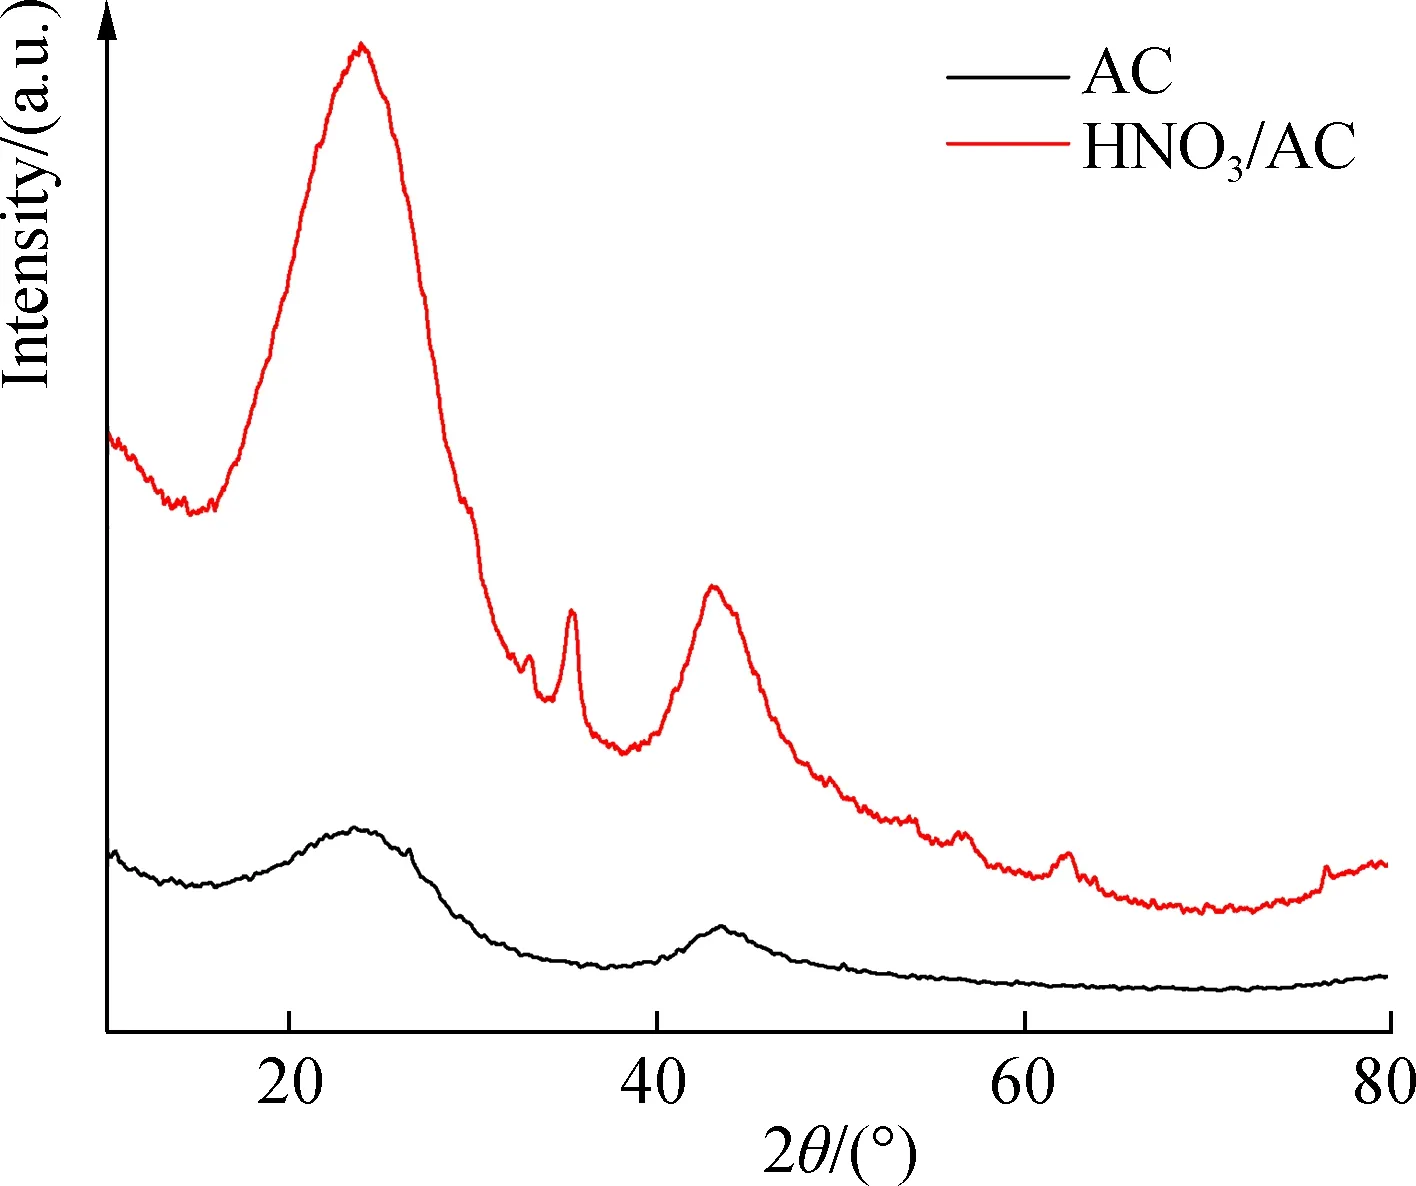
To analyze the change in the graphite crystal and Mn phase composition, XRD spectra for the AC, HNO3/AC, and Mn/AC catalysts are obtained (see Fig.5).
As shown in Fig.5(a), a graphite peak was found in the XRD spectra for AC and HNO3/AC in addition to two characteristic peaks of broad dispersion at 23.813° and 43.467° that corresponded to the 100 crystal face. Thus, it is clear that AC was composed of amorphous carbon. The diffraction peak observed at 23.813° was due to decompaction and tiering processes in the graphene layer at 2θ, whereas the diffraction peak at 43.467° was associated with the graphite crystal at 2θ. A diffraction peak that was linked to the 002 graphite crystal face at 2θwas observed at 26.468°[16]. From these results, it is clear that the diffraction peaks of the graphene layer and the graphite crystal became keen-edged due to a substantial reduction in the ash content of AC during the nitric acid modification process.
(a)

(b)Fig.5 XRD spectra for activated carbon before and after modification. (a) AC and HNO3/AC; (b) Mn/AC
According to JCPDS card No.24-0734, diffraction peaks for Mn/AC-1 were observed at 18.013°, 28.833°,36.085°, 37.952°, 44.466°, 49.832°, and 50.731°, which corresponded to the 101, 112, 211, 004, 220, 204, and 105 crystal faces of Mn3O4, respectively (see Fig.5(b))[17]. The diffraction peak for Mn2O3was noted at 32.966° and corresponded to the 222 crystal face of Mn2O3. The above studies show that when the loading quantity was 5% and the calcination temperature was 400 ℃, the manganites observed were mainly composed of Mn3O4, with few Mn2O3crystals.
However, when a higher calcination temperature was used with the same loading quantity, the diffraction peaks for Mn/AC-2 were shown at 17.998°, 28.919°, 30.972°, 36.031°, 36.368°, 44.437°, and 50.683°, all of which corresponded to the 101, 112, 200, 211, 202, 220, and 105 crystal faces of Mn3O4, respectively. According to JCPDS card No.75-0626, the diffraction peaks at 34.899°, 40.578°, and 58.774° were assigned to the 111, 200, and 220 crystal faces of MnO, respectively[18]. The above studies show that when the calcination temperature was 500 ℃ and the loading quantity remained at 5%, the manganites observed in the reaction were mainly composed of Mn3O4and only a few MnO crystals. This may be due to the deoxidization of the manganites via AC, which in turn resulted in the transition of Mn to a lower valence.
When the conditions were adjusted so that the calcination temperature remained the same while a higher loading quantity was used, i.e., the formation of Mn/AC-3, the diffraction peaks were observed at 18.034°, 28.934°, 30.998°, 32.357°, 36.073°, 44.457°, 50.701°, 59.828°, and 64.609° corresponding to the 101, 112, 200, 103, 211, 220, 105, 224, and 400 crystal faces of Mn3O4[19], respectively, without the presence of an interference peak. The above studies show that the manganites formed under these conditions were almost entirely composed of Mn3O4, resulting in keen-edged diffraction peaks and a higher degree of purity for the manganite crystals.
2.4 FTIR results
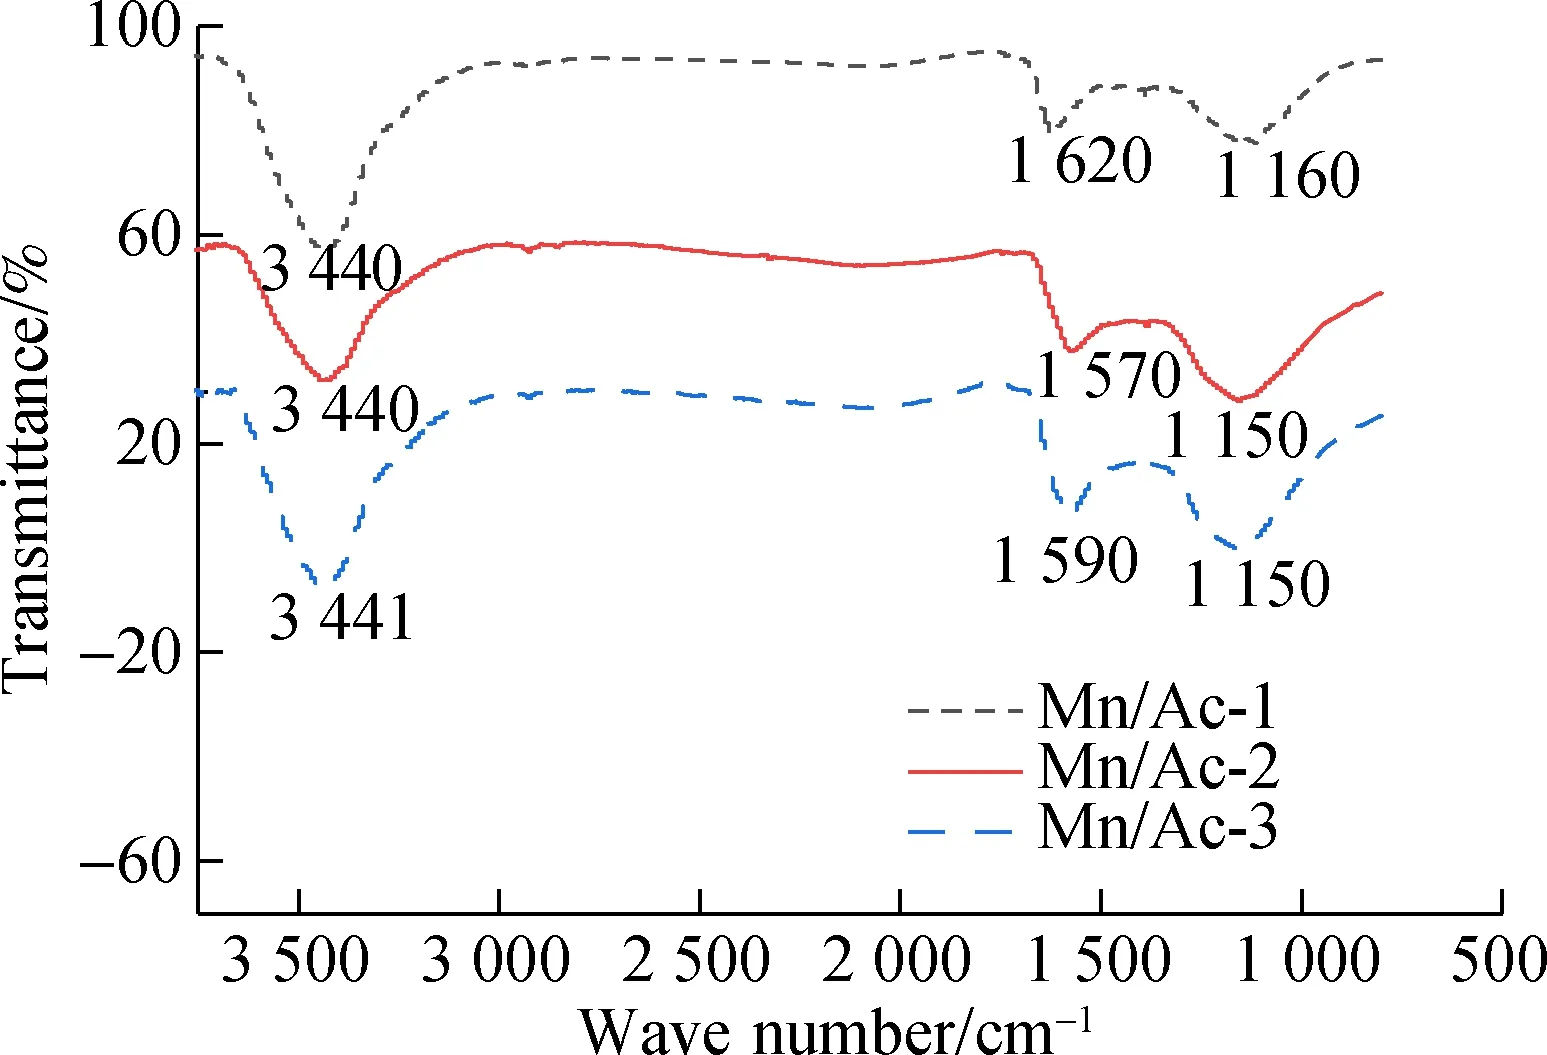
The adsorptive property of AC is influenced by its physical composition and chemical constitution. The quantity, type, and location of these functional groups are crucial to the chemical constitution of the catalyst. Generally, more functional groups tended to exist mainly on the micropore’s surface, and few were found on the outside surface of activated carbon[20]. FTIR spectra for the AC, HNO3/AC, and Mn/AC catalysts are shown in Fig.6.


(a)
(b)Fig.6 FTIR spectra. (a) AC and HNO3/AC; (b) Mn/AC-1, Mn/AC-2, and Mn/AC-3


In summary, different Mn-loading conditions and HNO3activation methods did not affect the functional group species associated with the relevant catalyst. The functional group linked to HNO3/AC decreased in varying degrees after Mn(NO3)2loading modification processes were applied. The thorough distribution of the manganites meant that there was less blockage of the pore structures and less influence exerted on the associated functional groups.
2.5 XPS results
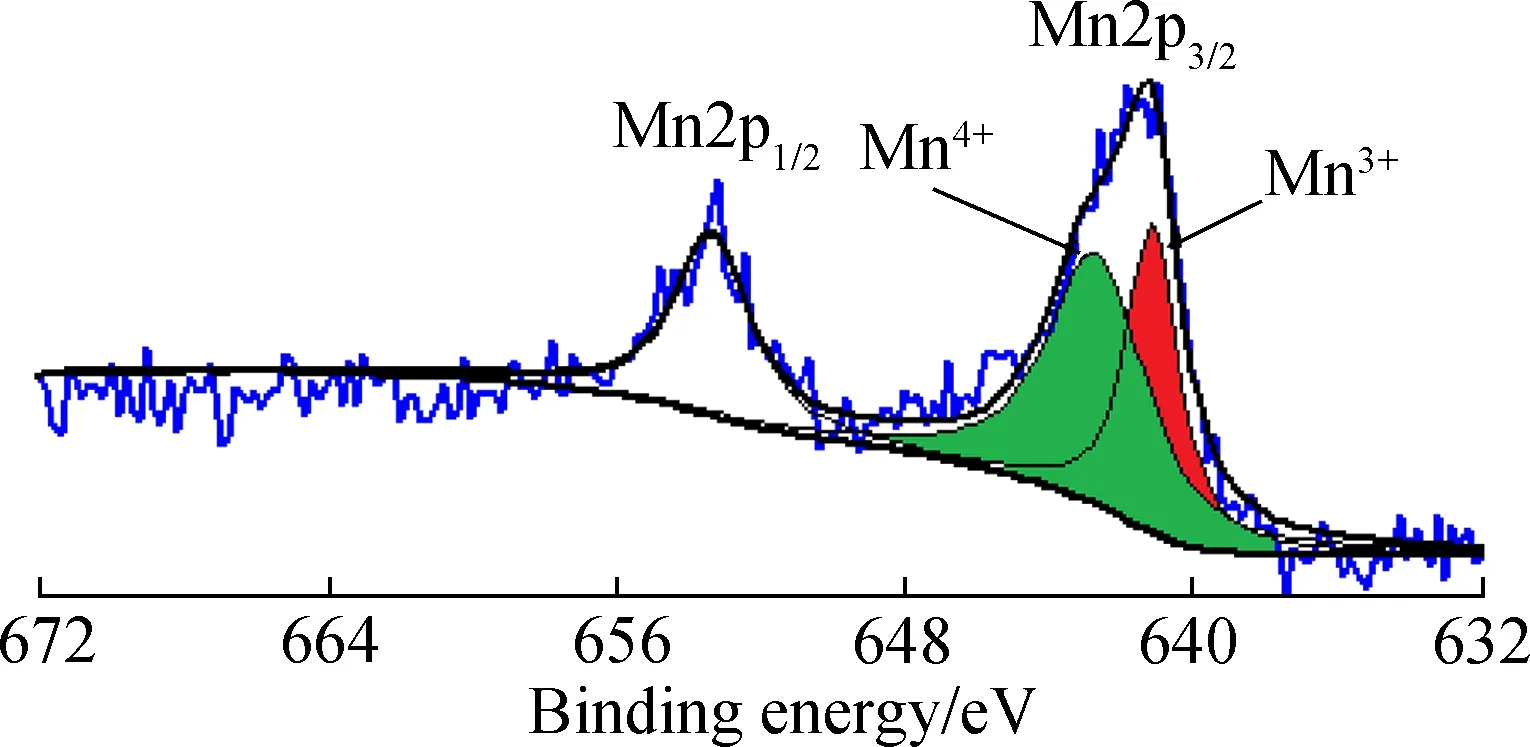
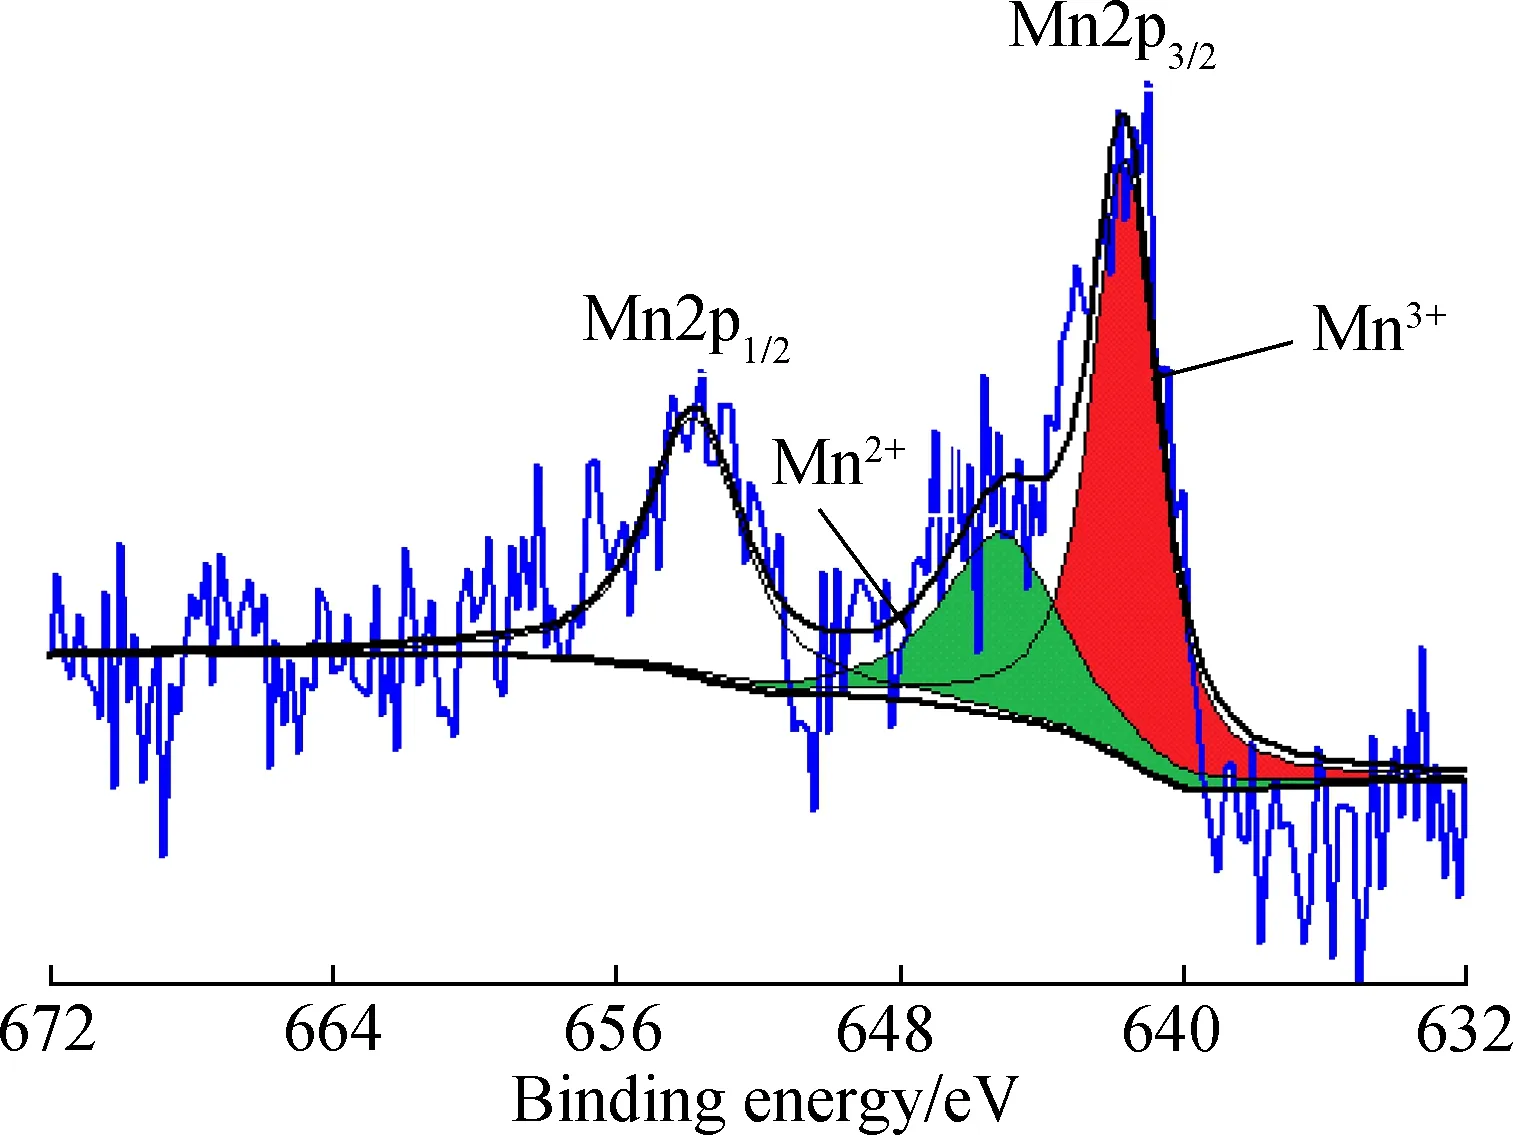
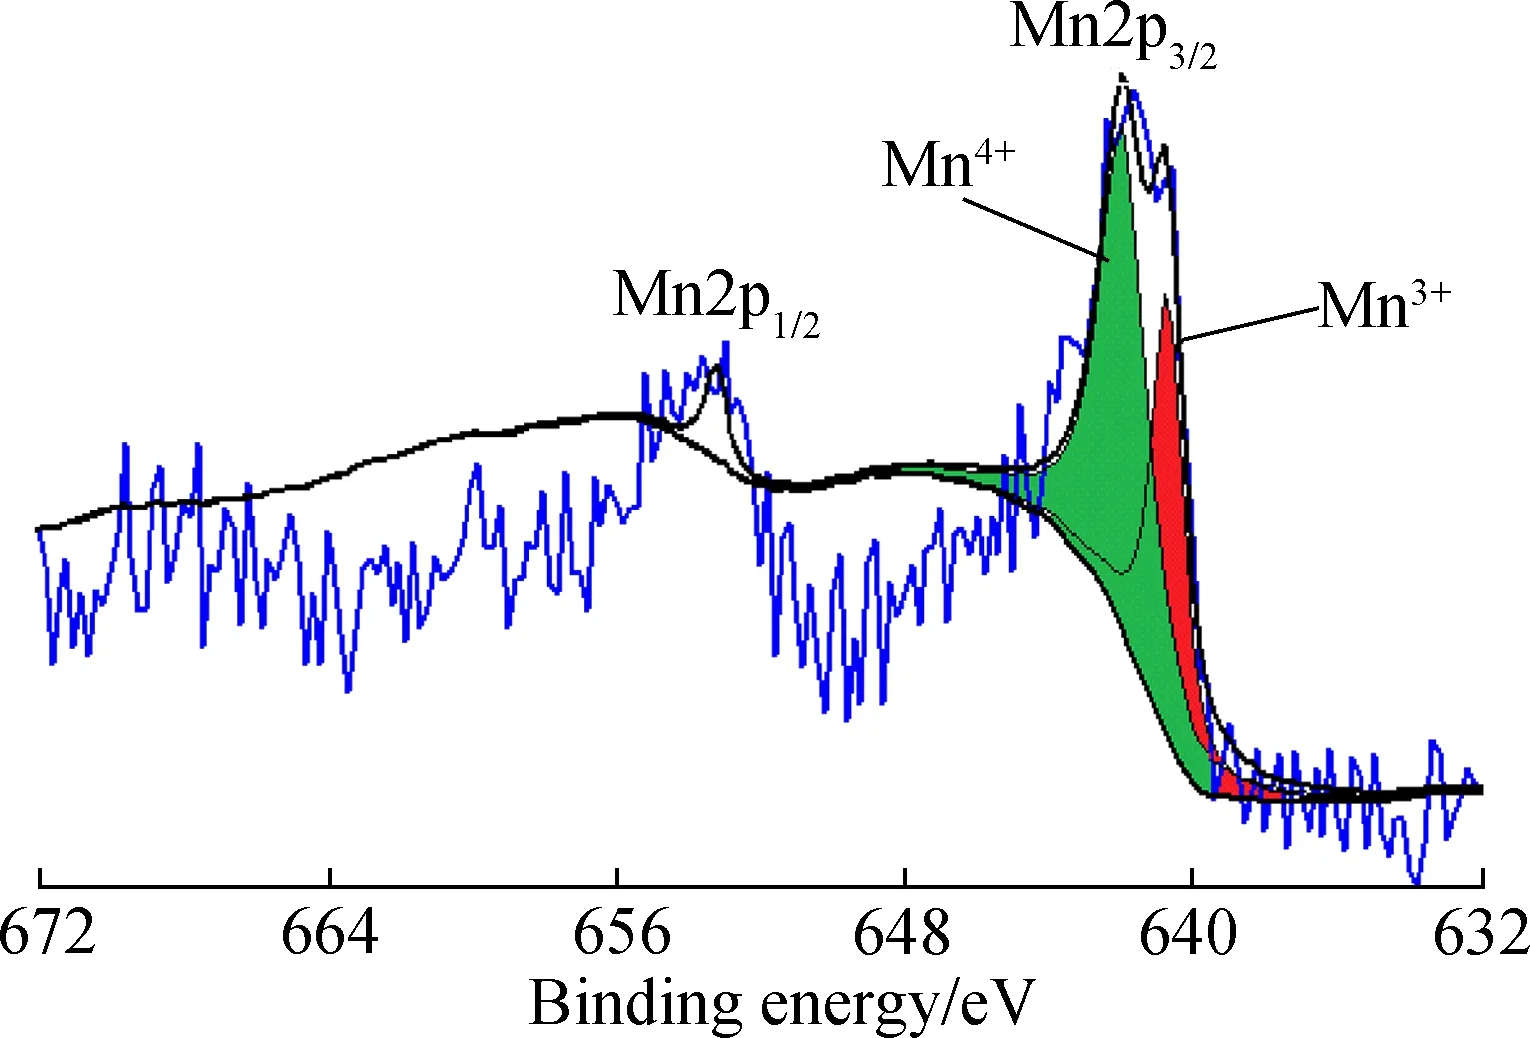
Previous studies[28]showed that the manganese species (Mn4+, Mn3+, Mn2+, etc.) can be characterized by Mn2p3/2and Mn2p1/2peaks located between 639 and 658 eV. To confirm the relationship between the modified conditions and manganese species, the XPS spectra of Mn/AC were recorded. The characterization results are shown in Fig.7.
As shown in Fig.7(a), the Mn/AC-1 surface has 60.46% of Mn4+species and 39.54% of Mn3+species.
(a)
(b)
(c)Fig.7 XPS spectra of manganese species. (a) Mn/AC-1; (b) Mn/AC-2; (c) Mn/AC-3
In Fig.7(b), with the same loading as Mn/AC-1, Mn/AC-2 prepared at a calcination temperature of 500 ℃ has 64.89% Mn3+species and 35.11% Mn nitrate (Mn2+); the Mn4+species almost disappears. As shown in Fig.7(c), at the same calcination temperature (400 ℃) as for Mn/AC-1, Mn/AC-3 prepared with 10% loading has 63.39% Mn4+species, with the Mn3+species reducing to 36.61%. In conclusion, a higher loading quantity is beneficial for increasing Mn4+species, whereas a higher calcination temperature can increase Mn3+species.
3 Conclusions
1) Coconut husk AC has a faviform surface structure in which the surface microtopography of HNO3/AC becomes unsystematic and disordered. Manganites on Mn/AC-1 are present as block and network fiber structures in which the network fiber structures are preferentially formed at the expense of the blocks present in the system. Petty mammock crystals are scattered across the surface of Mn/AC-2, which experiences no large-scale blocking phenomenon and contains highly visible pore space structures. The manganites of Mn/AC-3 are well distributed, and they are composed of large voile-like nanosheets interlaced in a manner that fills in the available pore spaces. In this setting, the pore spaces represent prismatic perfection and net post structures.
2) Nitric acid modification enlarges the pores; however, this process decreases the specific surface area available. Compared with HNO3/AC, Mn loading forms new pore structures and increases the total specific surface area available, millipore specific surface area, and millipore pore volume. Modification conditions under which the loading quantity is 5% and the calcination temperature is 500 ℃, result in more favorable numbers of pore structures on Mn/AC-2.
3) As AC is composed of amorphous carbon, its ash content is substantially reduced when it is modified with nitric acid. The manganites formed from Mn/AC-1 are mainly composed of Mn3O4and a few Mn2O3crystals. Mn/AC-2 manganites are mainly composed of Mn3O4and some MnO crystals, and deoxidization of these manganites by AC results in a lower valence for Mn. Since the manganites of Mn/AC-3 are almost entirely made of Mn3O4, the diffraction peaks are keen-edged, and the degree of purity in the manganite crystals is higher.

5) The states of manganese on the Mn/AC catalyst surface are Mn4+, Mn3+, and Mn2+. A higher loading quantity is beneficial for increasing Mn4+species, whereas a higher calcination temperature can increase Mn3+species.
杂志排行
Journal of Southeast University(English Edition)的其它文章
- Bandwidth-enhanced dual-polarized antenna with improvedbroadband integrated balun and distributed parasitic element
- UAV trajectory planning algorithmfor data collection in wireless sensor networks
- A multi-attention RNN-based relation linking approach for question answering over knowledge base
- Q-learning-based energy transmission scheduling over a fading channel
- Time optimization for workflow scheduling based on the combination of task attributes
- Centre symmetric quadruple pattern-based illumination invariant measure
