Neurodynamics analysis of cochlear hair cell activity
2020-03-27WeifengRongRubinWngJinhiZhngWnzengKong
Weifeng Rong, Rubin Wng,b,*, Jinhi Zhng, Wnzeng Kong
a School of Computer Science, Hangzhou Dianzi University, Hangzhou 310018, China
b Institute for Cognitive Neurodynamics, East China University of Science and Technology, Shanghai 200237, China
Keywords:Hair cells Sound frequencies Membrane potential Power Outer hair cell amplification
ABSTRACT There have been many studies on the effect of cochlea basal membrane movement on the resolution of different frequencies and intensities. However, these studies did not take into account the influence of power and energy consumption of the hair cells in the process of the electromotility movement, as well as the neurodynamic mechanism that produced this effect. This makes previous studies unable to fully clarify the function of outer hair cells (OHCs) and the mechanism of sound amplification. To this end, we introduce the gate conductance characteristics of the hair cells in the mechanical process of increasing frequency selectivity. The research finds that the low attenuation of OHCs membrane potential and the high gain in OHC power and energy consumption caused that OHC amplification is driven by electromotility. The research results show that the amplification of the OHCs is driven by low attenuation of membrane potential and high gain of power and energy consumption. This conclusion profoundly reveals the physiological mechanism of the electromotility movement.
1 Introduction
The auditory nervous system converts external mechanical signals into neural signals, exhibiting ingenious signal processing mechanism. The frequency selection in the basilar membrane of the inner ears reflects its unique spatial encoding,wherein the sound frequencies are transformed into resonance at different positions in the basilar membrane [1-4]. In addition,hair cells, which are the receptors in the inner ear, transform the mechanical signals of basilar membrane oscillations into neural signals, which are critical for the transduction of auditory information [1, 2, 5].
The mechanical vibration of sound waves is then transferred into the inner ear after collection in the outer ear and amplification in the middle ear, leading to perilymph vibration in the inner ear [2, 6]. This vibration in turn causes basilar membrane oscillation, resulting in the movement of the organ of Corti as well as tectorial membrane. As the basilar and tectorial membranes move up and down around different axes, it causes shearing motion of the reticular lamina on the organ of Corti and the underlying surface of the tectorial membrane [1, 7, 8]. This shearing motion leads to deflection of stereocilia of the outer hair cells(OHCs) that connect with tectorial membrane in a specific direction. On the other hand, the stereocilia present in the inner hair cells do not connect with the tectorial membrane, and its deflection is caused by the flow of endolymph between the reticular lamina and the tectorial membrane. The deflections of the stereocilia modify the opening of mechanoelectrical transduction(MET) channels located on the stereocilia.
The stereocilia that exist on the top of the hair cells are infiltrated in the endolymph. However, the body of hair cells is infiltrated into the perilymph [9]. The endolymph in the scala media contained high concentration of K+and low concentration of Na+, which is similar to that in the intracellular fluid. In contrast,the perilymph in the scala vestibule and scala tympani comprises of low concentration of K+and high concentration of Na+[1, 3, 10]. If the potential of perilymph is 0 mV, then the potential of the endolymph in the scala media is as high as 80 mV, which is known as the endocochlear potential (EP). After the MET channels on stereocilia of hair cells are opened, the potential difference formed by the EP and negative potentials in the hair cells led to the flow of K+in the endolymph into hair cells to form receptor potential in the lateral membrane of hair cells [2, 11, 12].
The MET of hair cells occurs on the stereocilia, and the MET channels are present on the tip of the stereocilia. During the basilar membrane oscillations, the basilar membrane moves towards the scala vestibule, leading to shearing motion between the hair cells and the tectorial membrane. This subsequently causes deflection of stereocilia towards the exciting direction,and turns near the tall edge. This process increases the opening of MET channels, where more ions (mainly K+) enter the cell and depolarize the hair cells. If the basilar membrane moves towards the scala tympani, then the stereocilia deflects towards the inhibiting directions, deviating from the taller edge. This subsequently decreases the opening of MET channels, and repolarize the hair cells [9, 13, 14].
Therefore, basilar membrane oscillation causes deflection of stereocilia towards different directions, modulating the current flowing into the hair cells. The current flows into the hair cells through the apical membrane of the hair cells from the endolymph and flows out to the perilymph from the lateral membrane, and this is known as the transducer current. The voltage produced by the current on the lateral membrane is termed as the receptor potential [3, 15].
Through MET of hair cells, a mechanical signal of basilar membrane oscillation is then converted into a neural signal in hair cells. Hence, the auditory information can be transmitted through the auditory nerve to the auditory center of the brain,producing auditory perception [1, 16, 17].
The electromotility of the OHCs was found by Brownell et al.[18]. The electromotility of the OHCs converts the membrane potential to change the length of the OHCs, and the membrane potential depolarization causes the OHCs to shorten, while the membrane potential hyperpolarization leads to the elongation of OHCs [19]. The amplification of sound is driven by the electromotility of OHCs in the cochlea [18-20], which then depends on the lateral membrane potential of OHCs [20]. This amplification effect can be explored by studying the lateral membrane potential in OHCs.
In order to deeply understand the neurodynamic mechanism of hair cell activity during the cochlear basilar membrane oscillation, a hair cell model based on Hodgkin-Huxley equation was established in this study. Instead of MET channel conductance proposed by Howard and Hudspeth [21], MET channel conductance proposed by Mountain and Cody [22] was introduced . Numerical simulations were performed to analyze the neurodynamics of hair cell membrane potential, power and energy consumption by stimulating them at different frequencies.
The novelty of this paper is to calculate the power and energy consumption of hair cells during the process of movement,and to reveal the physiological mechanism of the electromotility,which has not been reported so far.
2 Mathematical model
2.1 Basilar membrane model
A model that maps sound frequencies to the best frequency positions of the basilar membrane was required.
In the present study, a basilar membrane model was utilized[23], and its simplified form was as follows
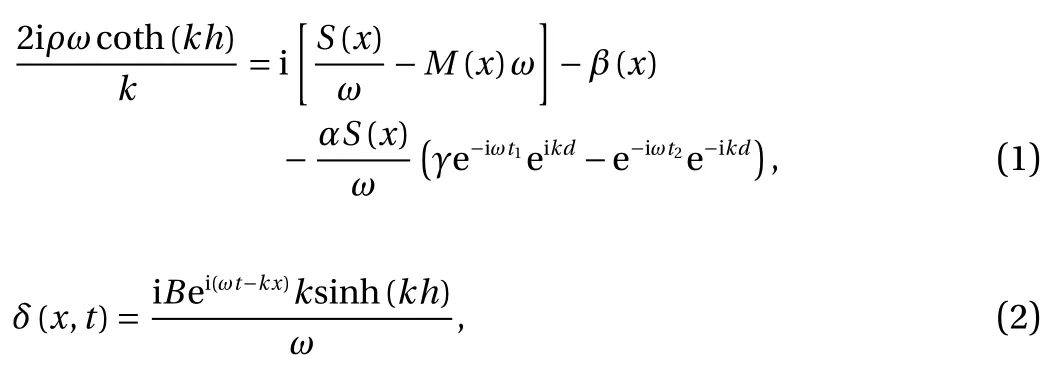
wherein, ρ represents the density of lymph fluid, h indicates the height of the cochlear duct, x is the distance from the stapes,S(x)is the stiffness coefficient of the basilar membrane per unit,M(x)represents the mass of the basilar membrane per unit,β(x)=is the damping of basilar membrane, ζ is the damping coefficient per unit, α is the motility factor of the OHCs,representing the outer hair cell force of basilar membrane displacement per unit, γ is the feed-forward/feed-backward ratio, representing the relative effects of the OHC force, d indicates the tilt distance, δ is the basilar membrane displacement, t1and t2represent the delay in action of OHC, and B represents a constant coefficient.
2.2 Hair cell model
The Hodgkin-Huxley model [24] is considered important in many neuron models, and is regarding as one of the best models to match the experiment results. The model was described as follows

However, the Hodgkin-Huxley model considers only the potassium current (IK), sodium current (INa), leakage current (IL)and external stimulus current (Iext) that do not correspond to the actual current in hair cells.
In order to make the Hodgkin-Huxley model suitable for hair cells, Catacuzzeno et al. [25, 26] analyzed the ion current during the release process of hair cells and established a hair cell model based on the Hodgkin-Huxley model. After that, Neiman et al.[27, 28] improved the model by adding mechanically-gated ion current, which coincides with the physiological mechanism of the hair cells. However, they did not consider the effects of different sound frequencies on hair cells and did not calculate the power and energy consumption of hair cells, making it impossible to understand the neurodynamic mechanism of hair cell activity during the basilar membrane oscillation.
This study established a hair cell model at the best frequency position in the basilar membrane based on the Hodgkin-Huxley model. The outward current included inward-rectifier potassium current (IK), delayed rectifier potassium current (IDRK), and calcium-activated potassium current (IKCa). The inward current included cation h-type current (Ih), voltage-gated calcium current (ICa), leakage current (IL), and mechanically-gated ion current (IMET). The specific model was described as follows

wherein, C was the membrane capacitor of hair cell and V was the lateral membrane potential.
Inward-rectifier potassium current (IK) included one rapid and one slow activation channel [26]. In the following equations,EK=-95 mV and gK=29 nS.

Cation h-type cationic current (Ih) had three independent activation channels [25]. In the following equations, Eh=-45 mV,and gh=2.2 nS.

Delayed rectifier potassium current (IDRK) had two independent activation channels [26]. In the following equations,PDRK=2.4×10⁻¹⁴L/s, [K]in=112 mM, [K]out=2 mM, F was Faraday constant, R was a universal gas constant and T=295.15 K.

Voltage-gated calcium current (ICa) had three independent activation channels [25]. In the following equations, ECa=42.5 mV, gCa=1.2 nS.

Calcium-activated potassium current (IKCa) had one activation channel. In the following equations, EKCa=-70 mV, and F was Faraday constant. For conductance, gKCa_IHC=50 nS (IHC means inner hair cell), while gKCa_OHCshowed variation [29, 30],with a logarithmic linear increase from the cochlear apex to the cochlear base. In this paper, gKCa_OHC=5×101.68bmx+1nS, wherein,“bmx” was the basilar membrane proportional distance from the cochlear apex.

In the leakage current (IL), EL=0 mV, gL=0.3 nS

IMETwas different from the other currents present on the lateral membrane. It flew into the hair cell from the top of the hair cells via the MET channels on the stereocilia (the main ion was potassium ion). The apical membrane potential of hair cells was subtracted from the endocochlear potential (VEP=80 mV). The K+concentration of the endolymph was similar to that of the intracellular fluid, and therefore EMET=0 mV [1]. Thus, the MET current (IMET) was described as follows

Herein, the method proposed by Mountain and Cody [22]was used for calculating the MET conductance (gMET), given by

wherein, gmaxwas the maximum of MET conductance, and x was the deflecting distance of the stereocilia. For gmax, gmax_IHC=11.2 nS, while gmax_OHCwas a variable, with a logarithmic linear increase from the cochlear apex to the cochlear base [29]. In this paper, gmax_OHC=1.12×100.7806bmx+1nS.
The movement of the stereocilia was sinusoidal [10], and Eq.(13) was thus set up as below

wherein A was a constant coefficient, and f was sound frequency.
Since 10% channels on the stereocilia were open when it was at a resting position without deflection (x = 0) [14, 31], the value of A could be calculated.
Through the above hair cell model, the hair cell membrane potential at different sound frequencies can be obtained.
2.3 Hair cell power model
Hair cell power could be calculated according to the Hodgkin-Huxley model as the hair cell model was based on the Hodgkin-Huxley model [32, 33]. The specific method was described as follows.
The energy contained in a hair cell was described as the sum of the potential energy stored in the membrane capacitor and the stored energy of the equivalent battery generated by Nernst potential of ions, which was presented by the equation below

The latter seven terms on the right side of Eq. (14) were difficult to calculate directly. But the rate of change for each term was equal to the current through the equivalent battery multiplied by its electromotive force (Nernst potential) [31]. So, the total power P(t) was the derivative of H(t) over time

Equation (16) was obtained by putting Eq. (4) into Eq. (15)

wherein, the left side was the total power, while various items on the right side indicated the power of various ion channels,respectively.
By the above method, the hair cell power at different sound frequencies can be obtained. Then, by integrating Eq. (16) during the stimulation time, the hair cell energy consumption at different sound frequencies during the period can be obtained.
3 Results and discussion
3.1 Position response of basilar membrane at different sound frequencies
In Eq. (1), k was a function of x. Therefore, k could be solved by iteration, which was later placed into Eq. (2) to solve the basilar membrane displacement δ. Thus, the plot of the position response of basilar membrane at any sound frequency could be obtained (Fig. 1).
The peak in Fig. 1 indicated the best frequency positions of the basilar membrane at different frequencies. This suggested that the resonance position of the characteristic frequency was consistent with that of the physiological characteristics, so that the best frequency position of the basilar membrane stimulated by high-frequency sound was close to the base of the cochlea,while that stimulated by the low-frequency sound was distal from the base of the cochlea.
Based on Fig. 1, the characteristic frequency and best frequency position could be fitted as shown in Fig. 2.
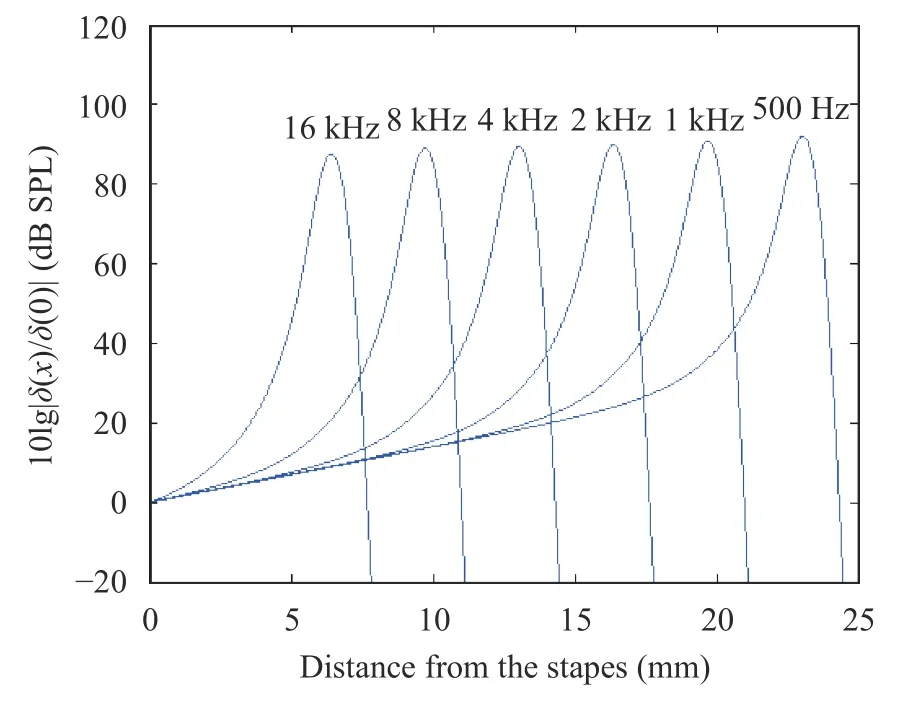
Fig. 1. Position response of basilar membrane at different sound frequencies (SPL means sound pressure level)
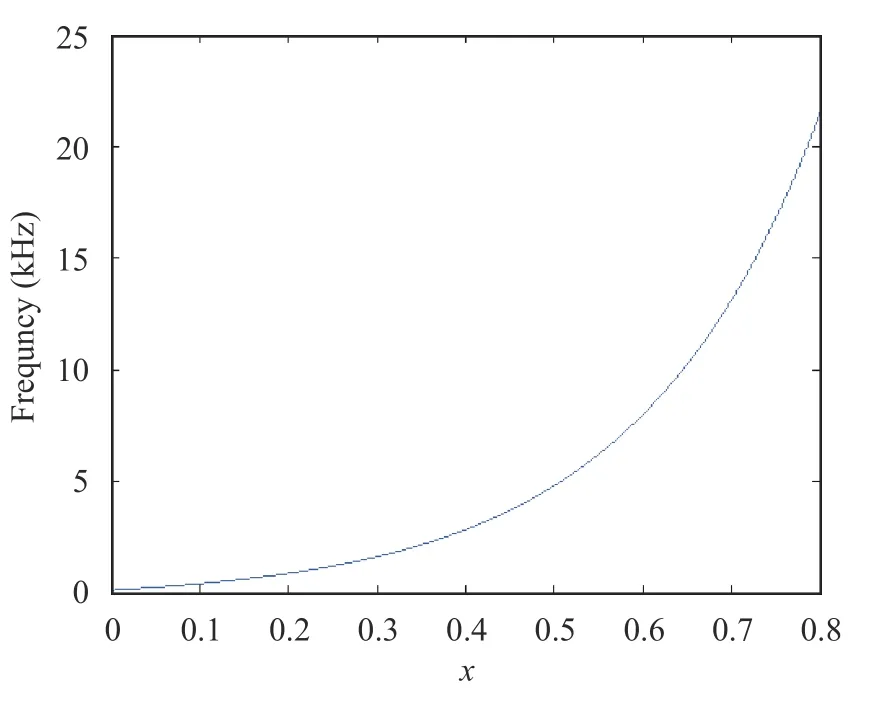
Fig. 2. Best frequency positions of characteristic frequencies
In Fig. 2, the horizontal axis represented the equal distance of the resonance position of characteristic frequency to the top of the cochlea, while the vertical axis was the voice frequency,and the curve expression was as follows

Figure 2 was highly consistent with the physiological data [34].
3.2 Hair cell membrane potential at different sound frequencies
To study the effect of sound frequencies on hair cell membrane potential during the basilar membrane oscillation, the simulation experiments in Figs. 3 and 4 were conducted in this section. Among them, the sound stimuli ranged from 10 ms to 50 ms, and the sound frequencies were divided into three levels f =500 Hz, 1000 Hz, and 2000 Hz.
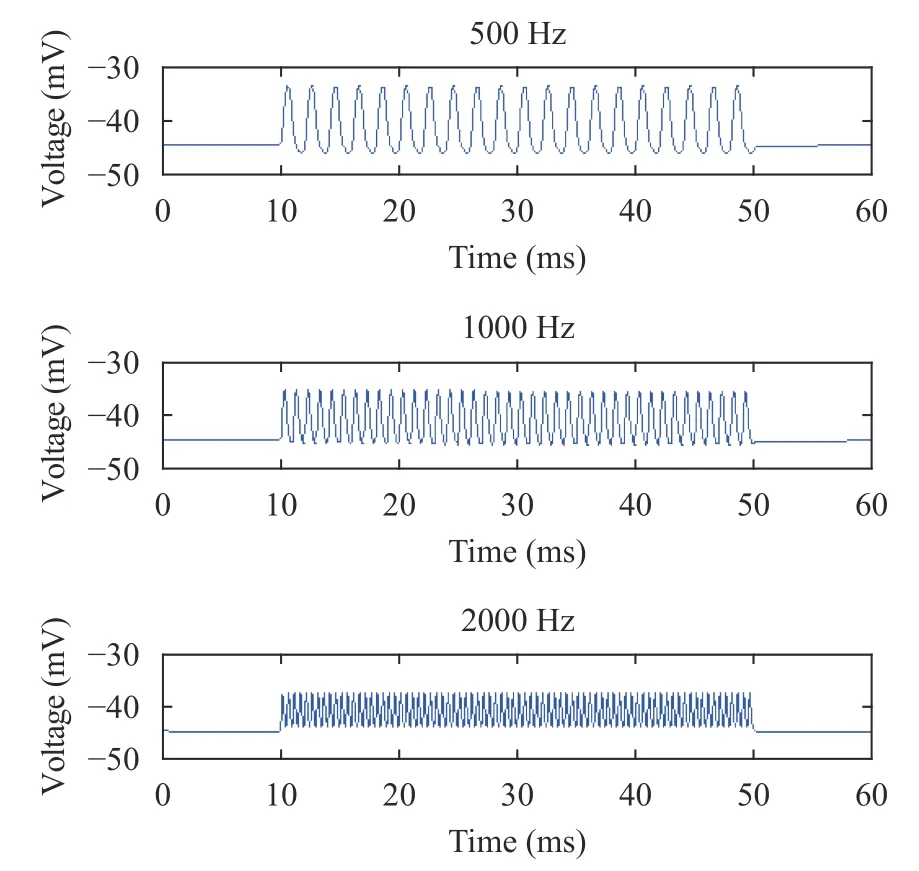
Fig. 3. Membrane potentials of IHC (from top to bottom) at 500 Hz,1000 Hz, and 2000 Hz
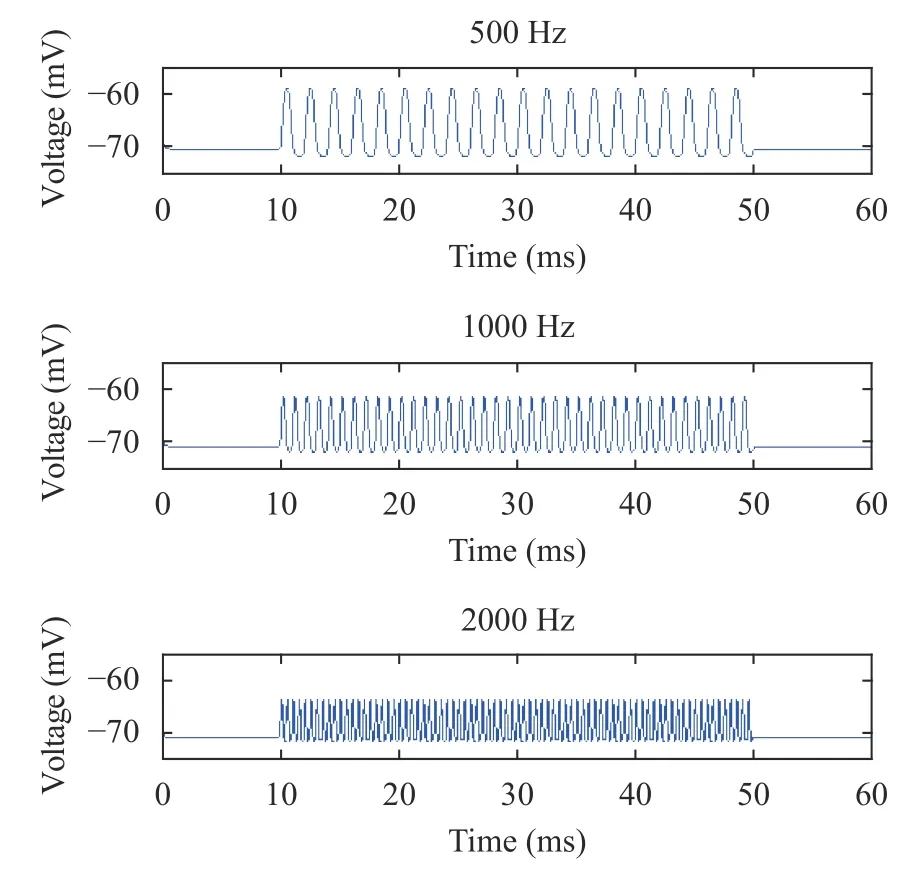
Fig. 4. Membrane potentials of OHC (from top to bottom) at 500 Hz, 1000 Hz, and 2000 Hz
In Figs. 3 and 4, as the sound frequencies increased, the peak values of the hair cell membrane potential were gradually decreased, while the valley values were gradually increased. The overall result suggested that the range of the hair cell membrane potential was gradually lowered. This was consistent with the physiological experimental data [35], and reproduced the detailed characteristics of the hair cell membrane potential during the basilar membrane oscillation, confirming the neurodynamic properties of hair cells. This indicated that the hair cell model established at different sound frequencies during the basilar membrane oscillation in this paper was reasonable.
Additionally, with the increase of sound frequencies and the change of hair cell membrane potential, the relationship between sound frequency and hair cell membrane potential was extensively studied. The sound frequencies were in the range of 0.1-20 kHz, and the range of hair cell membrane potential was ΔV. The simulation results were shown in Fig. 5.
In Fig. 5, the solid blue line and the green dotted line represents the range of membrane potential of IHC and OHC at the best frequency position of the basilar membrane at different sound frequencies, respectively. When the sound frequency was increased, both IHC and OHC membrane potentials were attenuated. Before 1000 Hz, OHC was decayed faster than IHC, but both showed less attenuation, and after 1000 Hz, IHC was attenuated faster than OHC.
According to Fig. 5, the attenuation of IHC membrane potential was calculated to be -16.3516 dB/decade, and the attenuation of OHC membrane potential was lower, which was-8.7562 dB/decade. The low attenuation of OHC membrane potential suggested that the cochlear amplification was caused due to the electromotility of OHCs [29]. This calculation result was consistent with the experimental data in Ref. [29].
3.3 Hair cell membrane potential at different basilar membrane regions
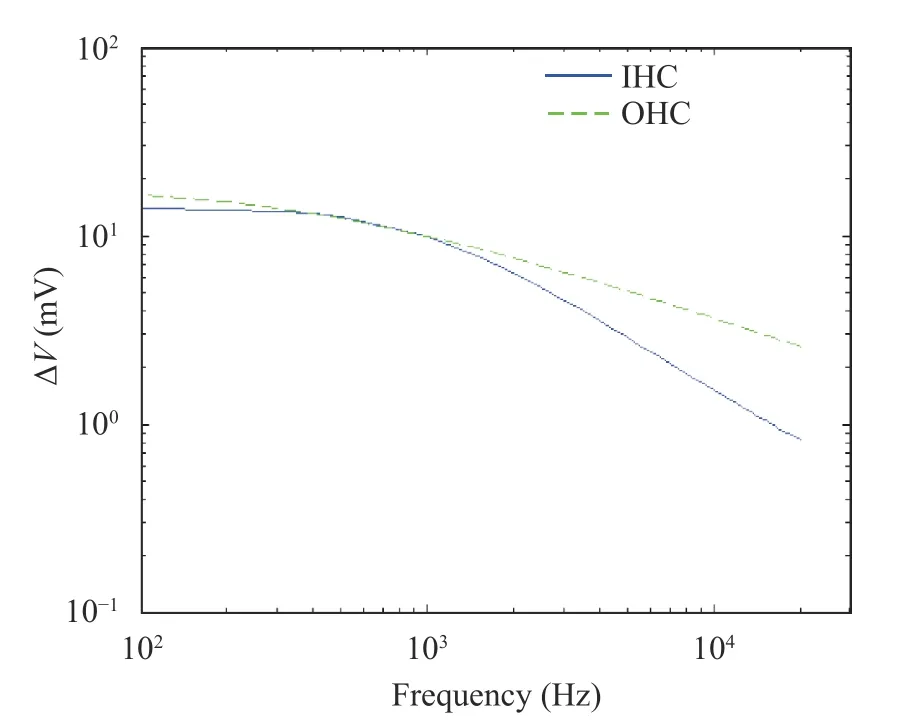
Fig. 5. Range of hair cell membrane potential at different frequencies
The amplitude of basilar membrane was increased as the basilar membrane regions approached the best frequency position [1, 3], which was also confirmed in Fig. 1. At the position that is not the best frequency position, a decrease in the amplitude of basilar membrane led to a decrease in the deflection of stereocilia, thereby indicating a decrease in the A value.
If suppose, the best frequency position at a specific frequency was x (x was the distance to the stapes), the amplitude of basilar membrane could be calculated as y by the basilar membrane model. If a position that is not the best frequency position x1, the amplitude of the basilar membrane at this position was y1 that could be calculated by the same method. Thus, the deflection of stereocilia at this position wasthereby providing the hair cell membrane potential.
Since the traveling wave of basilar membrane attenuated rapidly after the peak, and stopped vibration at a position slightly away from that [1, 2], the hair cell membrane potential of the basilar membrane before the peak was only analyzed.
To study the effect of basilar membrane regions on hair cell membrane potential during the basilar membrane oscillation,the hair cell membrane potentials at 5 mm and 15 mm to the staples, as well as the best frequency position were plotted.Among them, the sound stimuli ranged from 10 ms to 50 ms, and the sound frequencies were 500 Hz.
In Fig. 6, the peak value of IHC membrane potential was gradually increased as the basilar membrane region approached the best frequency position. However, the valley value showed a very slight change. The changes in the peak value and the valley value led to a gradual increase in the range of hair cell membrane potential. And from Fig. 7, it has been deduced that OHC have the same pattern.
To analyze the relationship between basilar membrane regions and hair cell membrane potential on it more intuitively,the peak value, valley value, and range at different basilar membrane regions at 500 Hz was plotted.
The horizontal axis of Fig. 8 indicated that the ratio of basilar membrane amplitude (y1) to the basilar membrane amplitude at the best frequency position (y). y 1/y represented represents the distance of basilar membrane region to the best frequency position (0 meant the farthest and 1 meant the nearest).
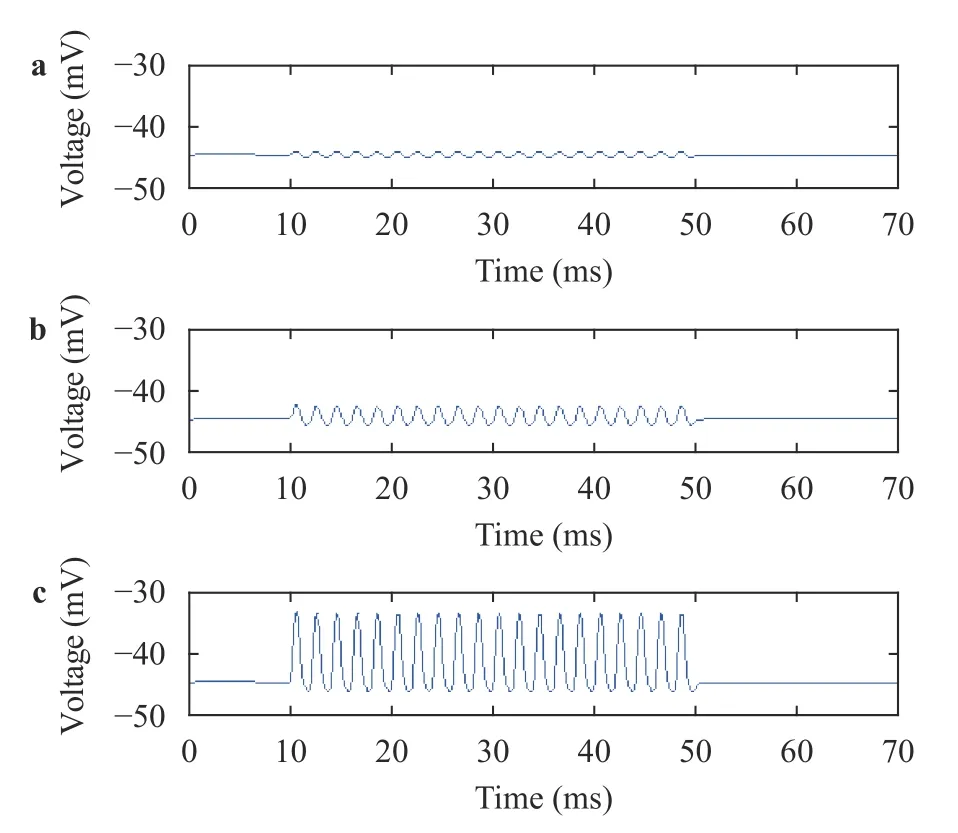
Fig. 6. Membrane potentials of IHC at a 5 mm, b 15 mm, and c best frequency positon at 500 Hz
Figure 8 showed that the peak value of IHC membrane potential was gradually increased as the basilar membrane region approached the best frequency position; however, the valley value remained almost the same. The overall result suggested that the range of IHC membrane potential was gradually increased. This indicated that the effect of the basilar membrane region on hair cell membrane potential was mainly at the peak value. And in case of OHC, it was similar.
3.4 Hair cell power and energy consumption at different sound frequencies
To study the effect of sound frequencies on hair cell power and energy consumption during the basilar membrane oscillation, simulation experiments (Figs. 9 and 10) were conducted in this section. Among them, the sound stimuli ranged from 10 ms to 50 ms, and the sound stimulation frequencies were divided into three levels: f = 500 Hz, 1000 Hz, and 2000 Hz.
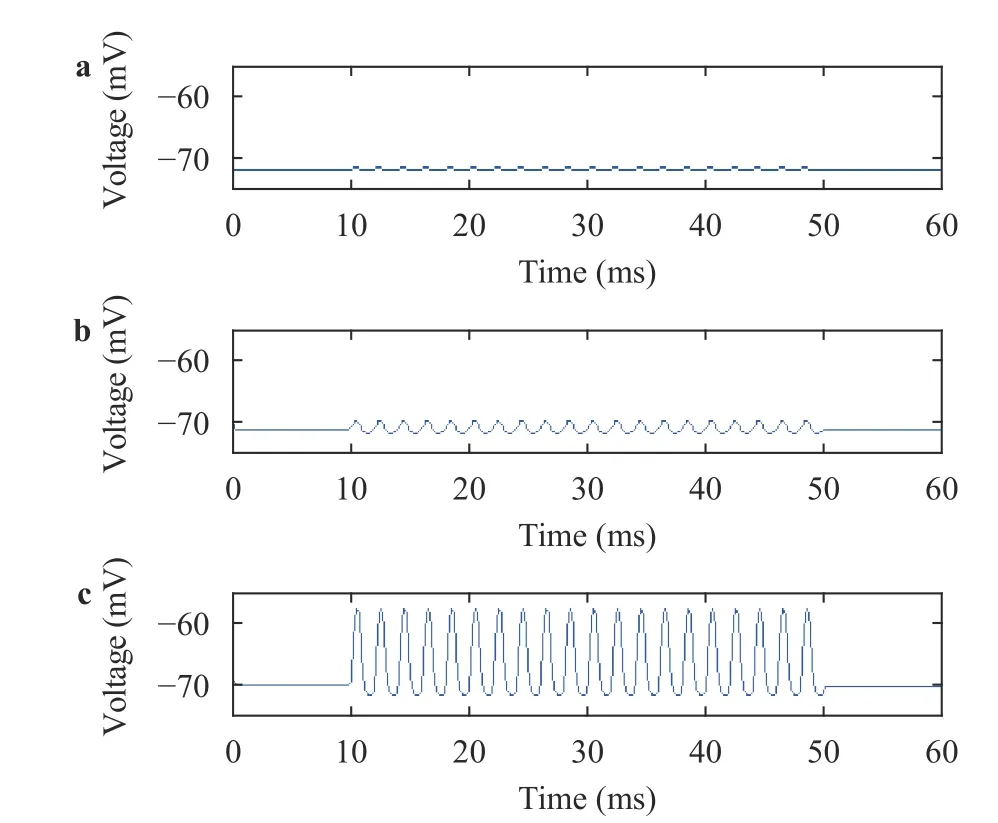
Fig. 7. Membrane potentials of OHC at a 5 mm, b 15 mm, and c best frequency positon at 500 Hz
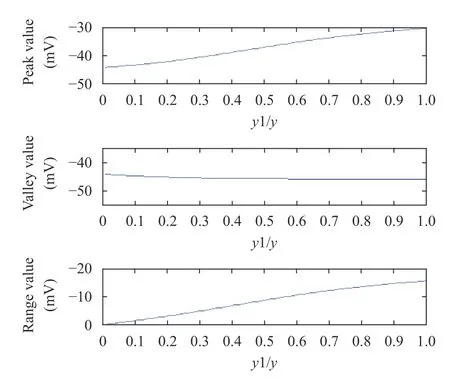
Fig. 8. Peak value, valley value, and range (from top to bottom) of IHC membrane potential at different basilar membrane regions
For IHC (Fig. 9), the peak value, valley value, and the range of the power were slightly changed with increasing sound frequencies. For OHC (Fig. 10), the peak value was gradually increased,while the valley value was gradually decreased with the increasing sound frequencies, leading to a gradual increase in the range. These results showed that the sound frequencies had significant effect on the power of OHC rather than IHC. The numerical simulation results of hair cells in Figs. 10 and 11 are consistent with the experimental data of hair cell physiology under different sound frequencies in Ref. [34].
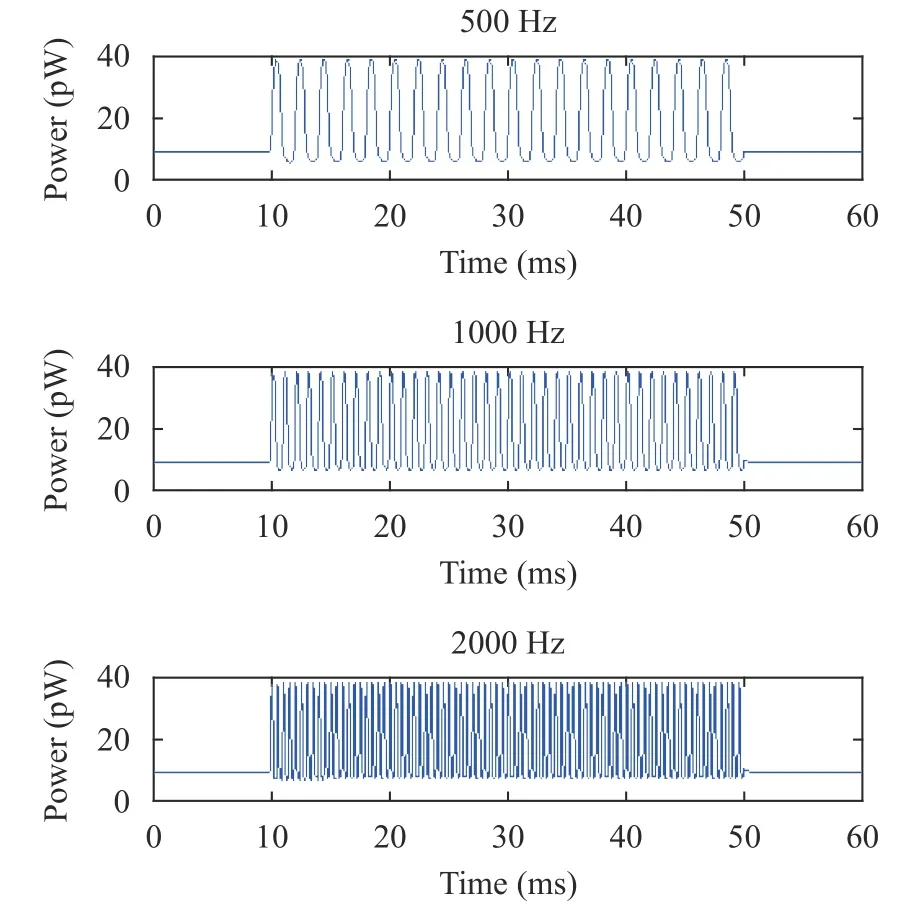
Fig. 9. Power of IHC (from top to bottom) at 500 Hz, 1000 Hz, and 2000 Hz.
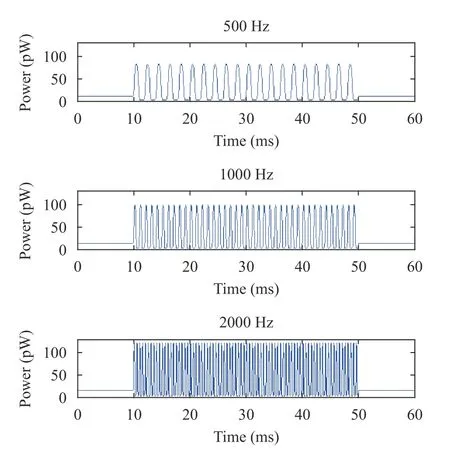
Fig. 10. Power of OHC (from top to bottom) at 500 Hz, 1000 Hz, and 2000 Hz (1 pW = 1×10-12 W)
In addition, the increasing sound frequencies and changing hair cell power were studied to analyze the relationship between sound frequency and hair cell power extensively. The sound frequencies were in the range of 0.1-20 kHz, and the range of hair cell power was Δ P. The simulation results were shown in Fig. 11.
In Fig. 11, the solid blue line and the green dotted line represents the range of power of IHC and OHC at the best frequency position of the basilar membrane at different sound frequencies, respectively. In Fig. 11, if the sound frequency was increased, the IHC power was attenuated, but the amplitude remained small. OHC power demonstrated a large gain. According to Fig. 11, the attenuation of IHC power was calculated to be-0.0084 dB/decade, and the gain of OHC power was 6.9592 dB/decade.
Then, the energy consumption of different frequencies during 40 ms stimulation time was calculated by integrating the hair cell power.
In Fig. 12, the solid blue line and the green dotted line represents the energy consumption of IHC and OHC at the best frequency position of the basilar membrane at different sound frequencies, respectively. According to Fig. 12, when the sound frequency was increased, the energy consumption of IHC was increased, but the amplitude remained small. The energy consumption of OHC was significantly increased. According to Fig.12, the gain of IHC energy consumption was calculated to be 0.1216 dB/decade, and the gain of OHC energy consumption was 6.5259 dB/decade.
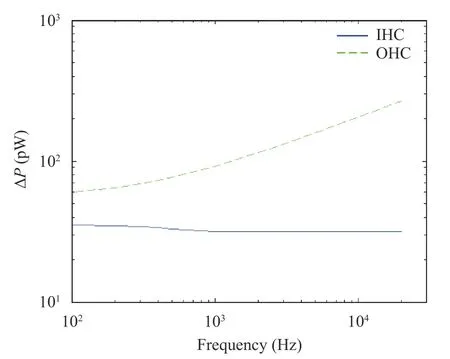
Fig. 11. Range of hair cell power at different frequencies
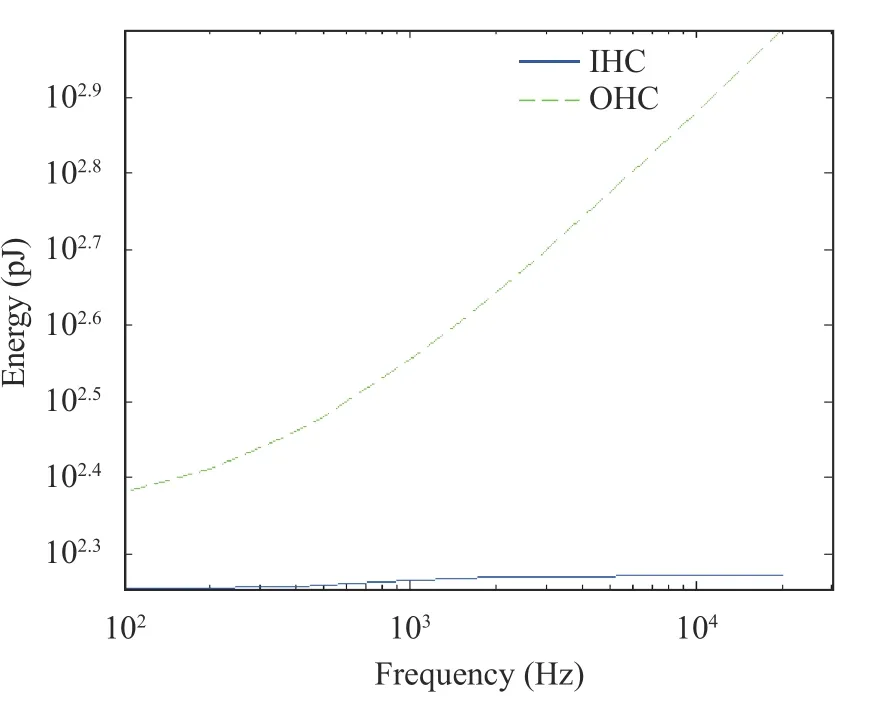
Fig. 12. Hair cell energy consumption at different frequencies (1 pJ= 1×10-12 J)
Compared to IHC, the power and energy consumption of OHC showed a significantly high gain with the increase of sound frequencies, reflecting the electromotility of OHCs. When the sound frequencies are increased, then the oscillation frequency of the basilar membrane was also increased, resulting in increased number of lengthening and shortening OHCs, and the power and energy consumed are naturally increased. The high gain of OHC power and energy consumption also supported, in a certain sense, that the OHC amplification was driven by electromotility.
4 Conclusion
To profoundly understand the neurodynamic mechanism of hair cell activity and function during the cochlear basilar membrane oscillation, a hair cell model based on Hodgkin-Huxley equation was established. Numerical simulations were performed to analyze the neurodynamics of hair cell membrane potential, power and energy consumption by stimulating at different frequencies. The results showed that in the range of 0.1-20 kHz, the attenuation of the membrane potential of OHCs was lower than that of IHCs, which was only -8.7562 dB/decade. The effect of the basilar membrane region on the hair cell membrane potential is mainly present at the peak value. The gain in the power and energy consumption of OHCs was much higher than those of IHCs, which were 6.9592 dB/decade and 6.5259 dB/decade, respectively.
The results showed that the IHCs and OHCs have different functions under different frequencies. The functional differences between them indicated that the IHCs exist as receptive cells, while the OHCs play an important role in sound amplification.
The low attenuation of OHC membrane potential and the high gain in OHC power and energy consumption supported the view that OHC amplification is driven by electromotility. The differences in the membrane potentials of IHC and OHC reflected different functions, where IHCs work as sensory cells, and OHCs play a role in sound amplification [9, 29]. This novel conclusion profoundly illustrated the physiological mechanism of electrokinesis, which is of great significance for improving the operating principle of the artificial cochlea in future, and provides an important guiding significance for improving the working quality of the artificial cochlea in the field of manufacturing.
Acknowledgments
This study was funded by the National Natural Science Foundation of China (Grants 11232005, 11472104, 11872180,61633010, and 61473110).
杂志排行
Theoretical & Applied Mechanics Letters的其它文章
- Micromechanical analysis on tensile properties prediction of discontinuous randomized zalacca fibre/high-density polyethylene composites under critical fibre length
- Prolonged simulation of near-free surface underwater explosion based on Eulerian finite element method
- Minimizing electrostatic interactions from piezoresponse force microscopy via capacitive excitation
- Spatial artificial neural network model for subgrid-scale stress and heat flux of compressible turbulence
- An analytical model to predict diffusion induced intermetallic compounds growth in Cu-Sn-Cu sandwich structures
- Molecular investigation on the compatibility of epoxy resin with liquid oxygen
